Marathon Petroleum: quarterly profit up 4.2x on refining margin spike, but the market has already priced it in
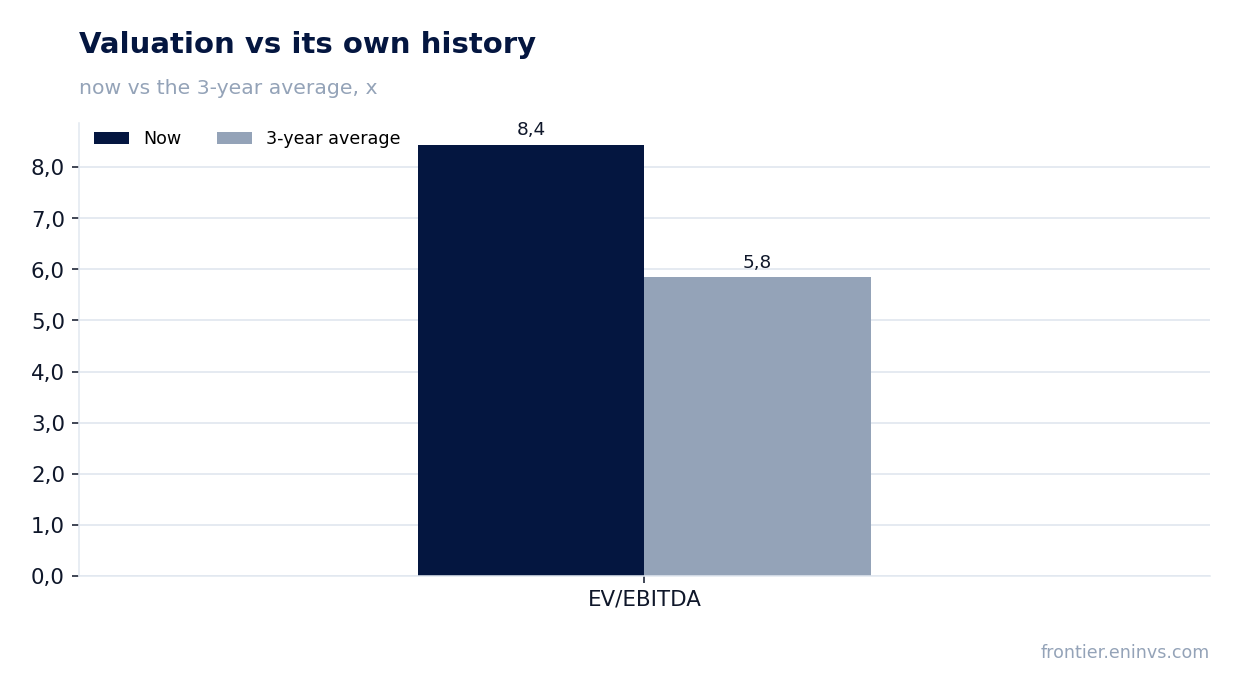
On August 4, 2026, Marathon Petroleum reported second-quarter 2026 results: revenue rose 53.8% YoY to $51,994 million, EBITDA jumped 173.3% to $8,160 million, and net profit surged 322.5% to $5,138 million. The growth was driven by a sharp increase in refining margins (from $17.58 to $36.33 per barrel) and strong fuel demand. The shares look attractive: EV/EBITDA (8.4x) is below its own three-year average (5.8x), and the portal's model implies 28% upside.
Key takeaways
— Revenue grew 53.8% thanks to record refining margins and strong fuel demand
— EBITDA doubled due to wider crack spreads across all regions
— Net profit rose 4.2x, but almost all of it is operating, with no one-off items
— Operating cash flow reached $10.3 billion in the quarter, covering capex and capital returns
— Dividend yield is modest (1.0%), but the company is actively buying back shares
— Leverage remains moderate: net debt / EBITDA at 1.69
— Shares trade at a discount to their own history and have upside per the portal's model
Attractiveness
Key figures, USD bn
| Metric | Q2 2025 | Q2 2026 | Change |
|---|---|---|---|
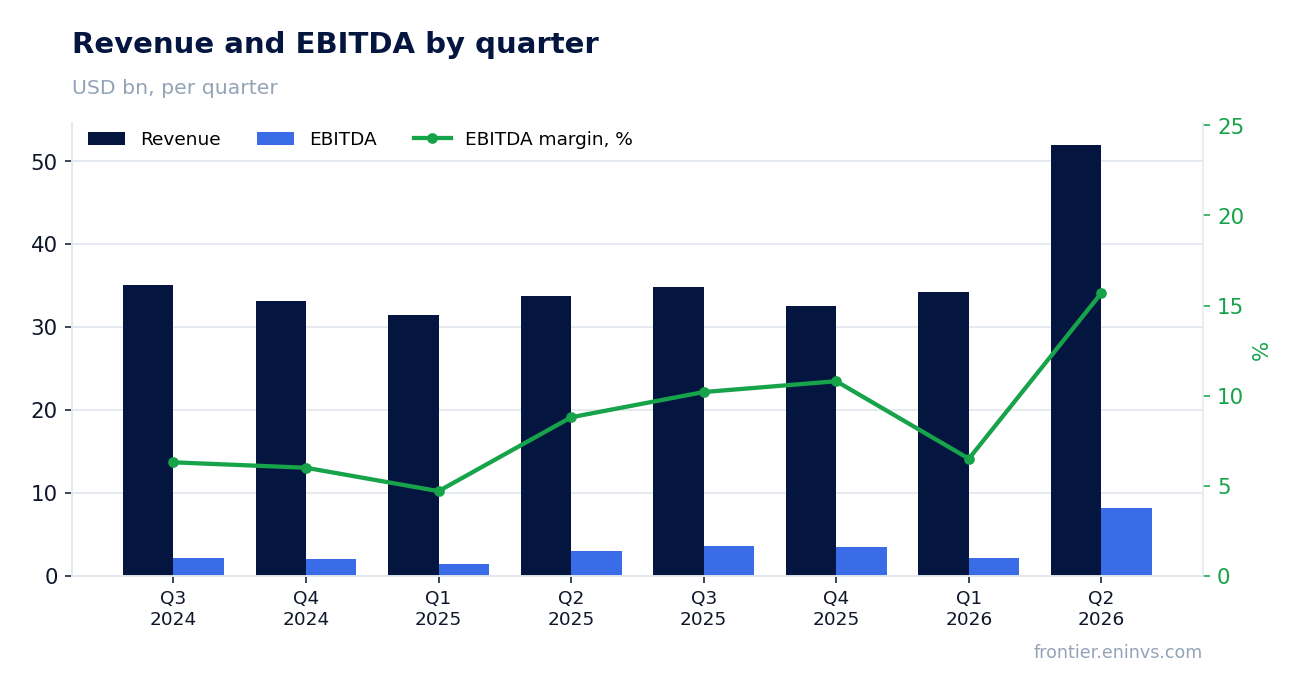
| Revenue | 33.8 | 52.0 | +53.8% |
| EBITDA | 2.99 | 8.16 | +173.3% |
| Operating profit | 2.20 | 7.32 | +233.3% |
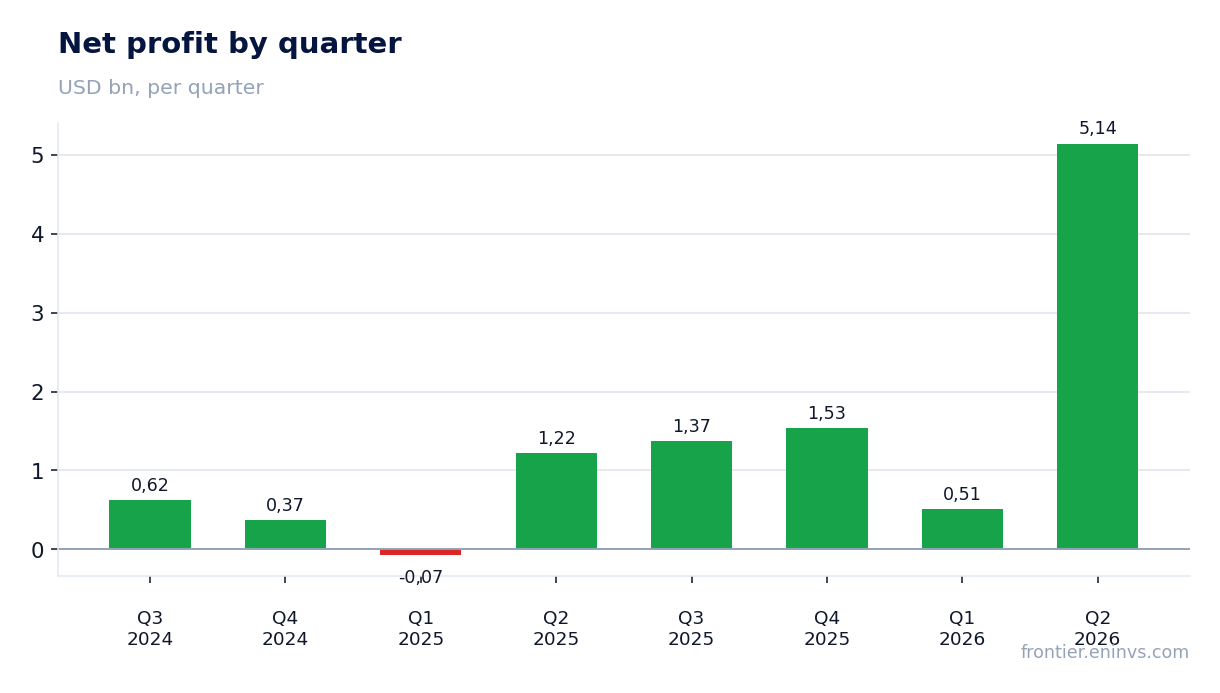
| Net profit | 1.22 | 5.14 | +322.5% |
| Operating cash flow | 2.64 | 10.3 | +291.3% |
| Capex | 0.69 | 1.19 | +70.6% |
| EBITDA margin | 8.8% | 15.7% | +6.9 pp |
| Net margin | 3.6% | 9.9% | +6.3 pp |
Revenue grew 53.8% thanks to record refining margins and strong fuel demand
In Q2 2026, Marathon Petroleum's revenue reached $51,994 million, up 53.8% YoY from $33,799 million. The main contribution came from the Refining & Marketing segment: refining margin rose from $17.58 to $36.33 per barrel, while capacity utilization remained high at 94%.
Margin growth was seen across all regions: Gulf Coast margin increased from $15.17 to $36.52 per barrel, Mid-Continent from $17.86 to $33.68, and West Coast from $23.18 to $41.28. The company attributes this to higher crack spreads and resilient consumer demand.
Throughput volumes declined slightly (from 3,060 to 2,944 thousand barrels per day) due to planned turnarounds, but this was offset by higher margins.
EBITDA doubled due to wider crack spreads across all regions
EBITDA for Q2 2026 was $8,160 million, up 173.3% YoY from $2,986 million. Adjusted EBITDA, per the company, reached $8,460 million versus $3,286 million in Q2 2025.
The main contribution came from Refining & Marketing: adjusted EBITDA rose from $1,890 million to $6,655 million, or from $6.79 to $24.84 per barrel. The Renewable Diesel segment also improved from a loss of $19 million to a profit of $258 million, driven by higher margins and better regulatory credit values.
The Midstream segment (MPLX) showed moderate growth: adjusted EBITDA increased from $1,641 million to $1,778 million due to higher rates and throughputs, partially offset by divestitures of non-core assets.
Net profit rose 4.2x, but almost all of it is operating, with no one-off items
Net income attributable to Marathon Petroleum shareholders for Q2 2026 was $5,138 million versus $1,216 million a year earlier – a 4.2x increase. Diluted EPS rose from $3.96 to $17.73.
There are no significant one-off items: adjusted net income matches reported ($5,138 million). In H1, a clean fuel production tax credit of $32 million was recognized, but it did not affect quarterly results.
Net margin doubled from 3.6% to 9.9%, reflecting operating leverage: with revenue up 54%, operating profit more than tripled (from $2,197 million to $7,322 million).
Operating cash flow reached $10.3 billion in the quarter, covering capex and capital returns
Operating cash flow in Q2 2026 was $10,327 million – four times higher than a year earlier ($2,639 million). Capital expenditures rose from $695 million to $1,186 million, but free cash flow remains substantial.
The company returned $2.8 billion to shareholders via dividends and buybacks. At quarter-end, $6.1 billion remained under share repurchase authorizations.
The strong cash flow is driven by higher EBITDA and improved working capital. This allows funding investment projects (including MPLX expansion) while increasing capital returns.
Dividend yield is modest (1.0%), but the company is actively buying back shares
Over the trailing twelve months, Marathon Petroleum paid dividends corresponding to a yield of 1.0% at the current price. This is below the market average, but the company compensates with aggressive buybacks: $2.8 billion returned in the quarter, with the majority likely from buybacks.
MPLX, in which Marathon Petroleum owns the general partner and a majority interest, plans to increase distributions by 12.5% annually in 2026 and 2027, supporting the parent's dividend flows.
At the current price and trailing twelve-month profit of $8,554 million, the dividend payout looks sustainable, but if the company prefers to direct free cash flow to buybacks, dividends may remain modest.
Leverage remains moderate: net debt / EBITDA at 1.69
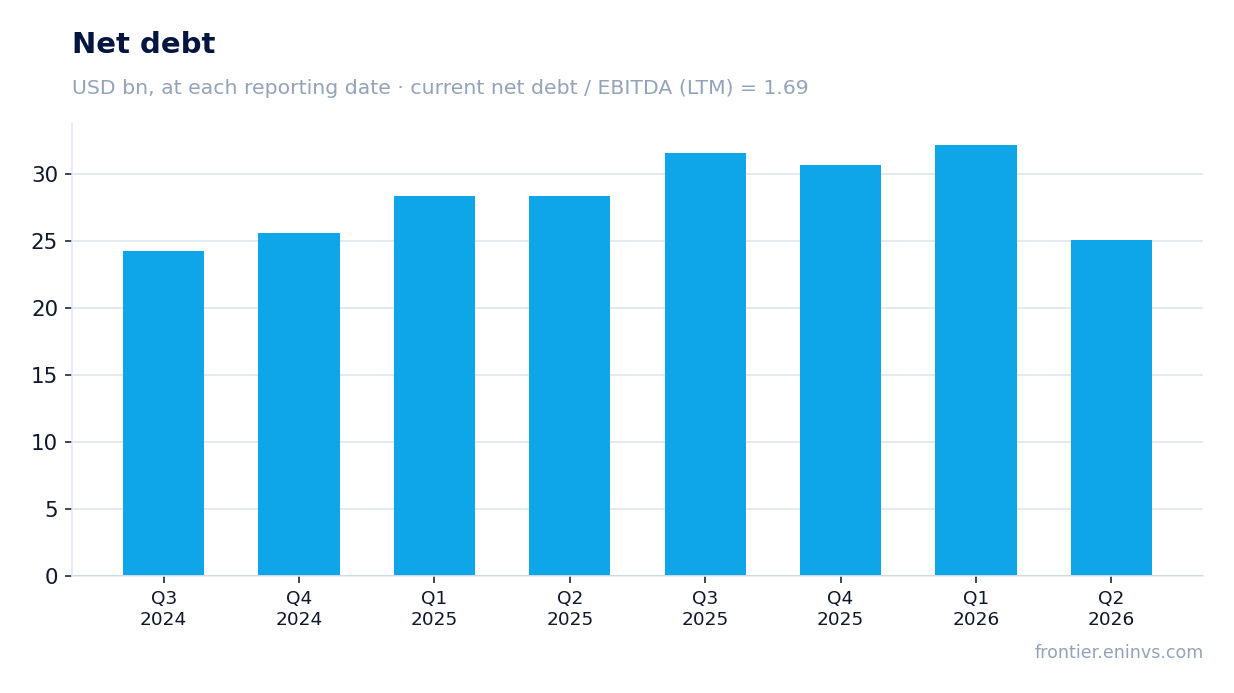
At the end of Q2 2026, Marathon Petroleum's net debt was $25,048 million, down $7.1 billion from the previous quarter ($32,175 million). The net debt to EBITDA ratio for the trailing twelve months is 1.69, which is comfortable for a refining company.
The debt reduction was driven by strong operating cash flow: the company used part of the proceeds to repay debt while maintaining investments and capital returns.
Total debt on the balance sheet is $32,816 million, of which $25,640 million is at MPLX. Cash and equivalents stand at $7,768 million, including $1 billion at MPLX.
Shares trade at a discount to their own history and have upside per the portal's model
The current EV/EBITDA multiple is 8.4x (based on trailing twelve-month EBITDA of $18,117 million), which is above the three-year average of 5.8x. However, P/E LTM is 14.3x, which looks moderate for a company with growing earnings.
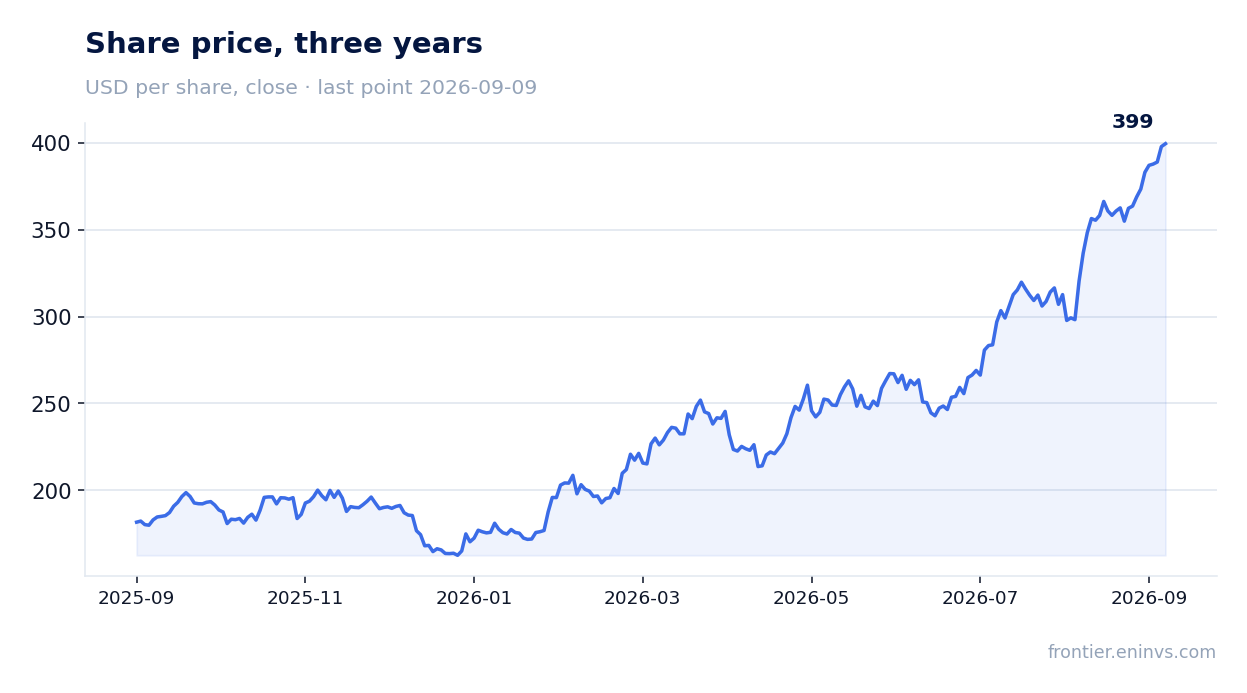
Since the earnings release (August 4), shares have risen 30.1% by September 9, reflecting the market's positive reaction to strong results. Before the release, the closing price was $307.03, and on the release day it was +1.8%.
According to the portal's model, which re-prices EBITDA at current commodity prices and target EV/EBITDA, the upside potential is +28% relative to the current market cap ($122,229 million). This suggests the stock is still undervalued despite the recent rally.
Valuation on the latest reported figures
| Metric | Value |
|---|---|
| Market cap | 122 bn USD |
| P/E (LTM) | 14.3 |
| EV/EBITDA (LTM) | 8.4 |
| P/B | 7.06 |
| Net debt / EBITDA (LTM) | 1.69 |
| Operating cash flow (LTM) | 8.30 bn |
| ROE | 96.8% |
| Dividend yield (12m) | 1.0% |
| EV/EBITDA, 3-year average | 5.8 |
Bottom line
Marathon Petroleum's Q2 2026 report was strong: revenue and EBITDA grew multifold thanks to record refining margins, and operating cash flow reached $10.3 billion, allowing debt reduction and $2.8 billion returned to shareholders. However, these results largely reflect favorable market conditions that could change. The stock trades at an EV/EBITDA of 8.4x, above its own three-year average, but the portal's model indicates 28% upside. Verdict: 'attractive' – the company generates significant free cash flow, reduces debt, and returns capital, and the current price does not fully reflect these factors.
Open the company's financial profile MPC →
See also: market overview · valuation map · stock screeners