OMV: revenue up 41.7%, but Q2 profit is nearly a third of Q1
On 25 August OMV released its Q2 2026 results. Revenue rose 41.7% year on year to USD 9.3 bn, EBITDA added 52.9% to USD 2.1 bn, and net profit increased 115.0% to USD 628.8 mn. However, quarter on quarter profit fell sharply: in Q1 it was USD 1.74 bn, boosted by a one-off factor. Net debt rose to USD 4.5 bn, and the EV/EBITDA multiple of 4.12x is nearly double its own three-year average of 2.33x. With a dividend yield of 6.16% and the portal model implying a 32% downside to fair value, the share looks unattractive at current levels.
Key takeaways
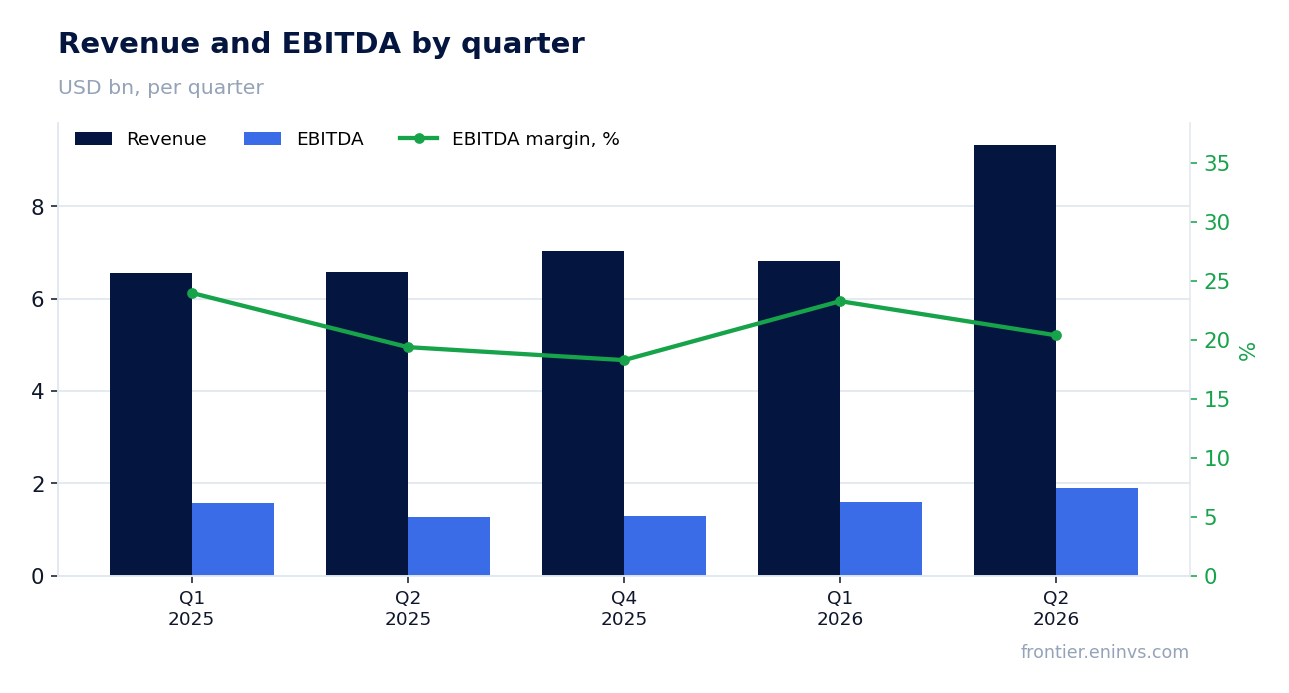
— Q2 revenue rose 41.7% year on year to USD 9.3 bn, but the quarterly dynamics are distorted by a low base last year
— EBITDA added 52.9% year on year, with the margin rising to 22.6% from 20.9% a year earlier
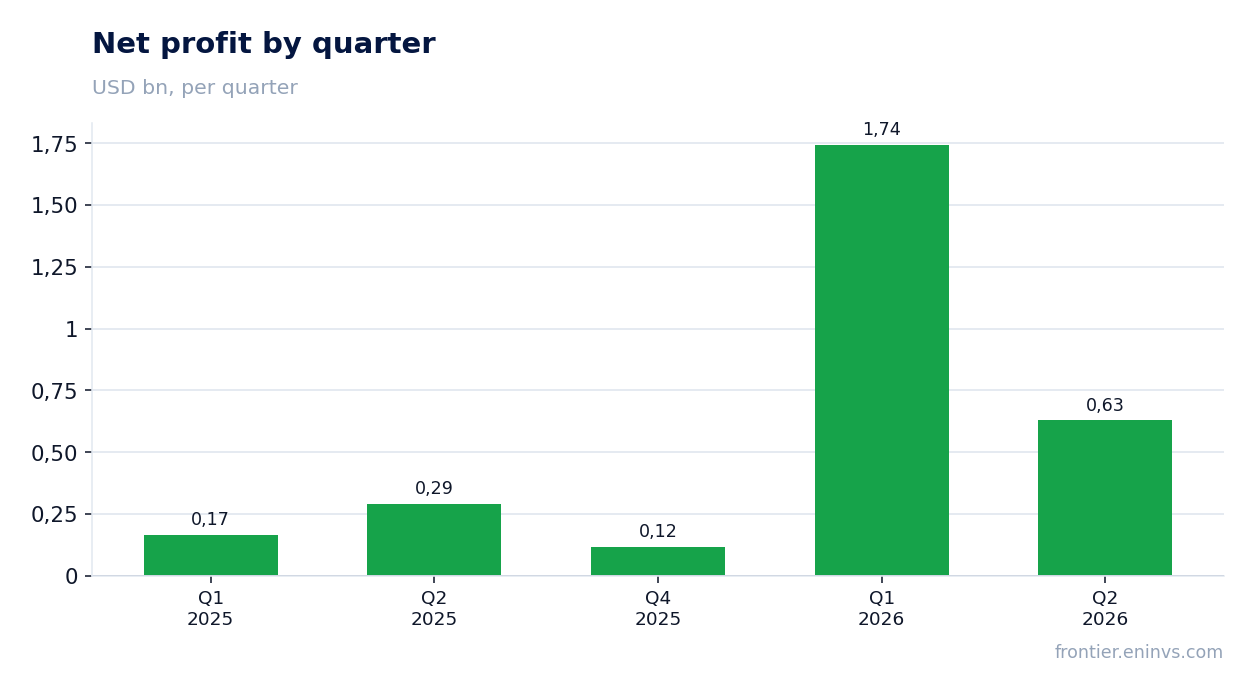
— Q2 net profit was USD 628.8 mn, 2.8 times lower than in Q1, which included a one-off factor
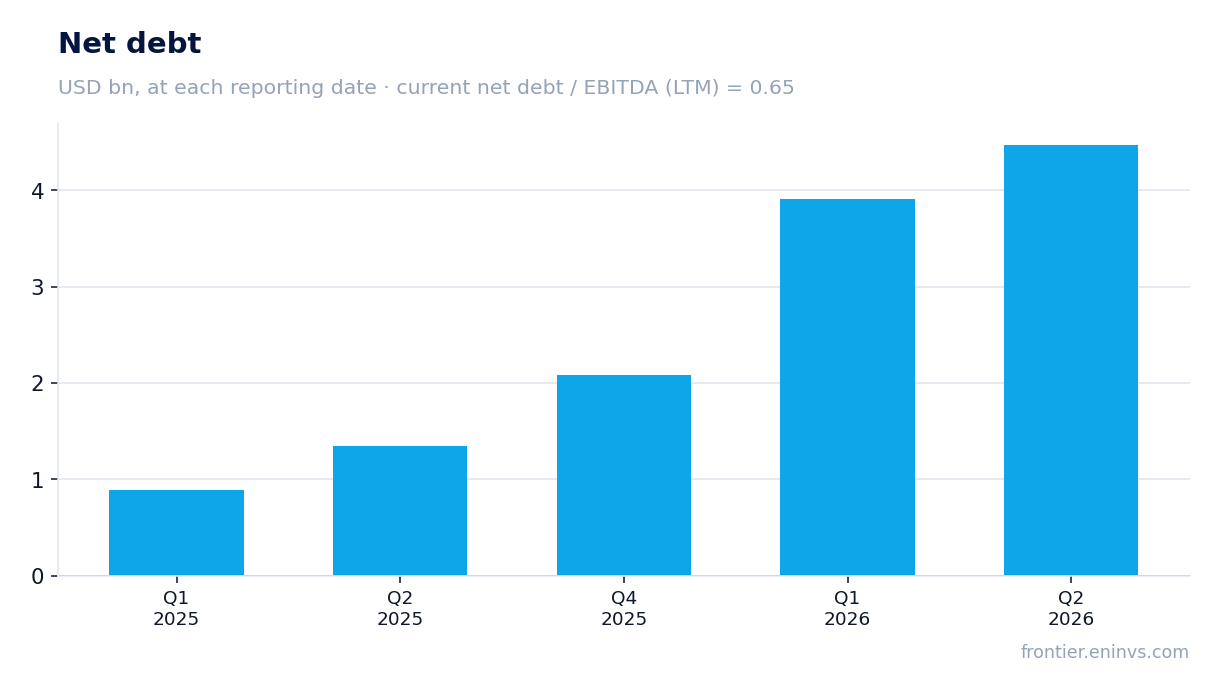
— Net debt rose to USD 4.5 bn from USD 1.3 bn a year earlier, but the net debt/EBITDA LTM ratio remains low at 0.65
— The 6.16% dividend yield looks moderately attractive, but the payout may fall due to lower quarterly profit
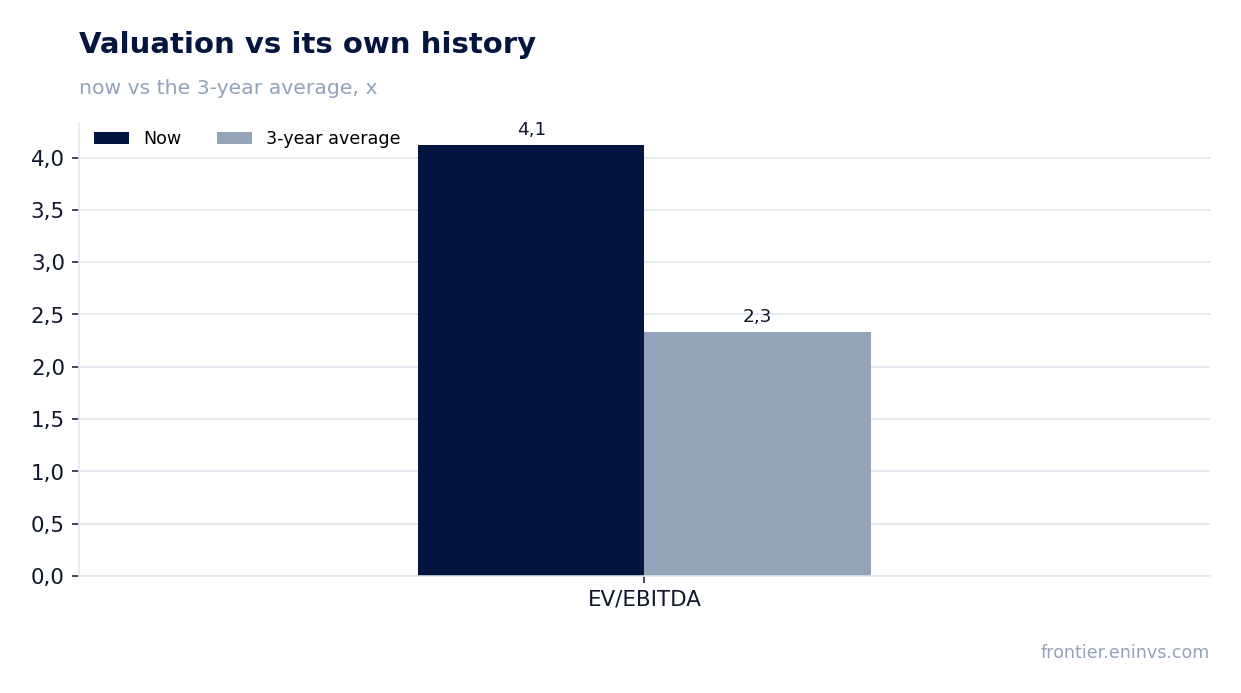
— EV/EBITDA LTM of 4.12x is nearly double its own three-year average of 2.33x, leaving no room for growth
— The portal model puts the share's fair value 32% below the current market price
Attractiveness
Key figures, USD bn
| Metric | Q2 2025 | Q2 2026 | Change |
|---|---|---|---|
| Revenue | 6.59 | 9.33 | +41.7% |
| EBITDA | 1.38 | 2.11 | +52.9% |
| Operating profit | 0.76 | 1.35 | +76.8% |
| Net profit | 0.29 | 0.63 | +115.0% |
| Operating cash flow | 1.23 | 1.52 | +23.5% |
| EBITDA margin | 20.9% | 22.6% | +1.7 pp |
| Net margin | 4.4% | 6.7% | +2.3 pp |
Q2 revenue rose 41.7% year on year to USD 9.3 bn, but the quarterly dynamics are distorted by a low base last year
OMV's Q2 2026 revenue was USD 9.3 bn, up 41.7% year on year. For comparison, Q1 growth was only 3.8%, indicating an acceleration. However, this jump is explained by the low base of Q2 2025, when revenue was USD 6.6 bn. The sequential growth from USD 6.8 bn in Q1 2026 is also significant – up 37% quarter on quarter.
The main contribution to growth likely came from hydrocarbon prices and higher sales volumes, but the exact drivers are not disclosed in the report. Importantly, the year-on-year acceleration is not organic but a consequence of the revenue slump in Q2 2025. In Q1 2026, revenue was USD 6.8 bn, which is higher than Q2 2025 (USD 6.6 bn), yet year-on-year growth was modest. Thus, the current surge may prove one-off.
EBITDA added 52.9% year on year, with the margin rising to 22.6% from 20.9% a year earlier
Q2 2026 EBITDA reached USD 2.1 bn, up 52.9% year on year. The EBITDA margin rose to 22.6% from 20.9% in Q2 2025. This margin improvement indicates that revenue growth outpaced cost growth, possibly due to operating leverage or favourable pricing.
Operating profit was USD 1.35 bn, also above last year's level. However, note that Q1 2026 EBITDA was USD 1.59 bn, so Q2 grew only 19.8% quarter on quarter. That is more modest than the annual growth, confirming the low-base effect. The 22.6% margin is a solid level, but without additional data it is hard to judge whether it is sustainable.
Q2 net profit was USD 628.8 mn, 2.8 times lower than in Q1, which included a one-off factor
OMV's Q2 2026 net profit was USD 628.8 mn, up 115.0% year on year (from USD 292.5 mn). However, compared with Q1 2026, when profit was USD 1.74 bn, it fell 2.8 times. This dynamics is explained by a one-off factor that inflated Q1 profit. Without it, quarterly profit would likely have been more stable.
The net margin in Q2 was 6.7% versus 4.4% a year earlier. The margin improvement is due to higher operating efficiency and possibly lower financial expenses. However, the absolute profit level remains low relative to revenue, indicating significant costs or tax burden. For investors, it is important that the one-off factor in Q1 will not repeat, and Q2 profit is a cleaner reflection of current profitability.
Net debt rose to USD 4.5 bn from USD 1.3 bn a year earlier, but the net debt/EBITDA LTM ratio remains low at 0.65
OMV's net debt as of 30 June 2026 was USD 4.5 bn, up from USD 1.3 bn on 30 June 2025. The annual increase was USD 3.1 bn. Compared with 31 March 2026, debt rose from USD 3.9 bn to USD 4.5 bn, i.e. by USD 0.6 bn in the quarter. Despite the significant increase, the net debt/EBITDA LTM ratio remains low at 0.65, indicating a comfortable debt burden.
Operating cash flow in Q2 was USD 1.52 bn, higher than in Q1 (USD 0.9 bn) but lower than in Q2 2025 (USD 1.23 bn). The rise in debt alongside positive cash flow may be linked to investments or dividend payments. Importantly, the 0.65 ratio is a level, not a direction, as the earlier value is not disclosed. The low burden gives the company flexibility, but further debt growth could be a concern.
The 6.16% dividend yield looks moderately attractive, but the payout may fall due to lower quarterly profit
OMV's dividend yield over the last 12 months is 6.16%. This is higher than the yield on many government bonds and may attract income-oriented investors. However, the sustainability of the dividend depends on profit and cash flow. Q2 net profit was USD 628.8 mn, significantly lower than Q1 (USD 1.74 bn). If this dynamics persists, the company may be forced to cut payments.
Our estimate for the current year's dividend is based on the payout ratio, which the company does not disclose. If we assume the payout remains at historical levels, then with lower annual profit the dividend may decrease. The key factor will be the absence of one-off items in profit. With the share price, according to the portal model, 32% above fair value, the dividend yield may prove insufficient to offset the risk of price decline.
EV/EBITDA LTM of 4.12x is nearly double its own three-year average of 2.33x, leaving no room for growth
OMV's EV/EBITDA LTM multiple is 4.12x. This is significantly above its own three-year average of 2.33x. Such a deviation indicates that the share is valued more expensively than usual relative to its EBITDA. For comparison, the P/E LTM is 17.03, which may also be above historical levels, but we do not have an average for P/E. The market may be pricing in profit growth expectations that could fail to materialise.
According to the portal model, the fair value of the share is 32% below the current market price. This means that at current commodity prices and the target EV/EBITDA, the downside potential exceeds the upside. Investors should note that the multiple is already at a historical high, and any deterioration in financial performance could lead to a correction.
The portal model puts the share's fair value 32% below the current market price
Our model, based on current commodity prices and the target EV/EBITDA, shows that OMV's fair value is 32% below the current market price. This is an estimate, not a consensus forecast. It reflects our view that the market is overvaluing the company, possibly due to expectations of sustained high energy prices.
If oil and gas prices remain at current levels and the multiple reverts to its historical average, the share could decline. However, if the company delivers sustained profit growth, the valuation could be justified. At present, the model signals overbought conditions.
Valuation on the latest reported figures
| Metric | Value |
|---|---|
| Market cap | 26.4 bn USD |
| P/E (LTM) | 17.0 |
| EV/EBITDA (LTM) | 4.1 |
| P/B | 1.38 |
| Net debt / EBITDA (LTM) | 0.65 |
| Operating cash flow (LTM) | 6.18 bn |
| ROE | 12.3% |
| Dividend yield (12m) | 6.2% |
| EV/EBITDA, 3-year average | 2.3 |
Bottom line
Bottom line: in Q2 OMV showed strong revenue and EBITDA growth, but this is largely a low-base effect from last year. Net profit fell 2.8 times quarter on quarter due to the absence of the one-off factor present in Q1. Debt rose to USD 4.5 bn, but the burden remains low. The key question for a holder is valuation: EV/EBITDA of 4.12x is nearly double its own three-year average, and the portal model indicates 32% downside. With a dividend yield of 6.16%, the share looks unattractive at current levels.
Open the company's financial profile OMV →
See also: market overview · valuation map · stock screeners