Peyto Exploration: revenue up 21.7% but EBITDA margin compressed to 80.4%
On August 25, Peyto Exploration reported Q2 2026 results. Revenue rose 21.7% year-on-year to $228.6 million, EBITDA added 11.2%, and net profit grew 20.3%. However, the EBITDA margin fell to 80.4% from 88.1% a year earlier. The stock looks attractive: EV/EBITDA of 6.3 is below its own three-year average of 7.4, and the dividend yield of 6.0% is well above the key rate.
Key takeaways
— Revenue rose 21.7% year-on-year to $228.6 million, but EBITDA added only 11.2% – the margin compressed to 80.4% from 88.1%
— Net profit grew 20.3% year-on-year to $76.4 million, although the net margin was almost unchanged – 33.4% versus 33.8%
— Debt load of 1.07x EBITDA over the last 12 months is moderate, and net debt declined from $0.9 billion to $0.7 billion over the year
— Dividend yield of 6.0% over the last 12 months is above the key rate, supporting the stock's appeal
— EV/EBITDA of 6.3 is below its own three-year average of 7.4 – the stock trades cheaper than its history
— On the portal's model, the upside to fair value is estimated at +103%
Attractiveness
Key figures, USD bn
| Metric | Q2 2025 | Q2 2026 | Change |
|---|---|---|---|
| Revenue | 0.19 | 0.23 | +21.7% |
| EBITDA | 0.17 | 0.18 | +11.2% |
| Operating profit | 0.05 | 0.08 | +46.2% |
| Net profit | 0.06 | 0.08 | +20.3% |
| Operating cash flow | 0.13 | 0.16 | +27.4% |
| EBITDA margin | 88.1% | 80.4% | -7.7 pp |
| Net margin | 33.8% | 33.4% | -0.4 pp |
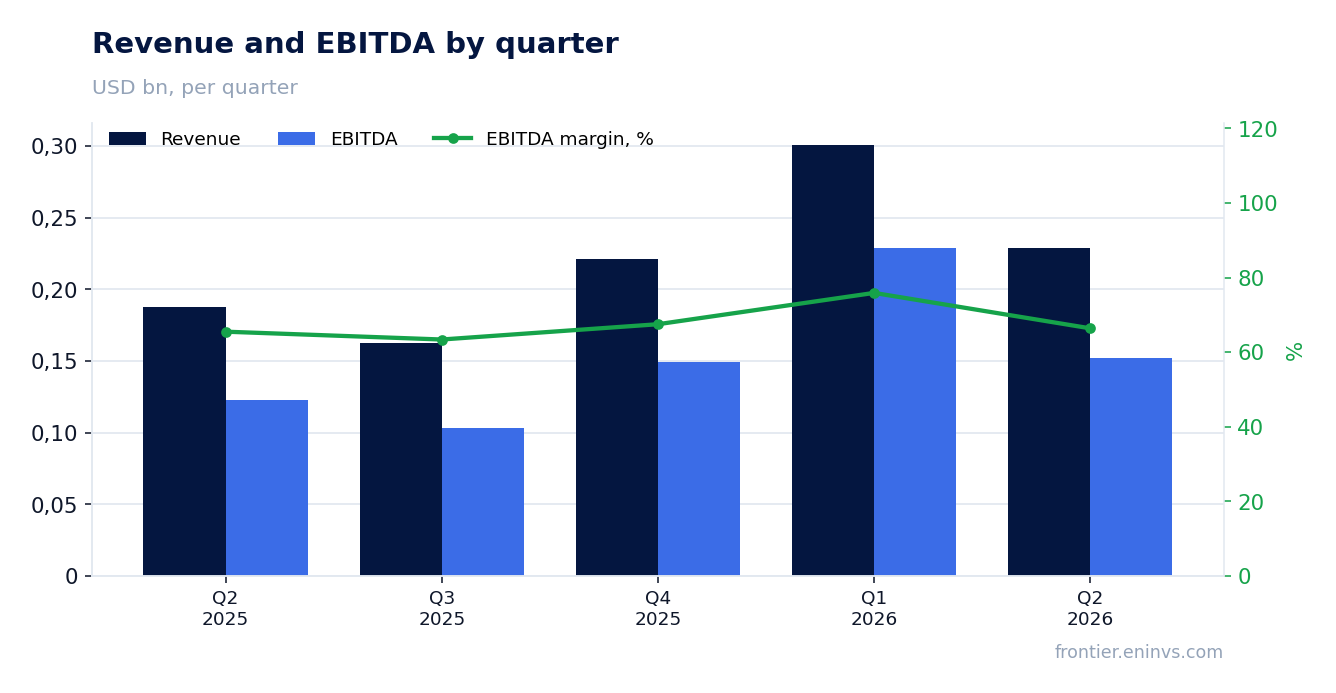
Revenue rose 21.7% year-on-year to $228.6 million, but EBITDA added only 11.2% – the margin compressed to 80.4% from 88.1%
Revenue for Q2 2026 was $228.6 million, up 21.7% year-on-year. Revenue growth accelerated compared to previous quarters, indicating favourable pricing or higher production volumes. However, details on operational drivers are not provided in the facts.
EBITDA grew only 11.2% year-on-year to $183.9 million. This is significantly slower than revenue growth, leading to a decline in the EBITDA margin to 80.4% from 88.1% a year earlier. The 7.7 percentage point compression suggests costs rose faster than revenue. Possible reasons include higher operating expenses or royalties, but the exact cause is not specified in the facts.
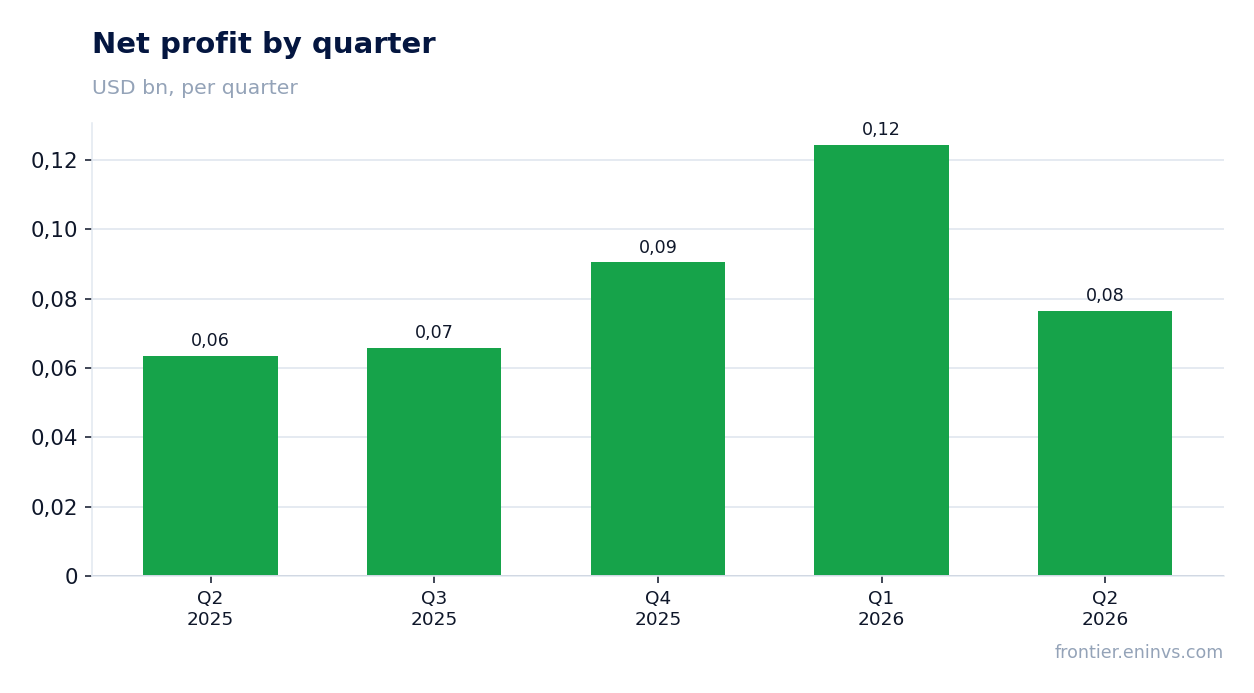
Net profit rose 20.3% year-on-year to $76.4 million, while the net margin was almost unchanged at 33.4% versus 33.8% a year earlier. This means that despite pressure on the operating margin, the company maintained its bottom-line profitability, likely through lower interest expenses or tax burden.
Net profit grew 20.3% year-on-year to $76.4 million, although the net margin was almost unchanged – 33.4% versus 33.8%
Net profit in Q2 2026 was $76.4 million, up 20.3% from a year earlier. Profit growth outpaced EBITDA growth, which may be explained by lower depreciation, interest expenses, or taxes. However, details on these items are not provided in the facts.
The net margin remained virtually unchanged at 33.4% versus 33.8%. This indicates that the company offset pressure on the operating margin through other items. Possibly, the reduction in net debt from $0.9 billion to $0.7 billion over the year led to lower interest expenses, supporting net profit.
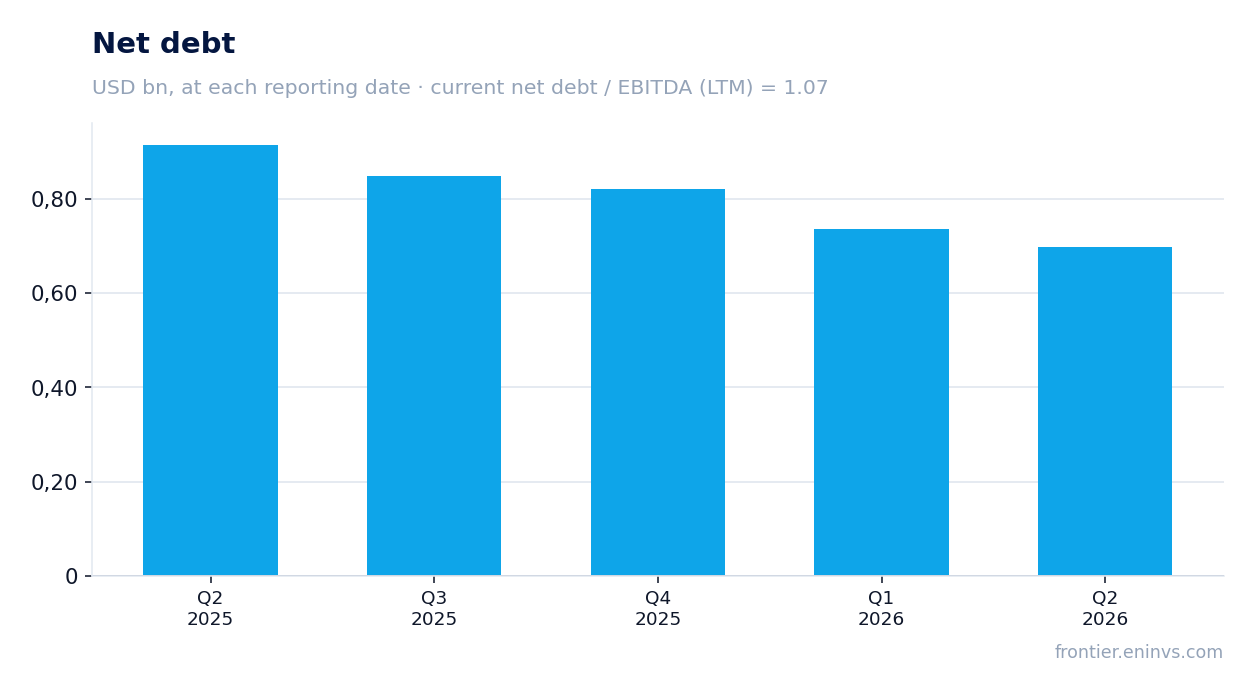
Debt load of 1.07x EBITDA over the last 12 months is moderate, and net debt declined from $0.9 billion to $0.7 billion over the year
Net debt as of June 30, 2026, was $698.8 million, corresponding to a net debt/EBITDA ratio of 1.07 for the trailing twelve months. This is a moderate level of debt load that does not raise concerns. Over the year, net debt declined from $0.9 billion on June 30, 2025, to $0.7 billion on June 30, 2026, a decrease of $0.2 billion.
The debt reduction occurred alongside growth in operating cash flow, which over the last twelve months amounted to $694.3 million. This allowed the company to allocate funds to debt repayment and dividend payments. The moderate leverage provides financial flexibility and reduces risks amid energy price volatility.
Dividend yield of 6.0% over the last 12 months is above the key rate, supporting the stock's appeal
The dividend yield over the last twelve months is 6.0%. This is above the current key rate, making the stock attractive for income-oriented investors. The company pays dividends, and if current profit and dividend policy are maintained, the yield may remain at this level.
Our estimate for the current year's dividend is based on a conservative scenario: assuming net profit remains at the trailing twelve-month level of $357.1 million and a payout ratio of about 60%, the dividend could be approximately $2.1 per share, yielding about 6% at the current price. However, this estimate depends on energy price volatility and production results.
Dividend payments are supported by operating cash flow, which over the last twelve months amounted to $694.3 million. This is sufficient to cover capital expenditures and dividends. A reduction in payouts is possible if oil or gas prices fall, or if capital expenditures increase.
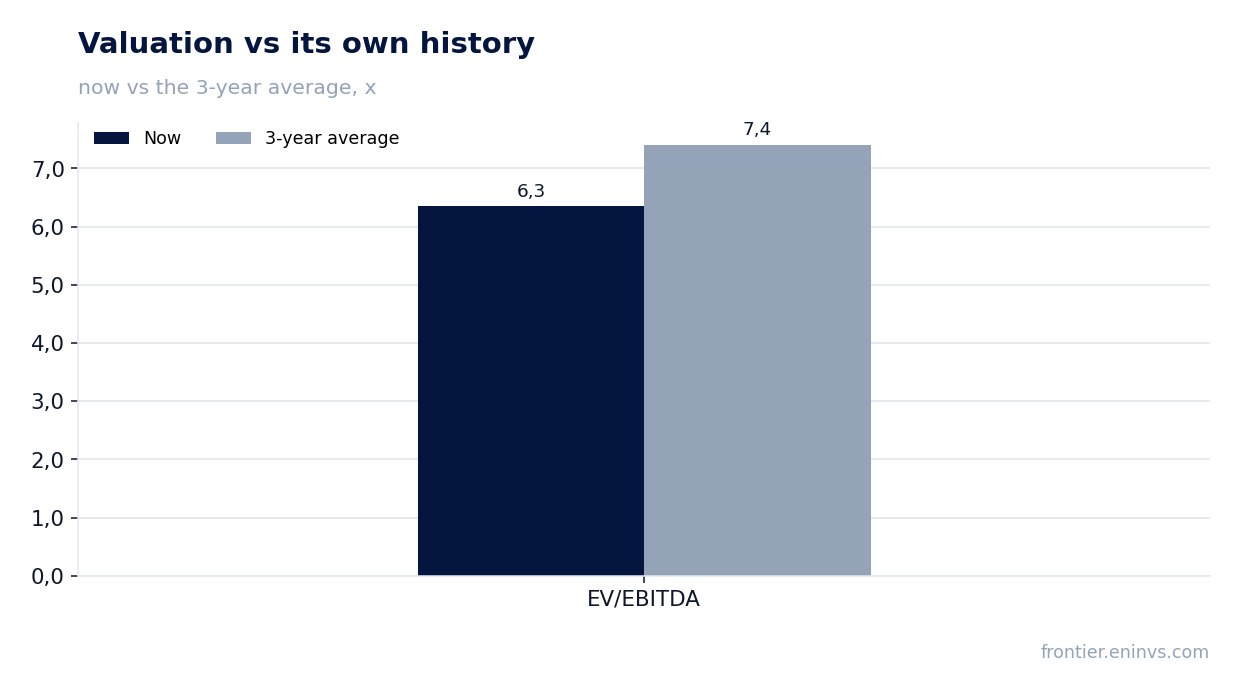
EV/EBITDA of 6.3 is below its own three-year average of 7.4 – the stock trades cheaper than its history
The current EV/EBITDA is 6.3, below its own three-year average of 7.4. This indicates that the stock is valued cheaper than its average over the past three years. The trailing P/E is 9.3, which may also suggest undervaluation.
Market capitalisation is $3,315.1 million. At the current valuation and with stable cash flow generation, the stock may be of interest to investors seeking undervalued assets. The lower multiple relative to history may be due to market expectations of lower energy prices or broader sector trends.
On the portal's model, the upside to fair value is estimated at +103%
According to our model, which re-prices EBITDA at current commodity prices and a target EV/EBITDA, the upside to fair value is estimated at +103%. This is significant upside, suggesting the market undervalues the company. However, the model is based on current prices and may be sensitive to changes.
The portal's model is not a market consensus or a target price. It reflects our own view of fair value under current conditions. If energy prices remain at current levels or rise, the stock could realise this upside.
Valuation on the latest reported figures
| Metric | Value |
|---|---|
| Market cap | 3.32 bn USD |
| P/E (LTM) | 9.3 |
| EV/EBITDA (LTM) | 6.3 |
| P/B | 1.59 |
| Net debt / EBITDA (LTM) | 1.07 |
| Operating cash flow (LTM) | 0.69 bn |
| ROE | 14.3% |
| Dividend yield (12m) | 6.0% |
| EV/EBITDA, 3-year average | 7.4 |
Bottom line
Peyto Exploration reported revenue growth of 21.7% and net profit growth of 20.3% in Q2 2026, but the EBITDA margin compressed to 80.4% from 88.1%. Debt load is moderate at 1.07x EBITDA, and net debt declined from $0.9 billion to $0.7 billion over the year. The dividend yield of 6.0% is above the key rate, and EV/EBITDA of 6.3 is below the three-year average of 7.4. On the portal's model, upside is +103%. The stock looks attractive for investors willing to accept energy sector risks.
Open the company's financial profile PEY →
See also: market overview · valuation map · stock screeners