Saturn Oil & Gas: revenue up by half, but EBITDA margin compressed from 88.9% to 67.4%
On August 25, Saturn Oil & Gas released its Q2 2026 results. Revenue rose 50.2% year-on-year to $261.3 million, EBITDA added 13.9% to $176.0 million, and net profit increased 13.1% to $77.8 million. However, margins declined noticeably: the EBITDA margin was 67.4% versus 88.9% a year earlier, and the net margin was 29.8% versus 39.5%. At the current share price, the stock looks attractive: EV/EBITDA LTM of 4.92 versus the three-year average of 2.28, but the portal's model points to 48% upside, and leverage is moderate at 1.81x EBITDA LTM.
Key takeaways
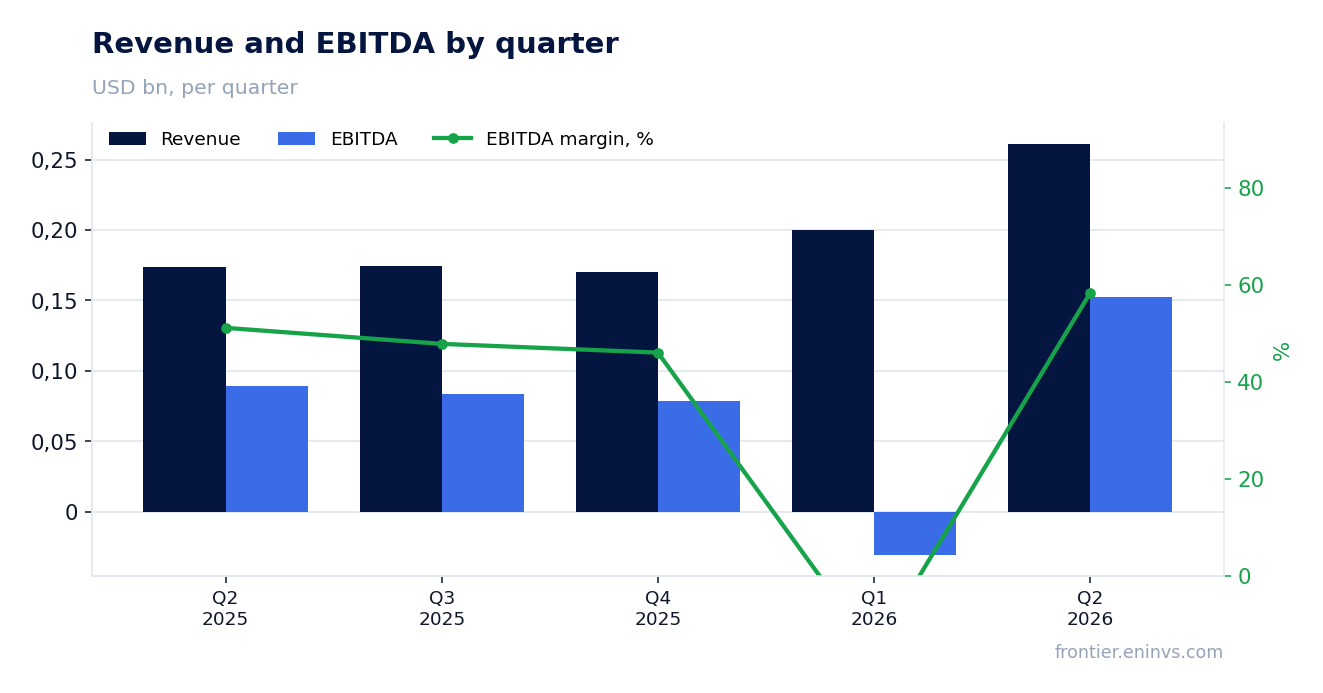
— Revenue rose 50.2% year-on-year to $261.3 million, but EBITDA added only 13.9% – the margin compressed
— EBITDA margin fell to 67.4% from 88.9% a year earlier, the main shift in the report
— Net profit grew 13.1% to $77.8 million, but net margin declined to 29.8% from 39.5%
— Leverage is moderate: net debt of $524.6 million, or 1.81x EBITDA LTM
— Operating cash flow for the quarter was $91.3 million, covering interest and maintenance capex
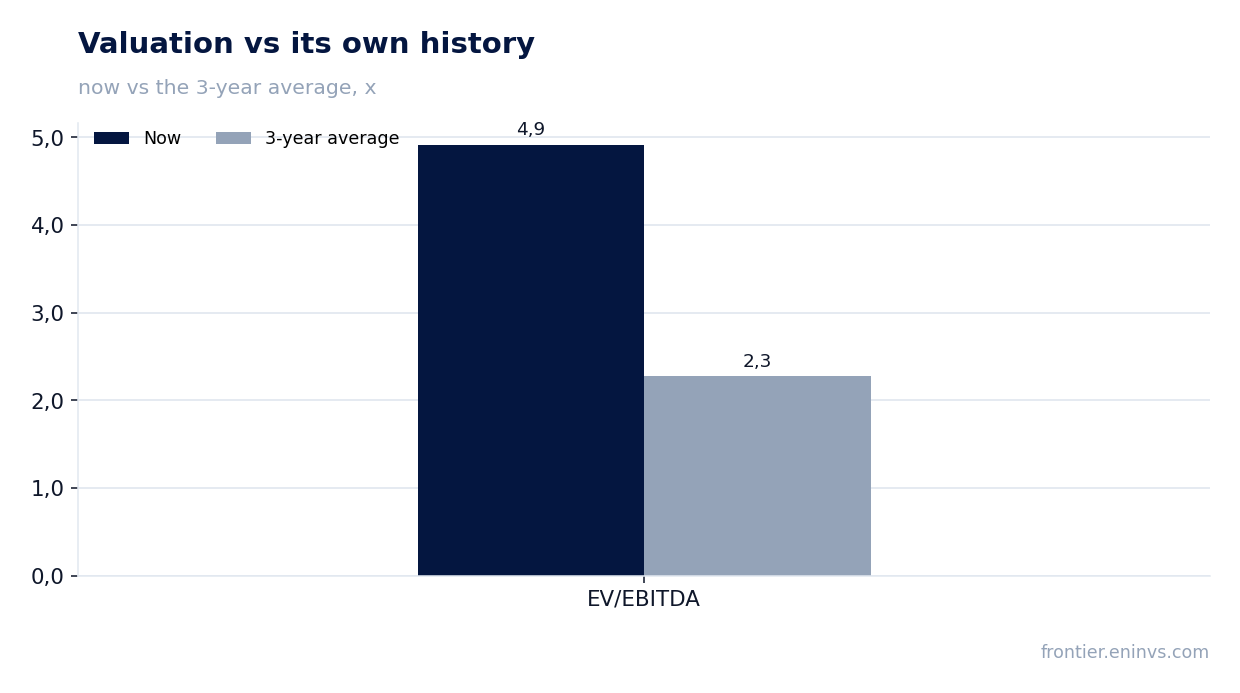
— EV/EBITDA LTM of 4.92 versus the three-year average of 2.28 – the stock trades above its own history
— The portal's model implies 48% upside to the current price
Attractiveness
Key figures, USD bn
| Metric | Q2 2025 | Q2 2026 | Change |
|---|---|---|---|
| Revenue | 0.17 | 0.26 | +50.2% |
| EBITDA | 0.15 | 0.18 | +13.9% |
| Operating profit | 0.04 | 0.10 | +171.4% |
| Net profit | 0.07 | 0.08 | +13.1% |
| Operating cash flow | 0.06 | 0.09 | +40.5% |
| EBITDA margin | 88.9% | 67.4% | -21.5 pp |
| Net margin | 39.5% | 29.8% | -9.7 pp |
Revenue rose 50.2% year-on-year to $261.3 million, but EBITDA added only 13.9% – the margin compressed
Revenue in Q2 2026 was $261.3 million, up 50.2% from Q2 2025. This growth could stem from higher production volumes or favourable prices, but details are not disclosed in the report. For comparison, Q1 2026 revenue was $199.9 million, indicating sequential improvement.
EBITDA grew only 13.9% to $176.0 million, significantly slower than revenue. This means costs grew faster. The EBITDA margin fell to 67.4% from 88.9% a year earlier. The reason for this divergence could be higher operating expenses, royalties, or acquisition costs, but the provided facts lack detail.
Nevertheless, the absolute EBITDA level remains high, and the company remains profitable. Operating profit in Q2 was $98.8 million, confirming the ability to generate positive results even with a lower margin. The question is whether the margin decline is temporary or a sustained trend.
EBITDA margin fell to 67.4% from 88.9% a year earlier, the main shift in the report
The decline in EBITDA margin from 88.9% to 67.4% is the most notable change in the report. With revenue up 50.2%, EBITDA grew only 13.9%, indicating a significant increase in unit costs. In Q1 2026, EBITDA was negative (-$31.0 million), so the current quarter shows a recovery, but the margin is still far from last year's level.
Net margin also declined to 29.8% from 39.5%. Net profit rose 13.1% to $77.8 million, but the growth rate is much lower than revenue. This reflects both pressure on operating efficiency and possibly higher depreciation or interest expenses.
For investors, the key question is whether the company can restore its margin. If the decline is due to one-off factors, the current valuation may be attractive. If it represents a new cost level, profitability will remain under pressure.
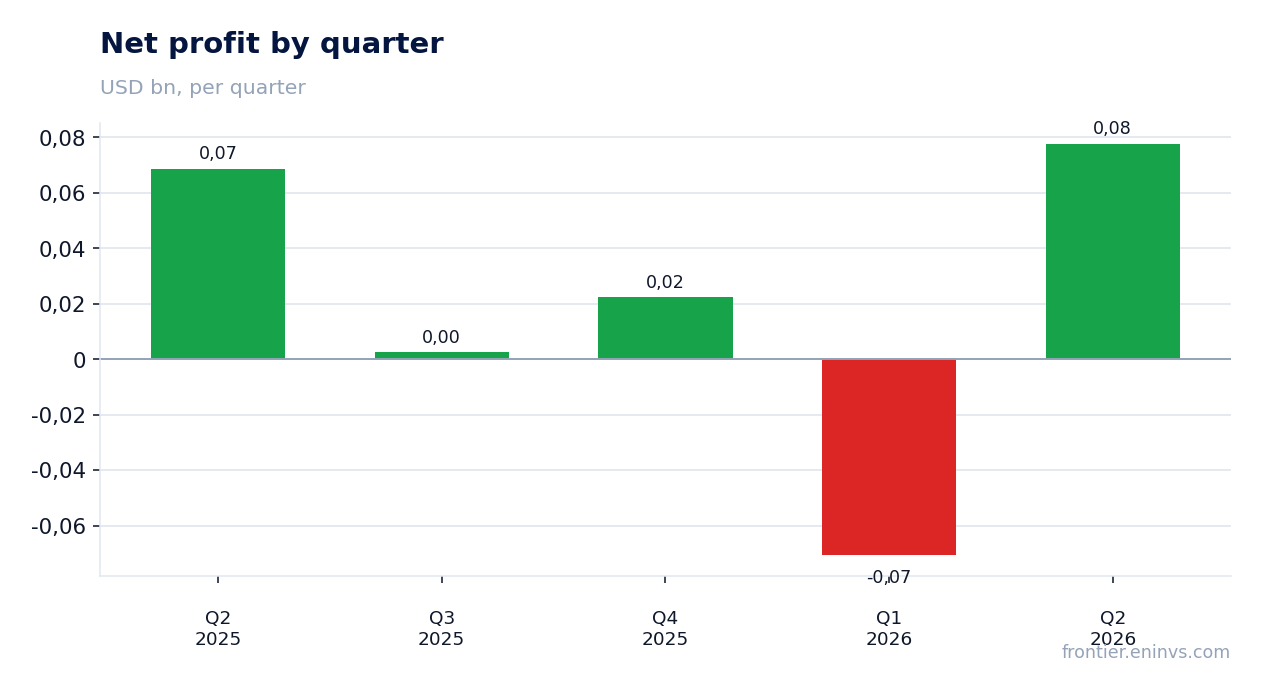
Net profit grew 13.1% to $77.8 million, but net margin declined to 29.8% from 39.5%
Net profit in Q2 2026 was $77.8 million, up 13.1% year-on-year. However, net margin fell to 29.8% from 39.5%, reflecting faster cost growth and possibly higher depreciation or taxes. In Q1 2026, the company posted a loss of $70.7 million, so the return to profit is a positive signal.
Return on equity (ROE) over the last twelve months is 49.9%, which is very high. This may be due to high profit relative to equity, which could have been reduced by losses in previous periods. A high ROE is attractive but requires caution: it may result from one-off profit or a low equity base.
Net profit LTM is only $32.0 million, significantly lower than the quarterly profit. This means that in the previous three quarters, the company incurred a cumulative loss that offset the current success. Thus, the sustainability of profit is not yet confirmed.
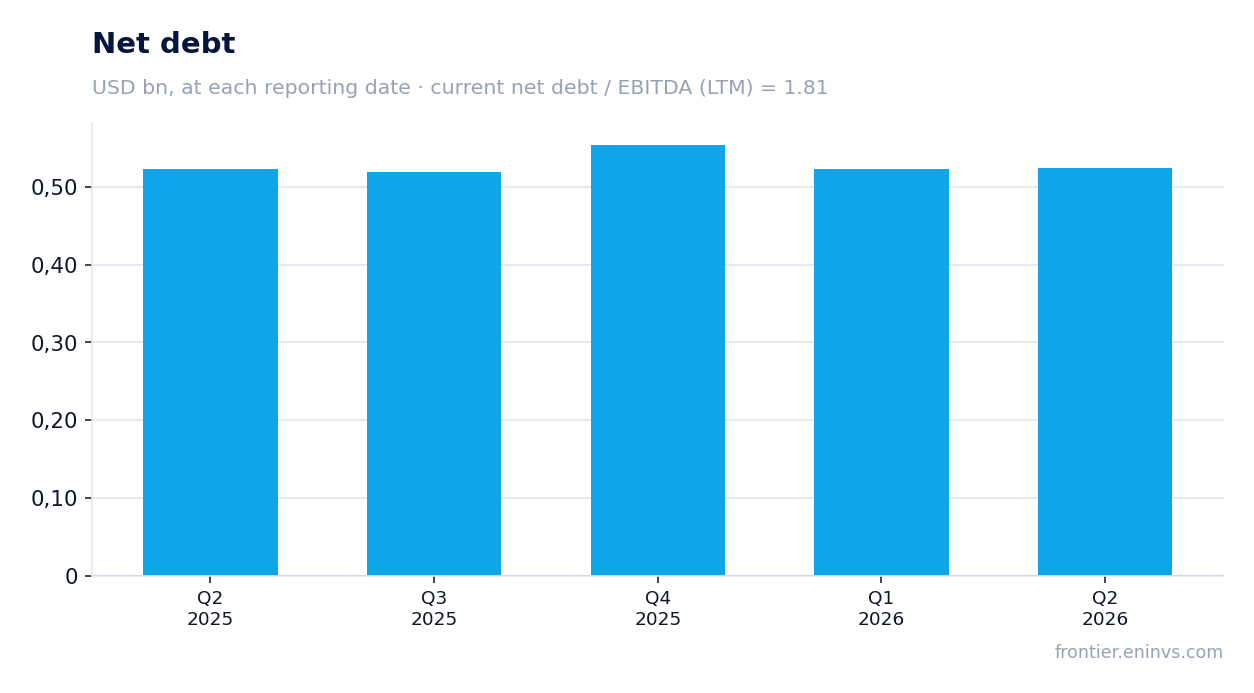
Leverage is moderate: net debt of $524.6 million, or 1.81x EBITDA LTM
Net debt as of June 30, 2026, was $524.6 million, virtually unchanged from March 31, 2026 ($523.1 million) and from June 30, 2025 ($522.3 million). Over the last 12 months, net debt remained at $0.5 billion, indicating stable debt policy.
The net debt to EBITDA LTM ratio is 1.81. This is a moderate level that does not create excessive burden. For comparison, EV/EBITDA LTM is 4.92, and the three-year average is 2.28. However, these metrics cannot be directly compared as they have different bases.
Operating cash flow for the quarter was $91.3 million, sufficient to service debt and maintain production. Capital expenditures are not disclosed in the facts, but their absence from the list may mean they were not material or not highlighted. In any case, current cash flow covers interest expenses.
Operating cash flow for the quarter was $91.3 million, covering interest and maintenance capex
Operating cash flow in Q2 2026 was $91.3 million, up 40.5% from Q2 2025 ($65.0 million). The increase in cash flow despite margin decline may be due to changes in working capital or non-cash items. In Q1 2026, the flow was $82.3 million, so the trend is positive.
Over the last twelve months, operating cash flow was $319.8 million. This is a solid amount that allows financing capital expenditures and servicing debt. However, capital expenditures are not specified in the facts, so free cash flow cannot be assessed.
Importantly, cash flow remains positive and growing despite the fall in EBITDA margin. This may indicate good working capital management or that some costs are non-cash. For investors, this is a positive signal, but without capex data, the full picture is unclear.
EV/EBITDA LTM of 4.92 versus the three-year average of 2.28 – the stock trades above its own history
The current EV/EBITDA LTM is 4.92, more than double the three-year average of 2.28. This means the market values the company higher than its average over the past three years. The reason could be expectations of profit recovery or a general rise in energy prices.
P/E LTM is 27.1, which may also indicate an overvaluation relative to historical levels, although the three-year average for P/E is not provided. The price-to-earnings ratio is higher than many companies in the sector, but without peer comparison, this is just a statement.
The portal's model, based on re-pricing EBITDA at current commodity prices and the target EV/EBITDA, implies 48% upside to the current price. This is the portal's own estimate, not a market consensus. If the model is correct, the current price offers an opportunity for growth despite the high multiple.
The portal's model implies 48% upside to the current price
According to the portal's model, the fair value of the share is 48% above the current market price. The model recalculates EBITDA at current commodity prices and applies a target EV/EBITDA. This is not a market forecast but an internal estimate that may differ from other analysts' views.
The 48% upside looks attractive, especially given moderate leverage (1.81x EBITDA LTM) and positive cash flow. However, the model is sensitive to commodity prices and may quickly become outdated.
For investors, this means that at the current price, the stock may be undervalued if the model's assumptions hold. But the high EV/EBITDA multiple relative to history suggests the market is already pricing in some optimism.
Valuation on the latest reported figures
| Metric | Value |
|---|---|
| Market cap | 0.87 bn USD |
| P/E (LTM) | 27.1 |
| EV/EBITDA (LTM) | 4.9 |
| P/B | 1.25 |
| Net debt / EBITDA (LTM) | 1.81 |
| Operating cash flow (LTM) | 0.32 bn |
| ROE | 49.9% |
| EV/EBITDA, 3-year average | 2.3 |
Bottom line
In Q2 2026, Saturn Oil & Gas showed strong revenue growth of 50.2% to $261.3 million and returned to profit after a loss in Q1. However, the EBITDA margin compressed to 67.4% from 88.9%, indicating faster cost growth. Leverage is moderate at 1.81x EBITDA LTM, and operating cash flow of $91.3 million covers debt servicing. The stock trades above its own history on EV/EBITDA (4.92 vs 2.28), but the portal's model implies 48% upside. The key question for a holder is whether the company can restore its margin; if so, the current price is attractive.
Open the company's financial profile SOIL →
See also: market overview · valuation map · stock screeners