Silvercorp Metals: profit tripled, but the entire quarterly cash flow went into construction
Silvercorp Metals reported results for the first quarter of fiscal 2026. Revenue rose 70.5% year on year to $138.7 million, EBITDA jumped 111.3% to $85.1 million, and net profit surged 227.6% to $59.4 million. The EBITDA margin climbed to 61.3% from 49.5% a year earlier, but capital expenditure of $93.1 million nearly doubled operating cash flow of $61.7 million. With an EV/EBITDA of 8.1 against its own three-year average of 6.9 and the portal model pointing to 43% downside to fair value, the share looks unattractive at the current price.
Key takeaways
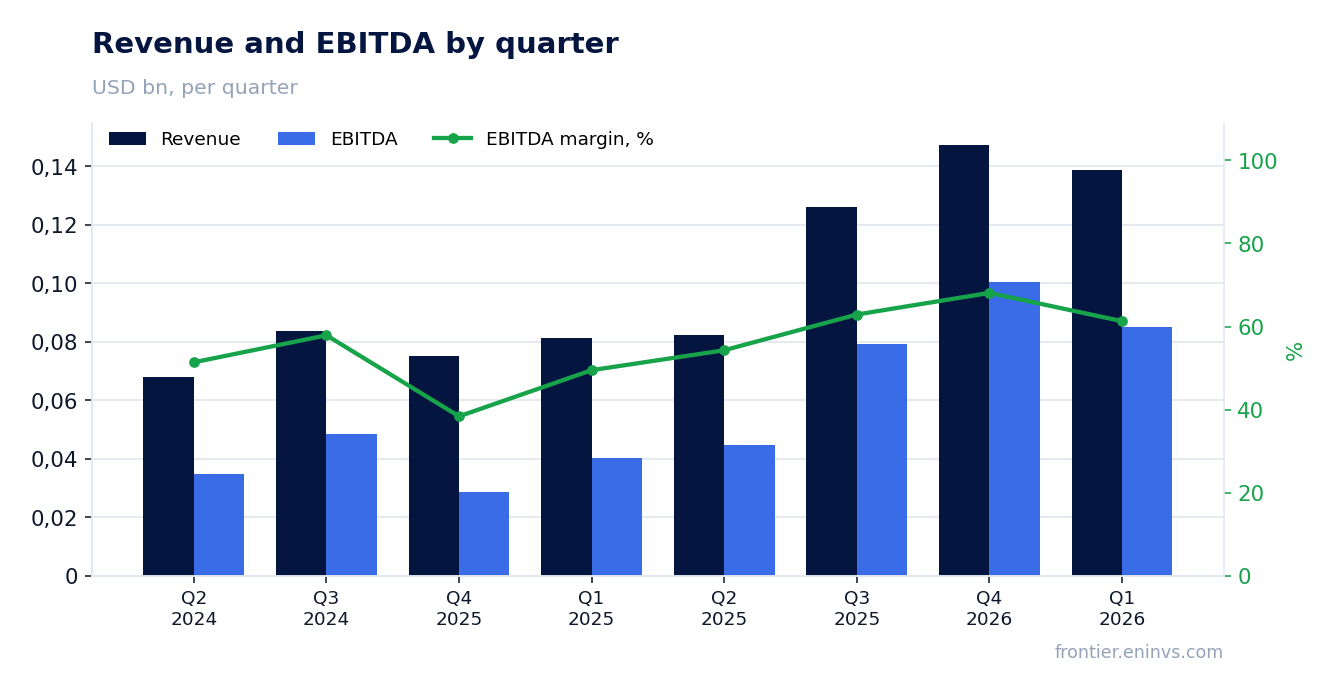
— Revenue rose 70.5% year on year to $138.7 million, the strongest quarterly result in the available history
— EBITDA grew 111.3% year on year, with the margin rising to 61.3% from 49.5% — growth outpacing revenue
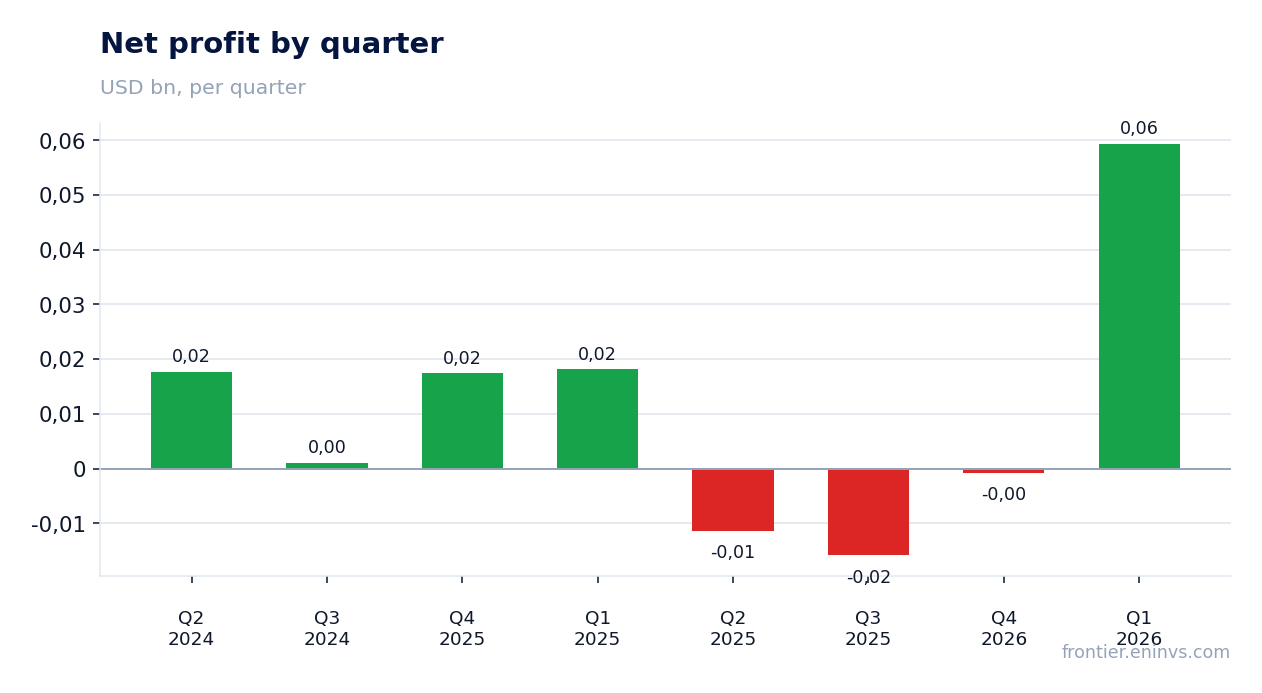
— Net profit of $59.4 million looks like a record, but a year earlier it was $18.1 million and in the previous quarter it was a $0.7 million loss
— Operating cash flow of $61.7 million was almost entirely absorbed by capital expenditure of $93.1 million — free cash flow was negative
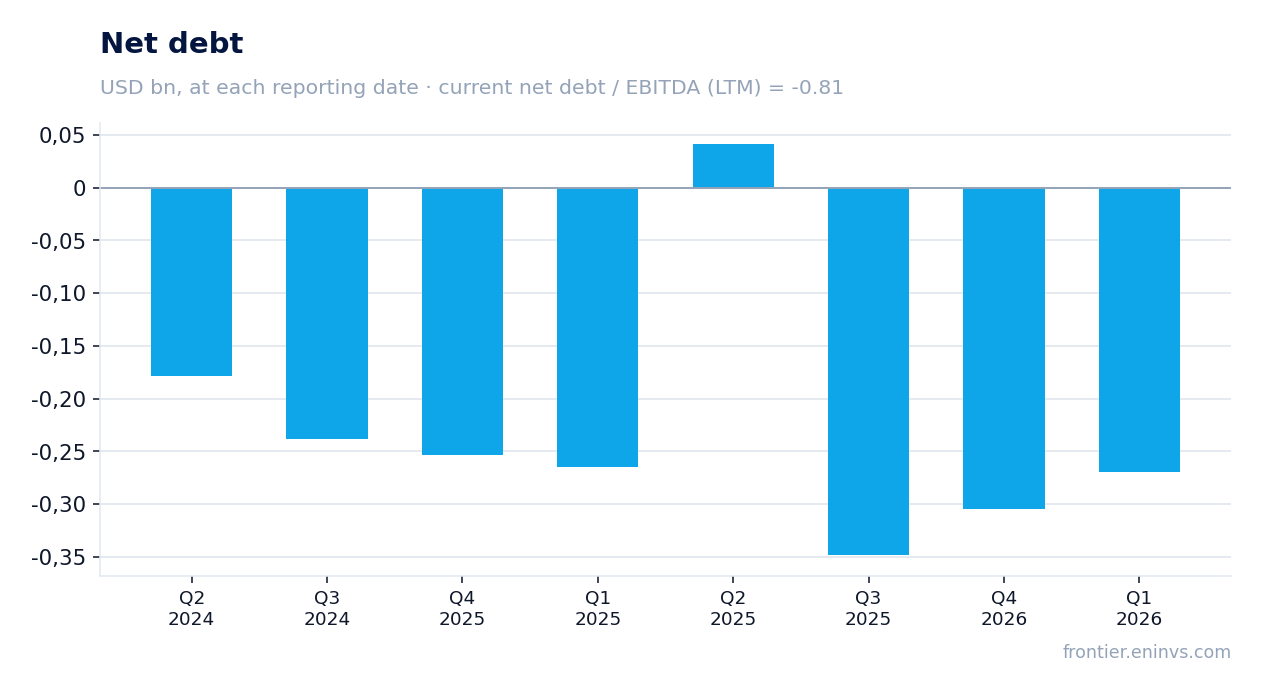
— Leverage is negative: net cash of $269.4 million, with net debt to LTM EBITDA at minus 0.81
— EV/EBITDA of 8.1 versus its own three-year average of 6.9 — the market values the company above its usual level
— A dividend yield of 0.10% offers no support, and the portal model points to 43% downside to fair value
Attractiveness
Key figures, USD bn
| Metric | Q1 2025 | Q1 2026 | Change |
|---|---|---|---|
| Revenue | 0.08 | 0.14 | +70.5% |
| EBITDA | 0.04 | 0.09 | +111.3% |
| Operating profit | 0.03 | 0.08 | +144.9% |
| Net profit | 0.02 | 0.06 | +227.6% |
| Operating cash flow | 0.05 | 0.06 | +27.8% |
| Capex | 0.03 | 0.09 | +261.3% |
| EBITDA margin | 49.5% | 61.3% | +11.8 pp |
| Net margin | 22.3% | 42.8% | +20.5 pp |
Revenue rose 70.5% year on year to $138.7 million, the strongest quarterly result in the available history
In the first quarter of fiscal 2026, Silvercorp Metals revenue reached $138.7 million, up 70.5% from a year earlier. This is the highest quarterly figure among all available periods: the previous peak was $147.4 million in the fourth quarter of fiscal 2026, but that quarter's year-on-year growth was 96.2%.
Revenue growth has accelerated for three consecutive quarters: 76.0% in Q4 FY2025, 70.5% in Q1 FY2026, and around 60% on average over the prior four quarters. This dynamic points to strong pricing for silver and gold as well as higher production volumes.
For comparison, in the first quarter of fiscal 2025 revenue was $81.3 million, with year-on-year growth of just 12.7%. The current level is nearly double the result from two years ago, confirming significant operating leverage.
EBITDA grew 111.3% year on year, with the margin rising to 61.3% from 49.5% — growth outpacing revenue
EBITDA in the first quarter of fiscal 2026 was $85.1 million, up 111.3% year on year. EBITDA growth is more than one and a half times revenue growth, pushing the margin up to 61.3% from 49.5% a year earlier.
This margin jump is explained by metal prices rising faster than costs. With revenue of $138.7 million and EBITDA of $85.1 million, operating costs were about $53.6 million, versus $40.1 million a year earlier when revenue was $81.3 million. Costs rose only 34% while revenue rose 70.5%.
This is a classic operating leverage effect: fixed mining and processing costs are spread over a larger revenue base. However, the sustainability of such a margin depends on high silver and gold prices persisting.
Net profit of $59.4 million looks like a record, but a year earlier it was $18.1 million and in the previous quarter it was a $0.7 million loss
Net profit in the first quarter of fiscal 2026 was $59.4 million, up 227.6% from $18.1 million a year earlier. This is the highest quarterly result in the available history, well above the previous peak of $17.7 million in the second quarter of fiscal 2024.
The sharp profit increase is explained not only by operating leverage but also by a low base effect: the fourth quarter of fiscal 2026 saw a $0.7 million loss, and the third quarter of fiscal 2025 a $15.8 million loss. Those losses were tied to one-off write-offs and non-cash adjustments that are not repeating in the current quarter.
The net margin rose to 42.8% from 22.3% a year earlier. Such a margin level is exceptionally high for a mining company and reflects both favourable pricing and the absence of large one-off write-offs in the reporting period.
Operating cash flow of $61.7 million was almost entirely absorbed by capital expenditure of $93.1 million — free cash flow was negative
Operating cash flow in the first quarter of fiscal 2026 was $61.7 million, up 27.8% from $48.3 million a year earlier. However, capital expenditure rose to $93.1 million from $25.8 million, resulting in negative free cash flow of minus $31.4 million.
Such a sharp increase in capex is linked to expanding mining capacity and likely project development. In the previous quarter, capex was even higher at $119.3 million, also producing negative free cash flow despite operating cash flow of $90.2 million.
Negative free cash flow is a key risk for dividend payments and debt sustainability, although the company still has a substantial cash cushion. If capex remains at this level, the company may need to raise additional financing or cut payouts.
Leverage is negative: net cash of $269.4 million, with net debt to LTM EBITDA at minus 0.81
Net debt at the latest reporting date is minus $269.4 million, meaning the company has a net cash position. The net debt to LTM EBITDA ratio is minus 0.81, confirming the absence of debt burden.
For comparison, in the previous quarter net cash was $304.8 million, and a year earlier $264.5 million. The slight decrease in the cash cushion is due to negative free cash flow, but it does not change the overall qualitative conclusion: the company is financially sound.
The absence of debt gives Silvercorp Metals a buffer to fund capital expenditure without borrowing. However, negative free cash flow means the cash position could continue to shrink if metal prices decline.
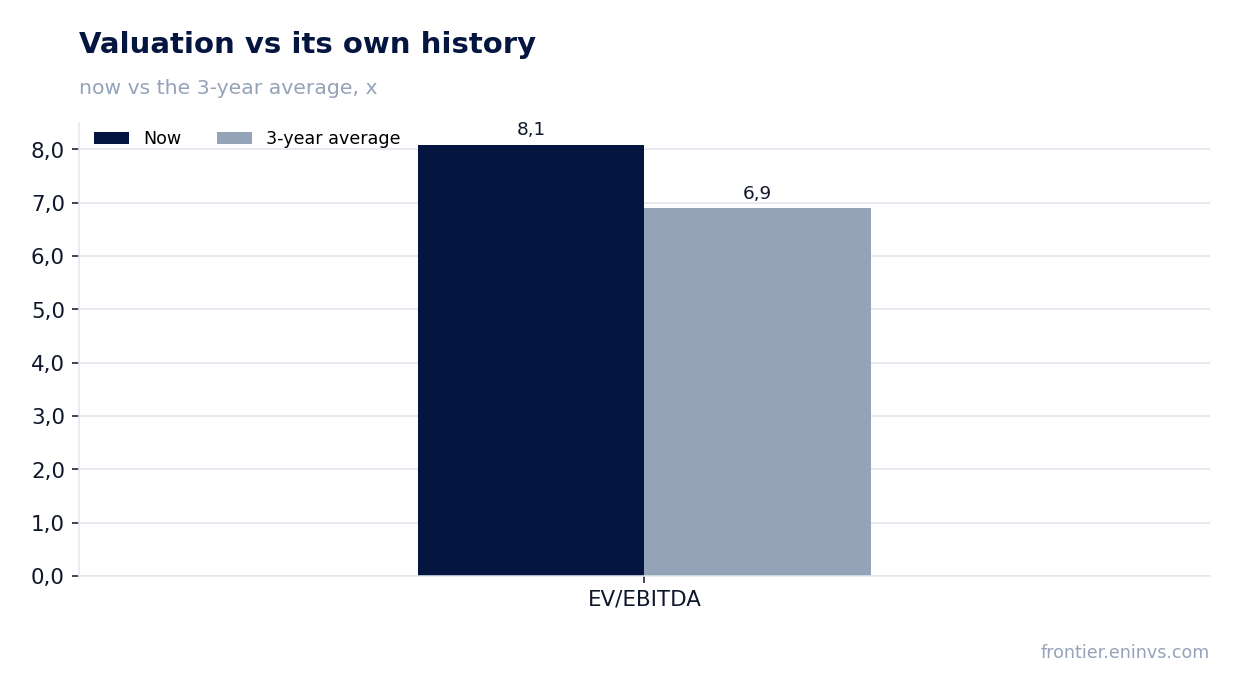
EV/EBITDA of 8.1 versus its own three-year average of 6.9 — the market values the company above its usual level
The current EV/EBITDA multiple is 8.1, above its own three-year average of 6.9. This means the market values the business more expensively than on average over the past three years, despite record financial performance.
The multiple expansion is explained by the share price already pricing in a significant portion of the favourable environment. With a market capitalisation of $2,772.4 million and LTM EBITDA of $311.5 million, EV/EBITDA is 8.1. For comparison, the LTM P/E is 88.2, reflecting low net profit over the past twelve months due to losses in earlier quarters.
The portal model, repricing EBITDA at current commodity prices at the target EV/EBITDA, puts the fair value of the share 43% below the current market price. This is the portal's own calculation, not a consensus forecast, but it points to limited upside.
A dividend yield of 0.10% offers no support, and the portal model points to 43% downside to fair value
The dividend yield over the past twelve months is just 0.10%, well below the yield on risk-free instruments. The company is not a dividend story: payouts are symbolic and provide no support to shareholders.
With LTM net profit of $31.4 million and a market capitalisation of $2,772.4 million, the dividend yield could be higher if the company allocated a larger share of profit to payouts. However, priority is given to capital expenditure, which in the last two quarters exceeded operating cash flow.
The combination of factors — negative free cash flow, low dividend yield, a multiple above its own history, and the portal's valuation pointing to 43% downside — makes the share unattractive for purchase at current levels.
Valuation on the latest reported figures
| Metric | Value |
|---|---|
| Market cap | 2.77 bn USD |
| P/E (LTM) | 88.2 |
| EV/EBITDA (LTM) | 8.1 |
| P/B | 3.95 |
| Net debt / EBITDA (LTM) | -0.81 |
| Operating cash flow (LTM) | 0.32 bn |
| ROE | 24.6% |
| Dividend yield (12m) | 0.1% |
| EV/EBITDA, 3-year average | 6.9 |
Bottom line
The quarter was exceptionally strong operationally: revenue rose 70.5% to $138.7 million, EBITDA jumped 111.3% to $85.1 million, and net profit surged 227.6% to $59.4 million. However, the entire operating cash flow of $61.7 million was absorbed by capital expenditure of $93.1 million, leaving free cash flow negative. There is no debt burden, but a dividend yield of 0.10% does not compensate for the risks. With EV/EBITDA of 8.1 against its own three-year average of 6.9 and the portal model pointing to 43% downside, the share looks unattractive at the current price.
Open the company's financial profile SVM →
See also: market overview · valuation map · stock screeners