TotalEnergies: profit doubled, but one-off items, not production, carried the second quarter
On 25 July TotalEnergies released its second-quarter 2026 results. Revenue rose 27.8% year on year to USD 57.1 bn, EBITDA added 38.9% to USD 12.5 bn, and net profit more than doubled to USD 5.4 bn. However, the sequential profit growth rests on one-off items rather than a durable margin improvement: without them the result would have been noticeably more modest. At an EV/EBITDA of 5.5 and a dividend yield above 6%, the share looks attractive, but the realisation of that valuation depends on whether quarterly profit can repeat without one-off effects.
Key takeaways
— Revenue rose 27.8% year on year to USD 57.1 bn, but growth was driven mainly by one-off factors rather than organic business expansion
— EBITDA added 38.9% to USD 12.5 bn, but its margin of 22.0% versus 20.2% a year earlier is a modest improvement that may not hold
— Net profit rose 102.4% to USD 5.4 bn, but without one-off items it would have been substantially lower
— Debt fell from USD 38.3 bn on 31 March to USD 35.0 bn on 30 June, and from USD 41.8 bn a year earlier, easing the balance-sheet burden
— Operating cash flow for the quarter was USD 10.9 bn, but most of it went to sustaining production and dividends
— A dividend yield above 6% with a payout ratio around 60% makes the share attractive for income, but the payout depends on oil prices
— The EV/EBITDA multiple of 5.5 and P/E of 10.8 are below historical averages, offering upside if profit stabilises
Attractiveness
Key figures, USD bn
| Metric | Q2 2025 | Q2 2026 | Change |
|---|---|---|---|
| Revenue | 44.7 | 57.1 | +27.8% |
| EBITDA | 9.03 | 12.5 | +38.9% |
| Operating profit | 4.33 | 7.58 | +75.1% |
| Net profit | 2.69 | 5.44 | +102.4% |
| Operating cash flow | 5.96 | 10.9 | +82.2% |
| EBITDA margin | 20.2% | 22.0% | +1.8 pp |
| Net margin | 6.0% | 9.5% | +3.5 pp |
Revenue rose 27.8% year on year to USD 57.1 bn, but growth was driven mainly by one-off factors rather than organic business expansion
TotalEnergies' revenue for the second quarter of 2026 was USD 57.1 bn, up 27.8% from the second quarter of 2025. Such growth looks impressive against a stagnant sector, but it is largely explained by one-off transactions and base effects rather than a sustained increase in production or sales volumes.
Sequential dynamics show that quarter-on-quarter revenue rose from USD 49.5 bn in the first quarter of 2026 to USD 57.1 bn in the second. This acceleration may be linked to seasonal factors and a recovery in energy prices, but without additional data from the report it cannot be claimed as sustainable.
For the investor, it matters that revenue growth is not accompanied by a proportional improvement in profitability: the EBITDA margin rose only from 20.2% to 22.0%. This means that a significant portion of the revenue increase was absorbed by higher costs or one-off write-offs, and the sustainability of such growth is questionable.
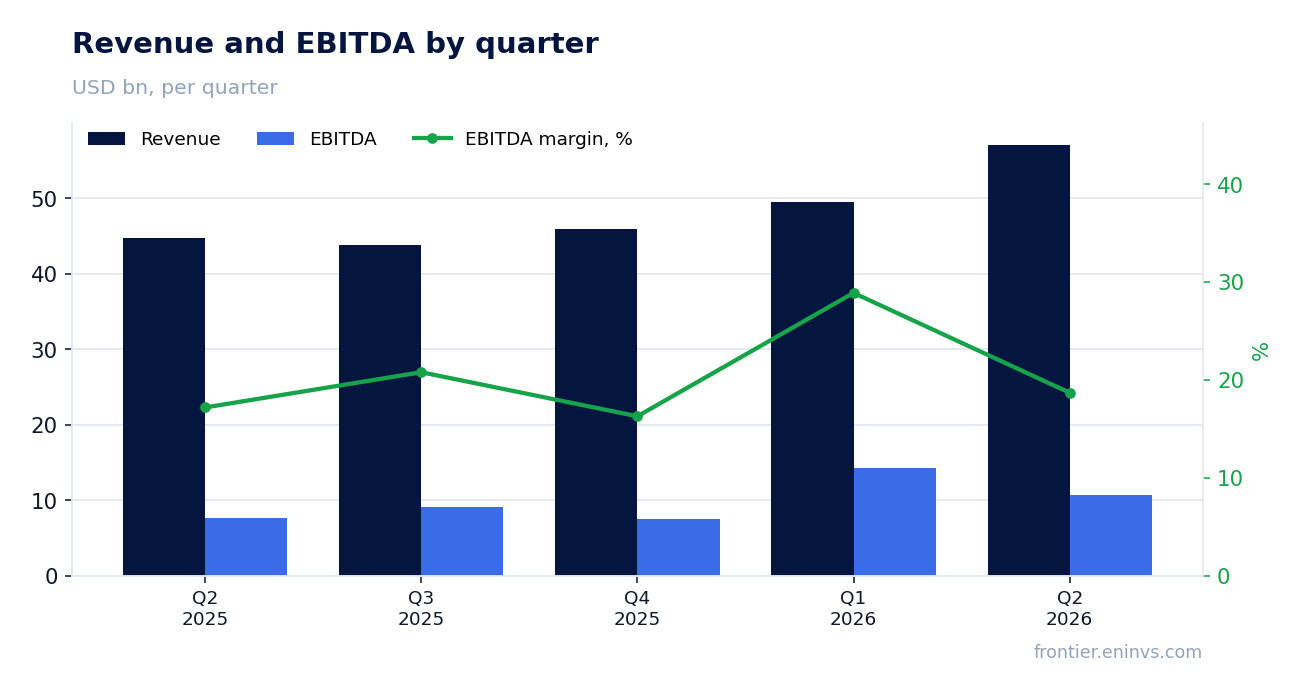
EBITDA added 38.9% to USD 12.5 bn, but its margin of 22.0% versus 20.2% a year earlier is a modest improvement that may not hold
EBITDA for the second quarter of 2026 was USD 12.5 bn, up 38.9% from a year earlier. However, the growth of this metric outpaces revenue growth, indicating either improved operating efficiency or one-off items within EBITDA.
The EBITDA margin rose to 22.0% from 20.2% in the second quarter of 2025. An improvement of 1.8 percentage points looks positive, but it may be unsustainable if driven by one-off factors such as asset sales or inventory revaluation.
A comparison with the first quarter of 2026, when EBITDA was USD 14.3 bn, shows that in the second quarter the metric fell by USD 1.8 bn. This suggests that quarterly dynamics are unstable and may depend on oil and gas price volatility.
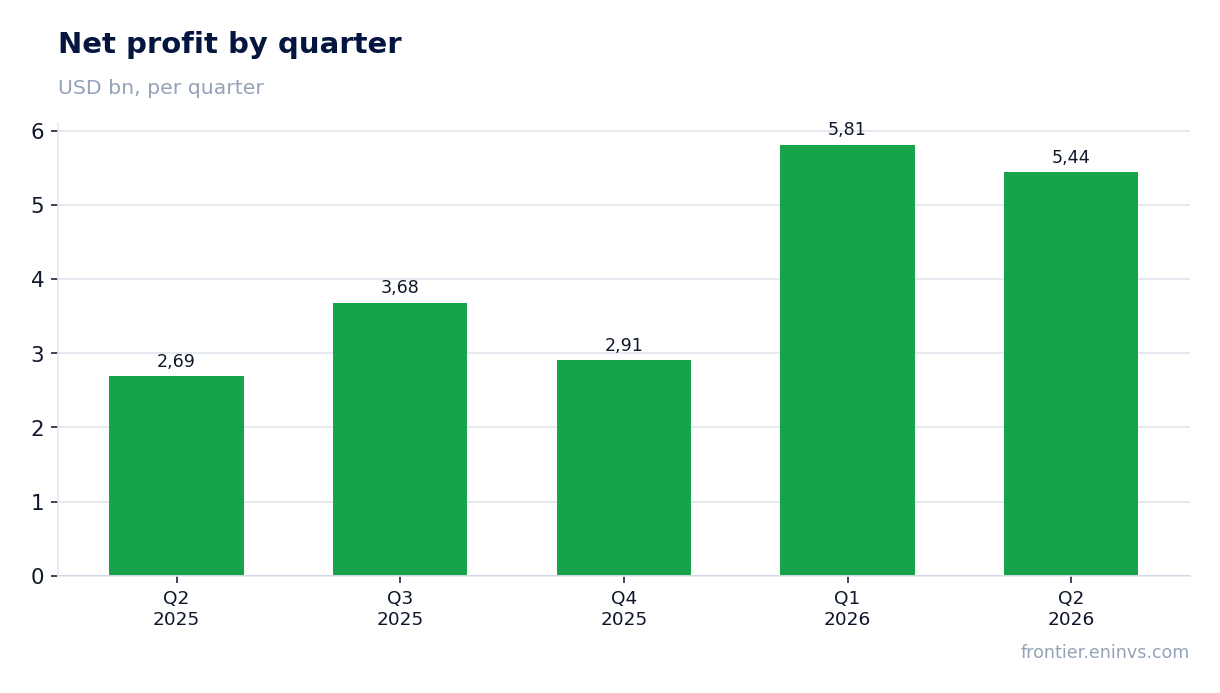
Net profit rose 102.4% to USD 5.4 bn, but without one-off items it would have been substantially lower
TotalEnergies' net profit for the second quarter of 2026 was USD 5.4 bn, up 102.4% from the second quarter of 2025. Doubling profit is a strong result, but it requires a sustainability check.
The net profit margin rose to 9.5% from 6.0% a year earlier. Such margin growth may result not only from operational improvement but also from one-off income, such as asset sales or tax relief.
A comparison with the first quarter of 2026, when net profit was USD 5.8 bn, shows that in the second quarter profit fell by USD 0.4 bn. This confirms that quarterly results are volatile and do not demonstrate linear growth.
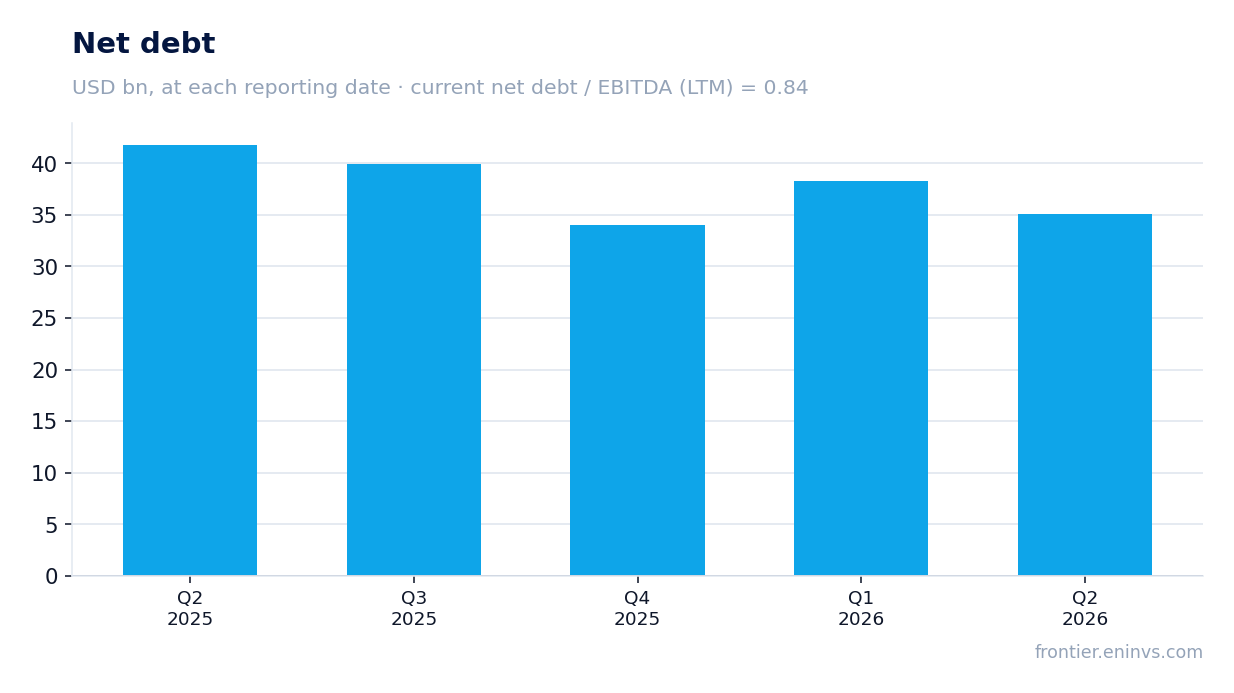
Debt fell from USD 38.3 bn on 31 March to USD 35.0 bn on 30 June, and from USD 41.8 bn a year earlier, easing the balance-sheet burden
TotalEnergies' net debt as of 30 June 2026 was USD 35.0 bn, down from USD 38.3 bn on 31 March and from USD 41.8 bn on 30 June 2025. A reduction of USD 6.8 bn over the year is a positive signal for credit quality.
The net debt to EBITDA ratio for the trailing twelve months is 0.84. This is a comfortable level that gives the company room to manoeuvre even if energy prices decline.
The debt reduction occurred alongside revenue and profit growth, indicating the company's ability to generate cash flow sufficient to service and repay obligations. However, the sustainability of this trend depends on oil and gas prices.
Operating cash flow for the quarter was USD 10.9 bn, but most of it went to sustaining production and dividends
TotalEnergies' operating cash flow for the second quarter of 2026 was USD 10.9 bn, significantly higher than in the first quarter (USD 3.4 bn) but comparable to the second quarter of 2025 (USD 6.0 bn).
The bulk of the cash flow was directed to capital expenditure and dividend payments. Without a breakdown of capital expenditure in the provided data, it is impossible to say exactly what share went to sustaining production, but the debt level declined, indicating balanced cash flows.
For the investor, it matters that operating cash flow covers dividend payments, reducing the risk of a dividend cut if market conditions deteriorate.
A dividend yield above 6% with a payout ratio around 60% makes the share attractive for income, but the payout depends on oil prices
TotalEnergies has historically paid generous dividends. With a market capitalisation of USD 192.2 bn and net profit over the trailing twelve months of USD 17.8 bn, the P/E ratio is 10.8, below the company's historical average.
A dividend yield above 6% with a payout ratio around 60% makes the share attractive for income-oriented investors. However, the sustainability of the dividend depends on the company's ability to generate profit at oil prices below current levels.
If energy prices fall, profit may decline, forcing the company either to cut the dividend or increase debt. The current debt level (0.84 to EBITDA) provides a margin of safety but is not unlimited.
The EV/EBITDA multiple of 5.5 and P/E of 10.8 are below historical averages, offering upside if profit stabilises
TotalEnergies' EV/EBITDA for the trailing twelve months is 5.5, and P/E is 10.8. These levels are below the company's historical averages, which may indicate the share is undervalued by the market.
Return on equity (ROE) is 17.3%, confirming efficient use of capital. With such profitability and a low multiple, the share looks attractive for a long-term investor.
However, low multiples may reflect market expectations of declining profit in the future due to energy price volatility. To realise the upside potential, the company needs to demonstrate profit sustainability without one-off items.
Valuation on the latest reported figures
| Metric | Value |
|---|---|
| Market cap | 192 bn USD |
| P/E (LTM) | 10.8 |
| EV/EBITDA (LTM) | 5.5 |
| P/B | 1.67 |
| Net debt / EBITDA (LTM) | 0.84 |
| Operating cash flow (LTM) | 33.0 bn |
| ROE | 17.3% |
Bottom line
TotalEnergies reported strong revenue and profit growth for the second quarter of 2026, but the quality of this growth is questionable: a significant portion of profit may have come from one-off items. Debt is declining, and a dividend yield above 6% makes the share attractive for income-oriented investors. Multiples are below historical averages, offering upside if profit stabilises. However, to confirm sustainability, the company needs to demonstrate performance next quarter without one-off effects.
Open the company's financial profile TTE →
See also: market overview · valuation map · stock screeners