Tamarack Valley Energy: profit up 2.4x as net debt turns into net cash
Tamarack Valley Energy reported second-quarter 2026 results. Revenue rose 45.4% year on year to USD 445.5 million, EBITDA grew 41.9% to USD 283.6 million, and net profit jumped 137.2% to USD 147.9 million. Net debt at 30 June 2026 stood at minus USD 122.0 million versus USD 538.4 million a year earlier. In our view the shares look attractive: the EV/EBITDA multiple of 5.4x is above the company's own three-year average, but the company has moved into net cash and the portal model implies 21% upside to fair value.
Key takeaways
— Q2 revenue rose 45.4% year on year to USD 445.5 million, an acceleration from 4.6% in Q1
— EBITDA grew 41.9% to USD 283.6 million, but its margin slipped to 63.6% from 65.2% a year earlier
— Net profit rose 2.4x to USD 147.9 million, lifting the net margin to 33.2% from 20.3%
— Net debt turned into net cash: from USD 538.4 million on 30 June 2025 to minus USD 122.0 million on 30 June 2026
— Operating cash flow of USD 225.3 million in the quarter covers both dividends and potential investment
— Trailing twelve-month dividend yield of 1.28% is below the key rate and leaves little room for error
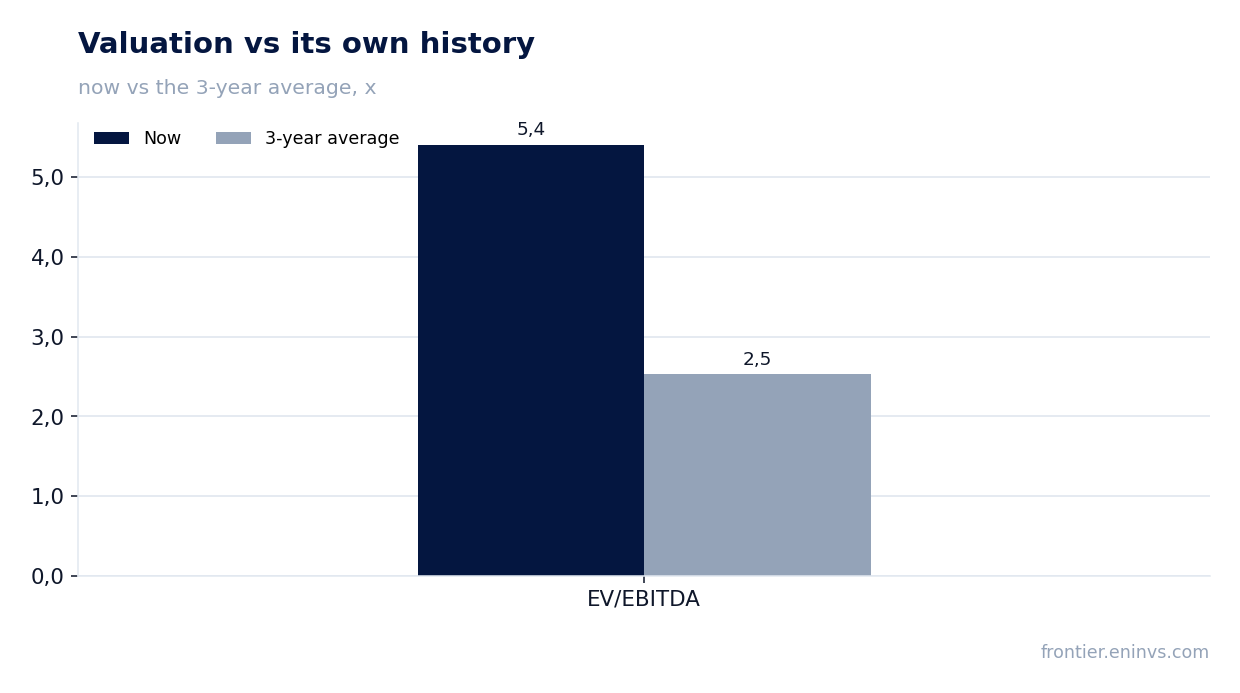
— EV/EBITDA of 5.4x versus its own three-year average of 2.5x means the market already prices in sustained results
Attractiveness
Key figures, USD bn
| Metric | Q2 2025 | Q2 2026 | Change |
|---|---|---|---|
| Revenue | 0.31 | 0.45 | +45.4% |
| EBITDA | 0.20 | 0.28 | +41.9% |
| Operating profit | 0.07 | 0.20 | +179.5% |
| Net profit | 0.06 | 0.15 | +137.2% |
| Operating cash flow | 0.14 | 0.23 | +64.4% |
| EBITDA margin | 65.2% | 63.6% | -1.6 pp |
| Net margin | 20.3% | 33.2% | +12.9 pp |
Q2 revenue rose 45.4% year on year to USD 445.5 million, an acceleration from 4.6% in Q1
Q2 2026 revenue came in at USD 445.5 million, up 45.4% from the same quarter a year earlier. This marks a clear acceleration from 4.6% growth in Q1 2026. The quarterly trend improved after a relatively weak start to the year.
The revenue increase likely reflects higher production volumes or favourable prices, though the provided facts do not break down these drivers. We note the acceleration itself: while Q1 annual growth was modest, Q2 delivered a substantial double-digit rise.
To gauge sustainability, it matters how much of this pace carries into coming quarters. No Q3 data is available yet, but the current revenue level is well above the previous four quarters.
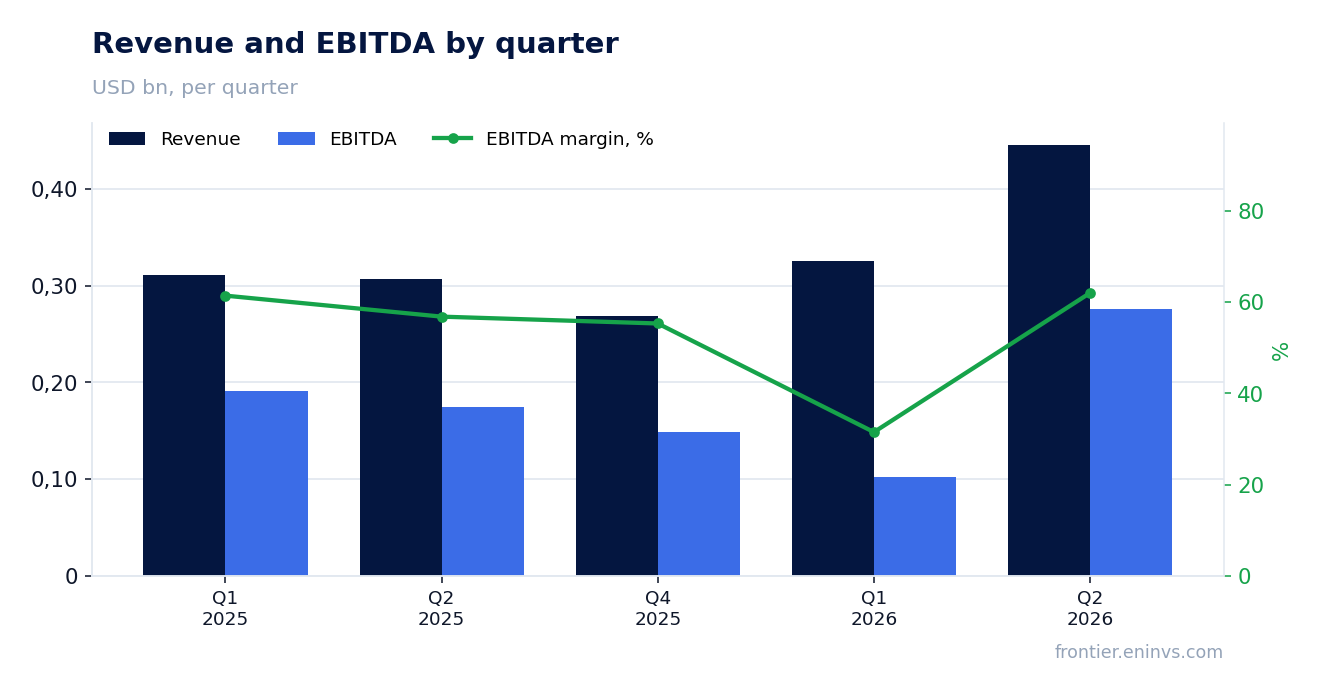
EBITDA grew 41.9% to USD 283.6 million, but its margin slipped to 63.6% from 65.2% a year earlier
Q2 2026 EBITDA reached USD 283.6 million, up 41.9% year on year. However, the EBITDA margin declined to 63.6% from 65.2% in the same quarter last year. This means costs grew faster than revenue.
The 1.6 percentage point margin decline could point to higher operating expenses or a change in revenue mix. The facts do not provide a cost breakdown, so we cannot name a specific cause. Still, the margin level remains high for the sector.
For investors, it matters whether this is a one-off or the start of a trend. If the margin continues to erode, it could cap profit growth even as revenue rises.
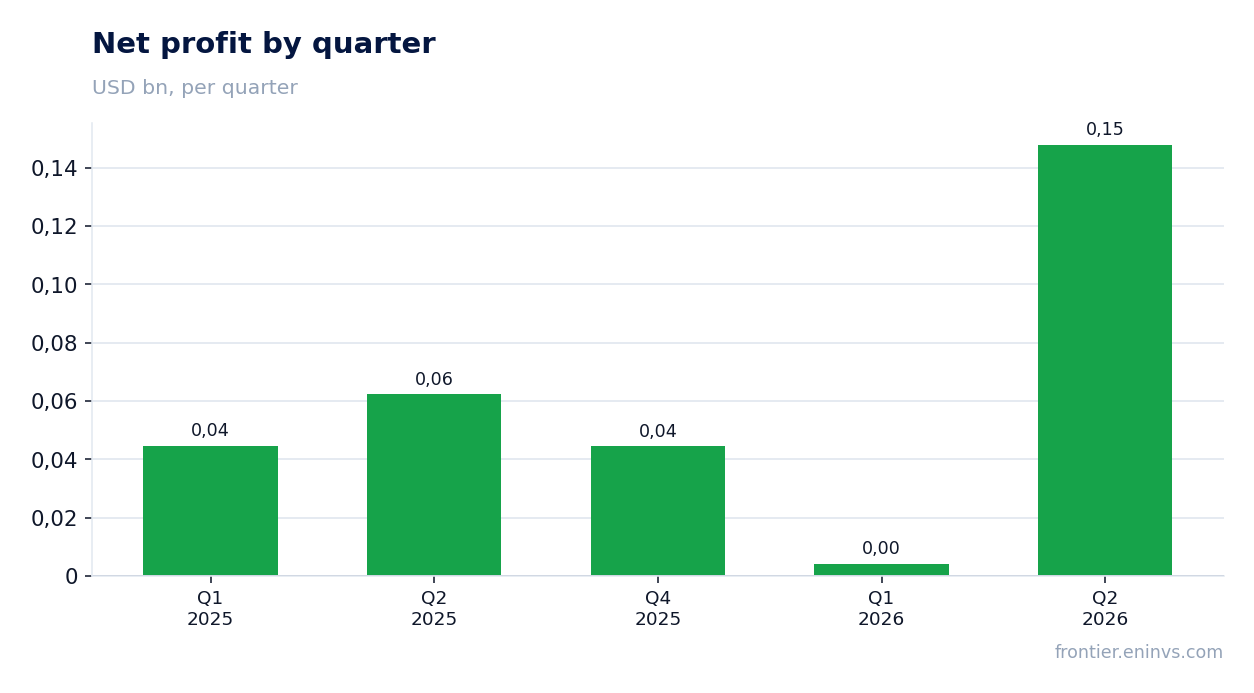
Net profit rose 2.4x to USD 147.9 million, lifting the net margin to 33.2% from 20.3%
Q2 2026 net profit came in at USD 147.9 million, 2.4 times higher than a year earlier. The net margin rose to 33.2% from 20.3%. This profit growth significantly outpaces the increase in revenue and EBITDA.
The faster profit growth could be explained by lower interest expenses or one-off factors, but the facts lack detail. We note that profit grew faster than operating metrics, which is positive for shareholders.
However, the sustainability of this profit level depends on continued favourable conditions and the absence of large one-off charges. In the next report, watch the net margin trend.
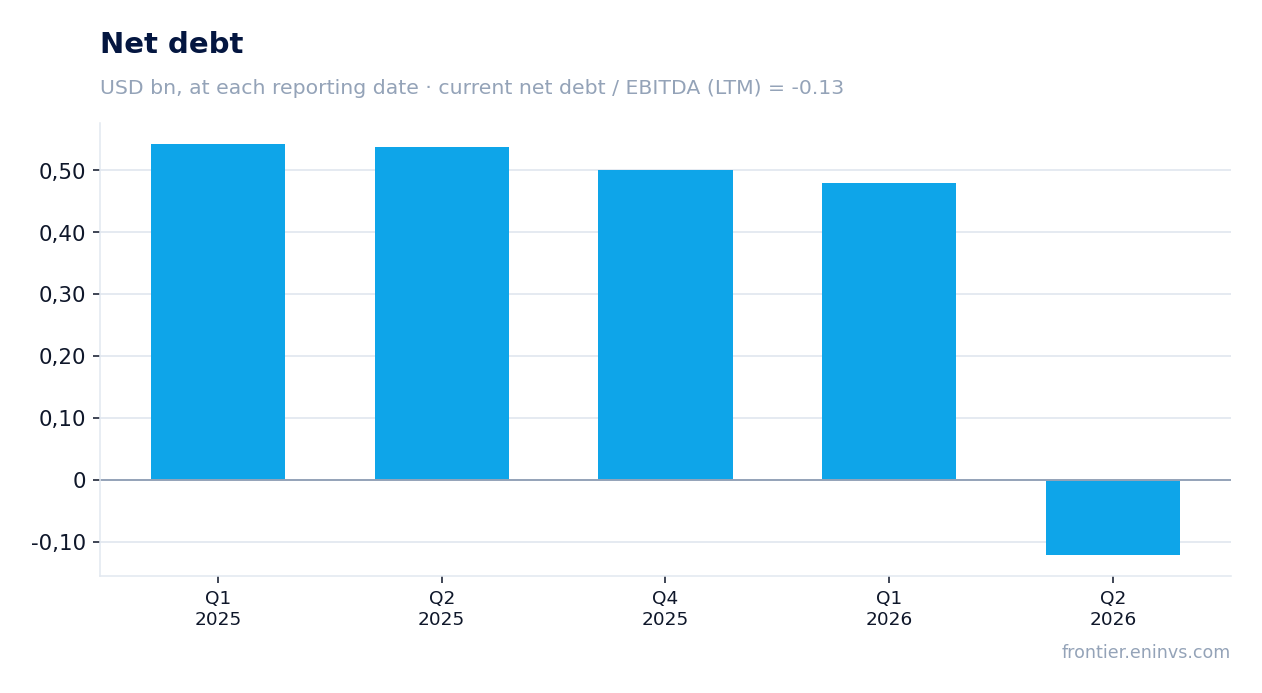
Net debt turned into net cash: from USD 538.4 million on 30 June 2025 to minus USD 122.0 million on 30 June 2026
As of 30 June 2026, net debt stood at minus USD 122.0 million, meaning the company moved into a net cash position. A year earlier, on 30 June 2025, net debt was USD 538.4 million. The reduction over the year was USD 660.4 million.
Also, during the quarter net debt fell from USD 478.8 million on 31 March 2026 to minus USD 122.0 million on 30 June 2026. This is a significant balance sheet improvement that reduces financial risk and creates room for dividends or investment.
The net debt to EBITDA ratio for the trailing twelve months is minus 0.13, reflecting the net cash position. We cannot judge the direction of the ratio as the facts do not provide a prior value, but the level itself indicates high financial stability.
Operating cash flow of USD 225.3 million in the quarter covers both dividends and potential investment
Operating cash flow in Q2 2026 was USD 225.3 million. That is 64.2% higher than USD 137.1 million a year earlier. This inflow allows the company to fund dividends and capital expenditures without increasing debt.
The facts do not provide capital expenditure data, so we cannot assess free cash flow. However, with a net cash position and positive operating cash flow, the company has good liquidity.
The trailing twelve-month dividend yield is 1.28%, which at current prices implies moderate payouts. Operating cash flow comfortably covers these payments.
Trailing twelve-month dividend yield of 1.28% is below the key rate and leaves little room for error
The trailing twelve-month dividend yield is 1.28%. This is below the current key rate, making the stock less appealing for income-oriented investors. The company pays dividends, but the amount is modest relative to the share price.
With trailing twelve-month net profit of USD 59.6 million and a market capitalisation of USD 4.4 billion, dividend payments appear moderate. We cannot assess the payout ratio as the facts do not provide the absolute annual dividend amount.
If the company maintains the current payout level, the dividend yield will remain low. Higher payouts would require sustained growth in profit and cash flow.
EV/EBITDA of 5.4x versus its own three-year average of 2.5x means the market already prices in sustained results
The current EV/EBITDA multiple is 5.4x, more than double its own three-year average of 2.5x. This indicates that the market values the company higher than its average over the past three years. Investors may be expecting sustained high commodity prices and further growth in financial metrics.
The trailing twelve-month P/E is 73.9, reflecting low profit over that period relative to market capitalisation. However, in Q2 2026 profit rose significantly, and if this level persists, the P/E could decline.
According to the portal's model, the upside to fair value is 21%. This is our own estimate, based on re-pricing EBITDA at current commodity prices and a target EV/EBITDA. It is not a market consensus.
Valuation on the latest reported figures
| Metric | Value |
|---|---|
| Market cap | 4.40 bn USD |
| P/E (LTM) | 73.9 |
| EV/EBITDA (LTM) | 5.4 |
| P/B | 3.30 |
| Net debt / EBITDA (LTM) | -0.13 |
| Operating cash flow (LTM) | 0.65 bn |
| ROE | 46.0% |
| Dividend yield (12m) | 1.3% |
| EV/EBITDA, 3-year average | 2.5 |
Bottom line
Bottom line: in Q2 2026 Tamarack Valley Energy delivered strong acceleration in revenue and profit, as well as a shift to net cash. However, the decline in EBITDA margin and the high EV/EBITDA multiple relative to its own history suggest the market has already priced in a positive scenario. The dividend yield of 1.28% is below the key rate, limiting appeal for conservative investors. In our view, the shares look attractive given the 21% upside from the portal model, but another quarter of sustained high profit is needed to confirm the trend.
Open the company's financial profile TVE →
See also: market overview · valuation map · stock screeners