Vista Energy: revenue doubled, but profit lagged it threefold
On August 25, Vista Energy released its results for the second quarter of 2026. Revenue grew 102.3% year on year to USD 1,234.9 million, EBITDA added 53.1% to USD 792.9 million, and net profit rose 41.5% to USD 333.0 million. Revenue growth is twice as fast as profit growth, while the EBITDA margin fell to 64.2% from 84.8% a year earlier. With an EV/EBITDA multiple of 4.53 and the portal's model implying 67% upside, the stock looks attractive, but the key question is margin retention.
Key takeaways
— Revenue grew 102.3% year on year to USD 1,234.9 million, but EBITDA added only 53.1%
— The EBITDA margin fell to 64.2% from 84.8% a year earlier, pointing to faster cost growth
— Net profit rose 41.5% year on year to USD 333.0 million, lagging revenue dynamics
— Operating cash flow for the quarter was USD 987.2 million, above net profit
— Net debt rose to USD 3.5 billion as of June 30, 2026, from USD 2.5 billion a year earlier
— The net debt / EBITDA LTM ratio stands at 1.76 – a moderate level
— The EV/EBITDA LTM multiple is 4.53, while the portal's model implies 67% upside
Attractiveness
Key figures, USD bn
| Metric | Q2 2025 | Q2 2026 | Change |
|---|---|---|---|
| Revenue | 0.61 | 1.23 | +102.3% |
| EBITDA | 0.52 | 0.79 | +53.1% |
| Operating profit | 0.22 | 0.55 | +148.4% |
| Net profit | 0.24 | 0.33 | +41.5% |
| Operating cash flow | -0.01 | 0.99 | to profit |
| EBITDA margin | 84.8% | 64.2% | -20.6 pp |
| Net margin | 38.5% | 27.0% | -11.5 pp |
Revenue grew 102.3% year on year to USD 1,234.9 million, but EBITDA added only 53.1%
Vista Energy's revenue for the second quarter of 2026 was USD 1,234.9 million, double the year-earlier figure. This growth stems from both higher production and sales volumes and favourable hydrocarbon prices. However, EBITDA for the same period grew only 53.1% to USD 792.9 million, significantly slower than revenue.
The gap between revenue and EBITDA dynamics indicates that costs grew faster. This could be due to increased production at higher-cost fields, rising personnel and material expenses, or a change in sales mix. Without detailed cost breakdown, the exact cause is not named, but the fact that profit lags revenue is clear.
For an investor, such revenue growth with modest EBITDA growth signals potential pressure on profitability. If the company cannot keep costs in check, further revenue growth will convert into profit to an ever-smaller extent.
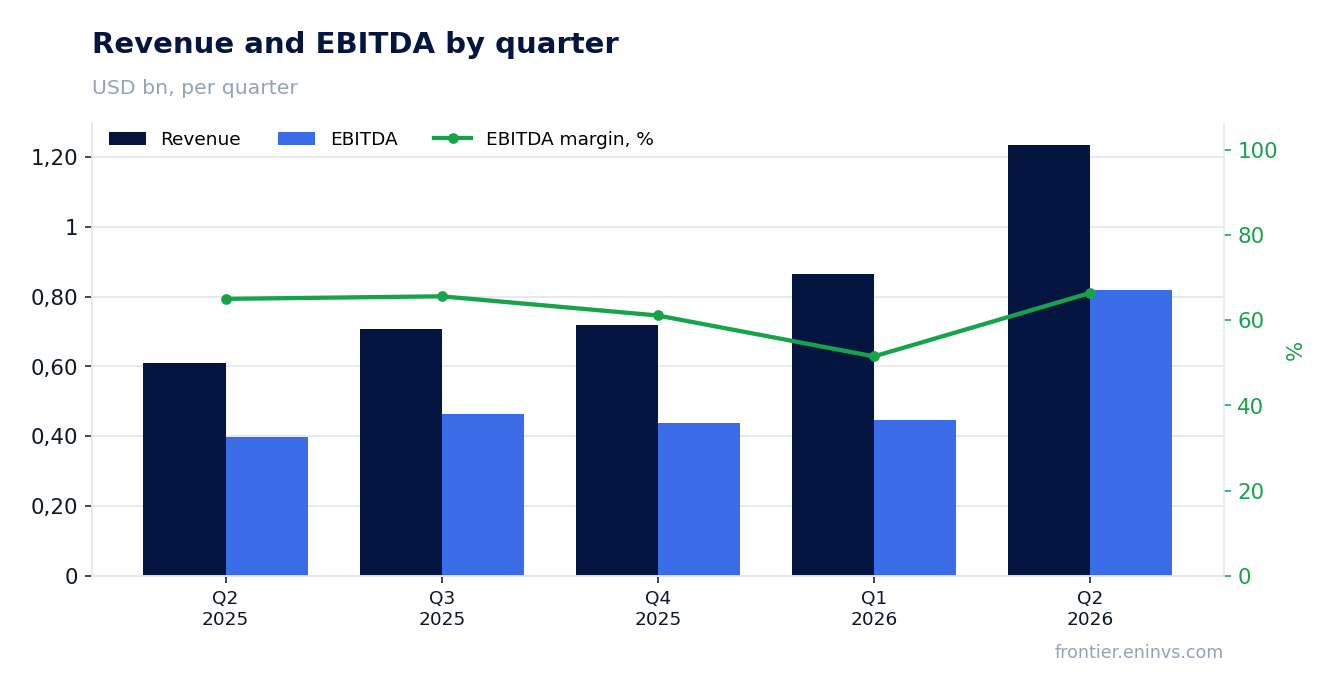
The EBITDA margin fell to 64.2% from 84.8% a year earlier, pointing to faster cost growth
The EBITDA margin in the second quarter of 2026 was 64.2%, compared with 84.8% a year earlier. A decline of 20.6 percentage points is a significant change, indicating that cost growth outpaced revenue growth. This is a key point in the report that may concern investors.
Such a sharp margin drop could be due to several factors: an increased share of third-party purchases, higher transportation costs, increased tax payments, or one-off write-offs. Without detailed company disclosure, the exact cause cannot be named, but the scale of the decline warrants attention.
If the margin remains at this level or continues to decline, it will limit the company's ability to generate free cash flow and maintain dividend payments. At the same time, if the margin decline is due to one-off factors, the situation may improve in subsequent quarters.
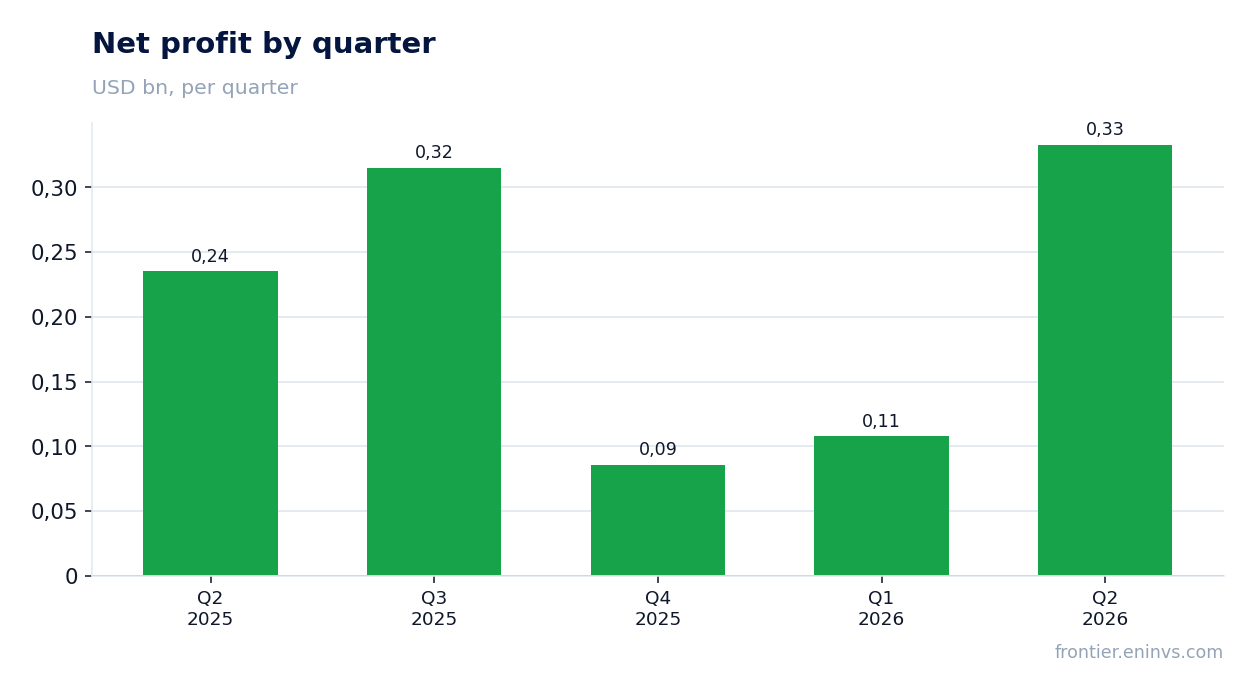
Net profit rose 41.5% year on year to USD 333.0 million, lagging revenue dynamics
Vista Energy's net profit for the second quarter of 2026 was USD 333.0 million, up 41.5% year on year. Profit growth significantly lags revenue growth, explained by both lower operating margin and possibly higher interest expenses or taxes.
The net margin fell to 27.0% from 38.5% a year earlier. This confirms that cost pressure and possibly higher debt burden are eating into profit. Net profit is still growing, but its growth rate is noticeably more modest than that of revenue.
For shareholders, it is important that profit remains positive and growing, but the sustainability of this trend depends on the company's ability to control costs and service debt.
Operating cash flow for the quarter was USD 987.2 million, above net profit
Operating cash flow in the second quarter of 2026 was USD 987.2 million, significantly exceeding net profit of USD 333.0 million. This is a positive signal, indicating that the company generates enough cash to fund its operations and service debt.
The excess of operating cash flow over net profit may be due to non-cash items such as depreciation or changes in working capital. In any case, strong cash flow gives the company flexibility in managing debt and investments.
However, the sustainability of such cash flow depends on hydrocarbon prices and operational efficiency. If the margin continues to decline, cash flow may also come under pressure.
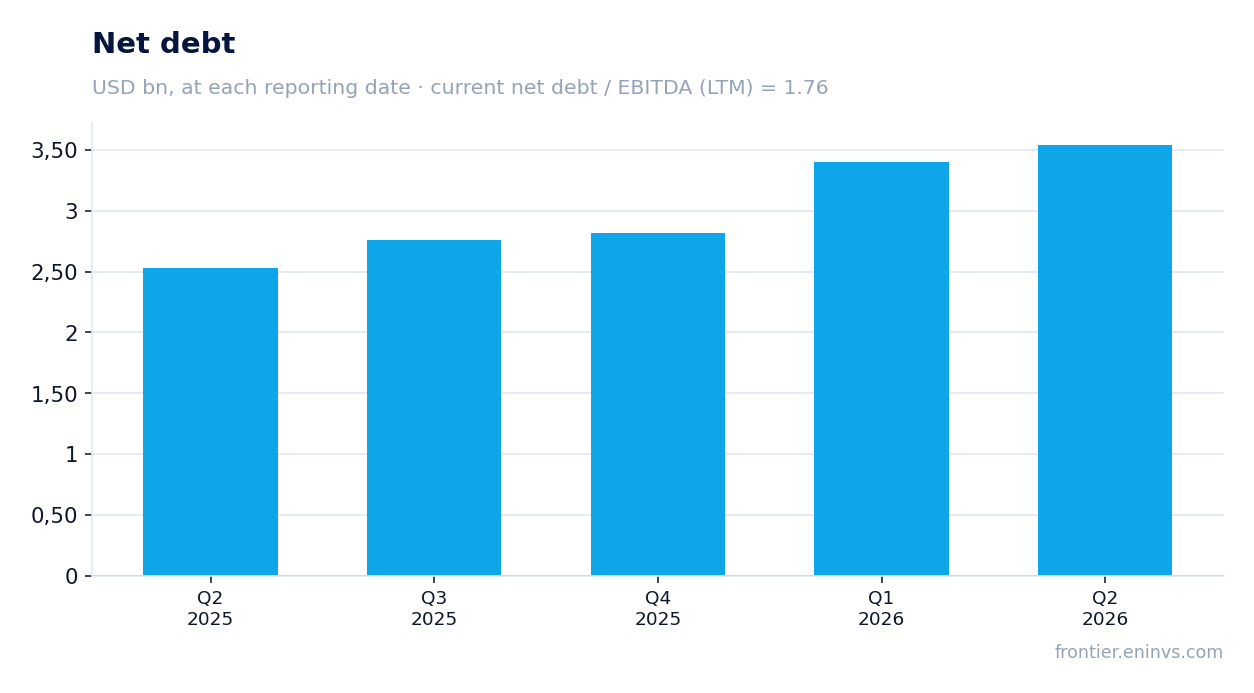
Net debt rose to USD 3.5 billion as of June 30, 2026, from USD 2.5 billion a year earlier
Vista Energy's net debt as of June 30, 2026, was USD 3.5 billion, up from USD 2.5 billion as of June 30, 2025. The USD 1.0 billion increase over the year reflects active investment by the company, possibly in production expansion or infrastructure.
The net debt / EBITDA LTM ratio stands at 1.76, a moderate level for an oil and gas company. This means that debt burden remains under control despite the increase in absolute debt.
It is important to note that debt growth is not necessarily negative if accompanied by business growth and cash flows. However, if the margin continues to decline, debt servicing may become more burdensome.
The net debt / EBITDA LTM ratio stands at 1.76 – a moderate level
The net debt / EBITDA LTM ratio at the end of the second quarter of 2026 is 1.76. This is a moderate level, indicating that the company can service its debt from operating profit. For comparison, many oil and gas companies consider a level up to 2.0–2.5 comfortable.
The net debt to EBITDA LTM ratio has no historical value in the provided data, so it cannot be stated whether it rose or fell. However, the current level is not a concern.
Provided EBITDA remains at the current level or grows, debt burden will remain manageable. If EBITDA starts to decline, the ratio may deteriorate.
The EV/EBITDA LTM multiple is 4.53, while the portal's model implies 67% upside
The EV/EBITDA LTM multiple for Vista Energy is 4.53. This is a relatively low level, which may indicate the company is undervalued compared to historical values or peers. However, without data on industry averages or the company's historical average, a definitive conclusion cannot be drawn.
According to the portal's model, the upside to fair value is estimated at +67%. This is the portal's own estimate, based on re-pricing EBITDA at current commodity prices and a target EV/EBITDA multiple. It is not a market consensus or a target price.
The P/E LTM is 7.45, which also looks low. At the same time, ROE is 44.9%, indicating high efficiency in using capital. The combination of these factors makes the stock attractive for investors willing to accept the risks of the oil and gas sector.
Valuation on the latest reported figures
| Metric | Value |
|---|---|
| Market cap | 6.27 bn USD |
| P/E (LTM) | 7.4 |
| EV/EBITDA (LTM) | 4.5 |
| P/B | 2.50 |
| Net debt / EBITDA (LTM) | 1.76 |
| Operating cash flow (LTM) | 1.81 bn |
| ROE | 44.9% |
Bottom line
Vista Energy showed strong revenue growth in the second quarter of 2026, but profit and profitability lag. The company generates significant operating cash flow, and debt burden remains moderate. The stock trades at low multiples, and the portal's model indicates upside potential. However, the key risk is a further decline in margin, which could limit profit and cash flow growth. At current prices, the stock looks attractive but requires monitoring of cost dynamics.
Open the company's financial profile VIST →
See also: market overview · valuation map · stock screeners