West Fraser Timber: EBITDA back in the black, but net debt swung from -0.3 to 0.3 bn USD over the year
West Fraser Timber reported Q2 2026 results. Revenue came in at USD 1.43 bn, down 6.4% year on year, EBITDA returned to positive USD 53 mn after three consecutive quarters of negative readings, and the net loss narrowed to USD 61 mn. However, net debt swung from -0.3 bn to 0.3 bn USD over the year, and with a market cap of USD 5.4 bn and a dividend yield of 1.4%, the shares do not look attractive at current levels.
Key takeaways
— Revenue fell 6.4% year on year to USD 1.43 bn, but the quarterly trend improved: USD 1.33 bn in Q1 versus USD 1.43 bn in Q2
— EBITDA returned to positive USD 53 mn after -72 mn in Q1 and -770 mn in Q4 2025
— Net loss narrowed to USD 61 mn, but operating loss remained at USD 79 mn
— Operating cash flow in Q2 was USD 192 mn, but over the trailing twelve months it is negative at -92 mn USD
— Net debt swung from -0.3 bn to 0.3 bn USD over the year, while declining from 0.4 bn to 0.3 bn USD over the quarter
— The trailing twelve-month dividend yield is 1.4%, below the key rate and insufficient to offset losses
— The EBITDA margin in Q2 was 3.7% versus 6.2% a year earlier, and the net margin remained negative at -4.3%
Attractiveness
Key figures, USD bn
| Metric | Q2 2025 | Q2 2026 | Change |
|---|---|---|---|
| Revenue | 1.53 | 1.43 | -6.4% |
| EBITDA | 0.10 | 0.05 | -44.2% |
| Operating profit | -0.04 | -0.08 | — |
| Net profit | -0.02 | -0.06 | — |
| Operating cash flow | 0.28 | 0.19 | -32.6% |
| EBITDA margin | 6.2% | 3.7% | -2.5 pp |
| Net margin | -1.6% | -4.3% | -2.7 pp |
Revenue fell 6.4% year on year to USD 1.43 bn, but the quarterly trend improved: USD 1.33 bn in Q1 versus USD 1.43 bn in Q2
West Fraser Timber's Q2 2026 revenue was USD 1.43 bn, down 6.4% from the same quarter a year earlier. The year-on-year decline reflects weak demand for lumber and oriented strand board, as well as continued pressure on prices. However, compared to Q1 2026, revenue rose from USD 1.33 bn to USD 1.43 bn, indicating a recovery from a low base.
The quarterly trend matters more than the annual one: sequential revenue growth of USD 100 mn over the quarter reflects a seasonal pickup in construction and a gradual reduction in distributor inventories. Nevertheless, revenue is still lower year on year, and the sustainability of this recovery is questionable.
The company does not provide segment detail in the supplied facts, so it is impossible to say exactly which segment drove the decline. However, the overall picture suggests the lumber market remains weak, and the quarter-on-quarter growth does not yet offset the annual decline.
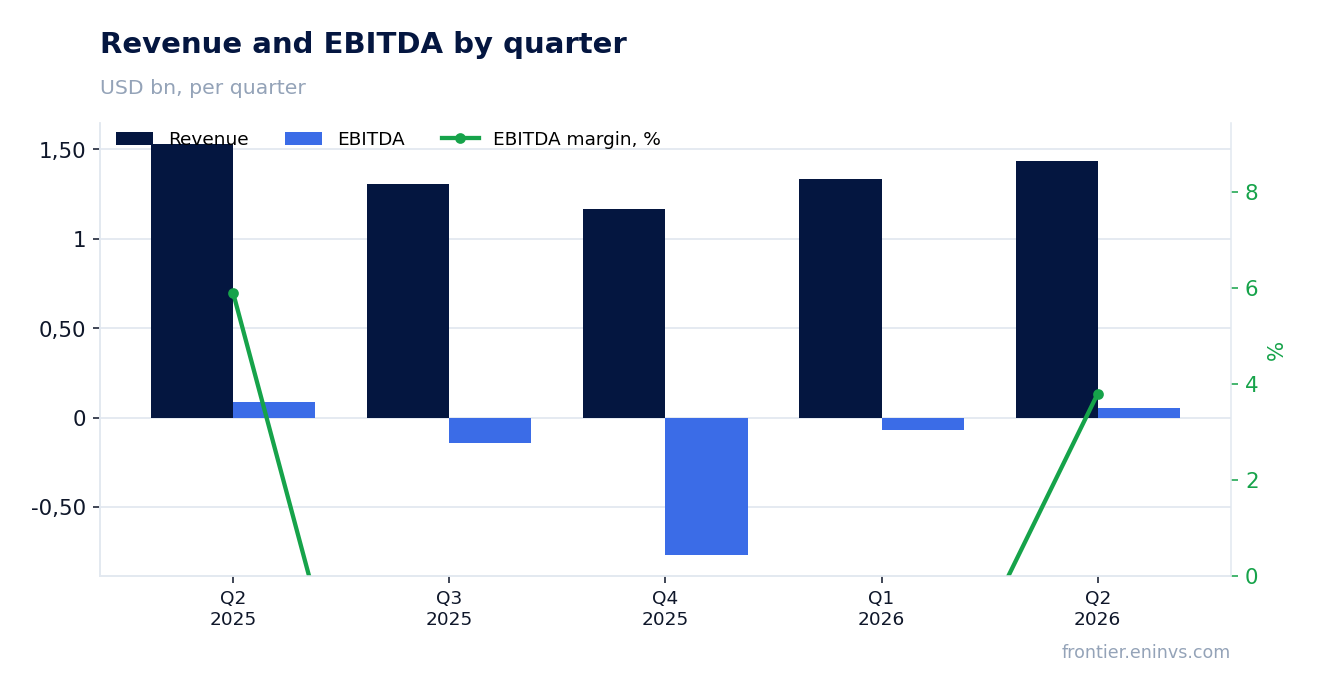
EBITDA returned to positive USD 53 mn after -72 mn in Q1 and -770 mn in Q4 2025
EBITDA in Q2 2026 was USD 53 mn, a significant improvement from negative readings in previous periods. In Q1 2026, EBITDA was -72 mn, and in Q4 2025 it was -770 mn USD. The return to positive EBITDA is an important signal, but its level remains low relative to revenue.
The EBITDA margin in Q2 was 3.7%, down from 6.2% a year earlier. The year-on-year margin decline indicates that quarter-on-quarter revenue growth is not accompanied by an improvement in pricing. The company still operates in an environment of low product prices and a high cost base.
The operating loss in Q2 was USD 79 mn, smaller than in Q1 (210 mn) but still substantial. This means that even with positive EBITDA, operating activities remain loss-making after accounting for depreciation and other operating expenses.
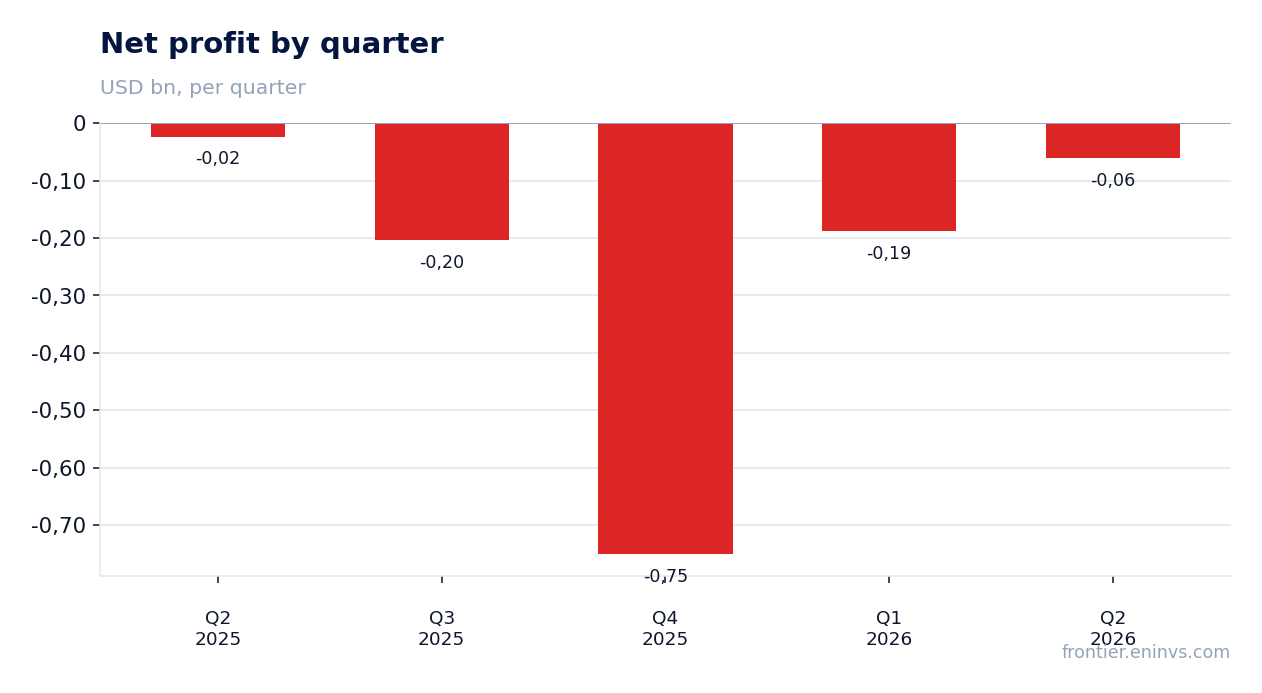
Net loss narrowed to USD 61 mn, but operating loss remained at USD 79 mn
The net loss in Q2 2026 was USD 61 mn, compared to a loss of USD 24 mn a year earlier. The quarter-on-quarter reduction in the loss (from USD 188 mn in Q1) is partly due to positive EBITDA and possibly one-off factors not disclosed in the provided data.
The operating loss remained at USD 79 mn, smaller than in Q1 (USD 210 mn) but still significant. This indicates that the company's core operations have not yet returned to profitability. The net loss is smaller than the operating loss, which may be explained by tax effects or non-operating income.
The net margin in Q2 was -4.3% versus -1.6% a year earlier. The year-on-year deterioration reflects lower revenue and continued losses. To return to profitability, the company needs not only further revenue recovery but also an improvement in pricing.
Operating cash flow in Q2 was USD 192 mn, but over the trailing twelve months it is negative at -92 mn USD
Operating cash flow in Q2 2026 was USD 192 mn, a significant improvement from negative readings in previous quarters: -170 mn in Q1 and -172 mn in Q4 2025. This indicates a recovery in cash generation from core operations.
However, over the trailing twelve months, operating cash flow remains negative at -92 mn USD. This means that despite the improvement in a single quarter, the company has collectively spent more cash than it generated from operations over the year. Negative LTM cash flow puts pressure on liquidity and limits opportunities for investment or dividend payments.
Capital expenditure data is not provided in the facts, so it is impossible to assess how much the company invested in maintaining or expanding capacity. However, negative operating cash flow over 12 months is in itself a warning signal.
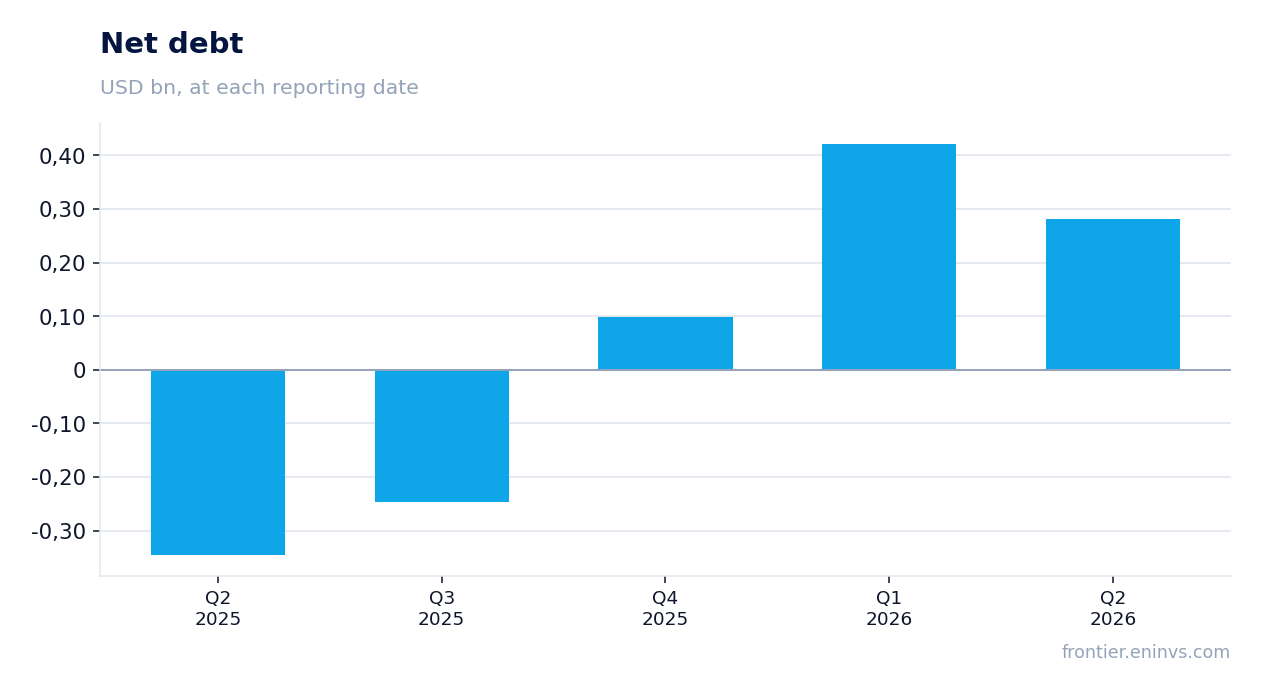
Net debt swung from -0.3 bn to 0.3 bn USD over the year, while declining from 0.4 bn to 0.3 bn USD over the quarter
Net debt as of June 30, 2026, was USD 0.3 bn. A year earlier, on June 30, 2025, the company had a net cash position of -0.3 bn USD, meaning net debt increased by 0.6 bn USD over the year. This reflects a deterioration in the financial position and the use of cash reserves to cover losses.
However, net debt declined over the quarter: from 0.4 bn USD on March 31, 2026, to 0.3 bn on June 30, 2026, a change of -0.1 bn USD. The quarterly reduction in debt is due to positive operating cash flow of USD 192 mn, which partially offset financing needs.
A net debt level of USD 0.3 bn against a market capitalisation of USD 5.4 bn does not look critical, but the shift from a net cash position to debt over the year is a negative signal. The company has lost the safety margin that allowed it to feel comfortable during periods of low prices.
The trailing twelve-month dividend yield is 1.4%, below the key rate and insufficient to offset losses
West Fraser Timber's trailing twelve-month dividend yield is 1.4%. This is a low level that does not offset losses and does not provide significant support to shareholders. For comparison, the key rate in the US is at a higher level, making the company's shares less attractive relative to risk-free instruments.
The company does not disclose in the provided facts the size of the last paid dividend and the period for which it was paid. However, it can be assumed that the dividend policy may be revised downward if losses persist. Negative operating cash flow over the trailing twelve months (-92 mn USD) limits the company's ability to maintain payments without increasing debt.
We cannot forecast the dividend for the current year due to the lack of data on the payout ratio and profit. However, it is clear that if losses and negative cash flow persist, the dividend may be cut or cancelled. This is a key risk for shareholders.
The EBITDA margin in Q2 was 3.7% versus 6.2% a year earlier, and the net margin remained negative at -4.3%
The EBITDA margin in Q2 2026 was 3.7%, significantly below 6.2% a year earlier. The 2.5 percentage point decline reflects both lower revenue and persistently high costs. The company failed to maintain its profitability level due to unfavourable pricing conditions.
The net margin remained negative at -4.3% versus -1.6% a year earlier. The year-on-year deterioration in net margin indicates that losses have become deeper relative to revenue. This is because revenue declined while fixed costs remained at previous levels.
To restore margins, the company needs either a significant increase in product prices or cost reductions. The provided facts do not include cost structure data, so it is impossible to say which line items exerted the most pressure. However, the overall picture indicates that operating efficiency has declined.
Valuation on the latest reported figures
| Metric | Value |
|---|---|
| Market cap | 5.43 bn USD |
| P/B | 0.93 |
| Operating cash flow (LTM) | -0.09 bn |
| ROE | -4.4% |
| Dividend yield (12m) | 1.4% |
Bottom line
West Fraser Timber showed improvement in Q2 2026: EBITDA returned to positive USD 53 mn, and operating cash flow was USD 192 mn. However, year-on-year revenue fell 6.4%, the net margin remained negative, and over the trailing twelve months operating cash flow is negative at -92 mn USD. Net debt swung from -0.3 bn to 0.3 bn USD over the year, indicating a loss of financial strength. A dividend yield of 1.4% does not compensate for the risks. The shares look unattractive at current levels.
Open the company's financial profile WFG →
See also: market overview · valuation map · stock screeners