Wheaton Precious Metals: Q2 2026 revenue up 84.7%, but the company turned into a net debtor for the first time in years

25 августа Wheaton Precious Metals раскрыла результаты за второй квартал 2026 года. Выручка выросла на 84,7% год к году, до 929,2 млн долл., EBITDA – на 97,1%, до 789,9 млн долл., чистая прибыль – на 85,9%, до 543,2 млн долл. Компания сохраняет высокую маржинальность, но впервые за рассматриваемый период чистый долг стал положительным – 1 869,7 млн долл. против отрицательного значения годом ранее. При текущей цене акции выглядят скорее непривлекательно: мультипликатор EV/EBITDA 27,5 выше собственного трёхлетнего среднего 30,6? (здесь и далее – если не указано иное, финансовые показатели в млн долл.)
Key takeaways
— Q2 2026 revenue grew 84.7% YoY to $929.2 million, driven by higher precious metal prices and increased sales volumes
— EBITDA margin reached 85.9%, up 5.4 pp YoY, reflecting the operating leverage of the business
— Net profit rose 85.9% to $543.2 million, but net margin was nearly flat at 58.5% vs 58.1% a year ago
— The company turned to a positive net debt of $1,869.7 million as of end-June 2026, the first time in the last four quarters
— Operating cash flow of $649.5 million in the quarter covers capex, but net debt increased by $4.0 billion versus the previous reporting date
— Trailing dividend yield is only 0.37%, below historical levels and the key rate
— On the portal's model, the share's fair value is 64% below the current price, indicating significant overvaluation
Attractiveness
Key figures, USD bn
| Metric | Q2 2025 | Q2 2026 | Change |
|---|---|---|---|
| Revenue | 0.50 | 0.93 | +84.7% |
| EBITDA | 0.41 | 0.80 | +97.1% |
| Operating profit | 0.33 | 0.67 | +102.3% |
| Net profit | 0.29 | 0.54 | +85.9% |
| Operating cash flow | 0.41 | 0.65 | +56.5% |
| Capex | 0.35 | — | — |
| EBITDA margin | 80.5% | 85.9% | +5.4 pp |
| Net margin | 58.1% | 58.5% | +0.4 pp |
Q2 2026 revenue grew 84.7% YoY to $929.2 million, driven by higher precious metal prices and increased sales volumes
In Q2 2026, Wheaton Precious Metals generated revenue of $929.2 million, up 84.7% YoY. This continues an accelerating trend: Q1 2026 revenue grew 91.8% YoY, and Q4 2025 revenue was up 126.4%. The company earns revenue from selling precious metals under long-term contracts, so revenue dynamics reflect both gold and silver prices and delivery volumes.
Revenue growth was accompanied by even faster EBITDA growth: Q2 2026 EBITDA rose 97.1% YoY to $789.9 million, indicating high operating profitability and limited cost growth. However, the company does not disclose revenue breakdown by metal in the quarterly report, so the exact contribution of prices and volumes cannot be assessed.
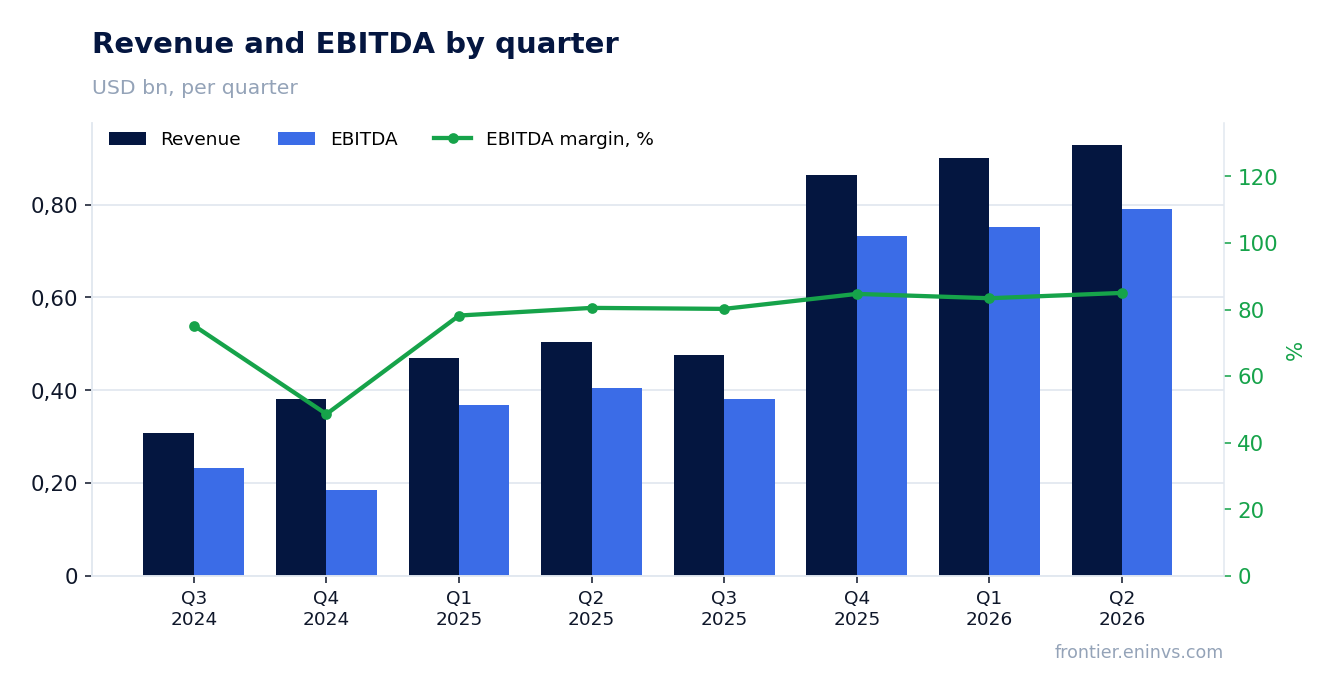
EBITDA margin reached 85.9%, up 5.4 pp YoY, reflecting the operating leverage of the business
Q2 2026 EBITDA margin stood at 85.9%, up from 80.5% a year earlier. The 5.4 pp improvement is explained by the fact that most of Wheaton Precious Metals' costs are payments under contracts that grow slower than revenue when metal prices rise. The company has virtually no mining operating expenses, which ensures such a high level of profitability.
The high margin is not a one-off effect but a structural feature of the business model: Wheaton Precious Metals finances mines in exchange for the right to buy metal at a fixed price, so its costs are largely predictable. Nevertheless, investors should remember that such margins are sensitive to metal prices: if they fall, the decline in revenue will be accompanied by a disproportionate drop in EBITDA.
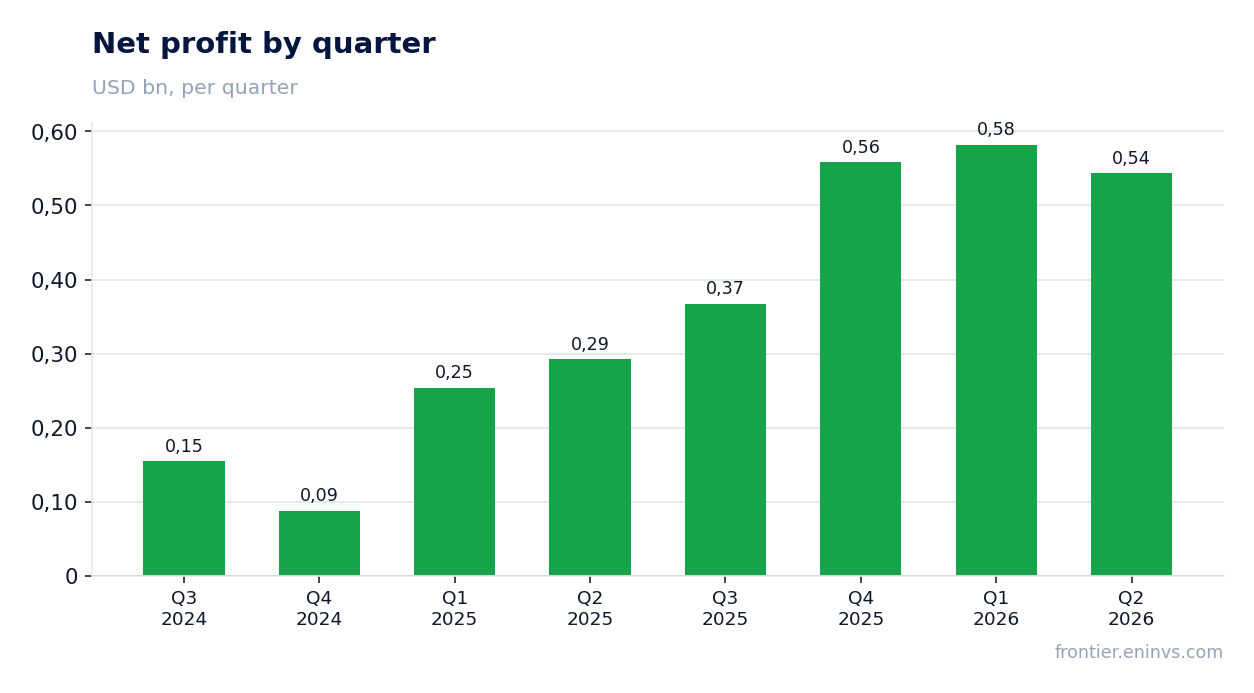
Net profit rose 85.9% to $543.2 million, but net margin was nearly flat at 58.5% vs 58.1% a year ago
Wheaton Precious Metals' Q2 2026 net profit was $543.2 million, up 85.9% YoY. Profit growth almost mirrors revenue dynamics, indicating a stable share of taxes and other expenses. Net margin remained at 58.5% versus 58.1% a year earlier – a negligible change.
Unlike many mining companies, Wheaton Precious Metals does not show one-off items that would distort profit. However, in Q4 2025 net profit exceeded EBITDA ($558.2 million vs $732.3 million EBITDA), suggesting possible one-off gains or tax effects in that period. In Q2 2026, no such anomaly is present.
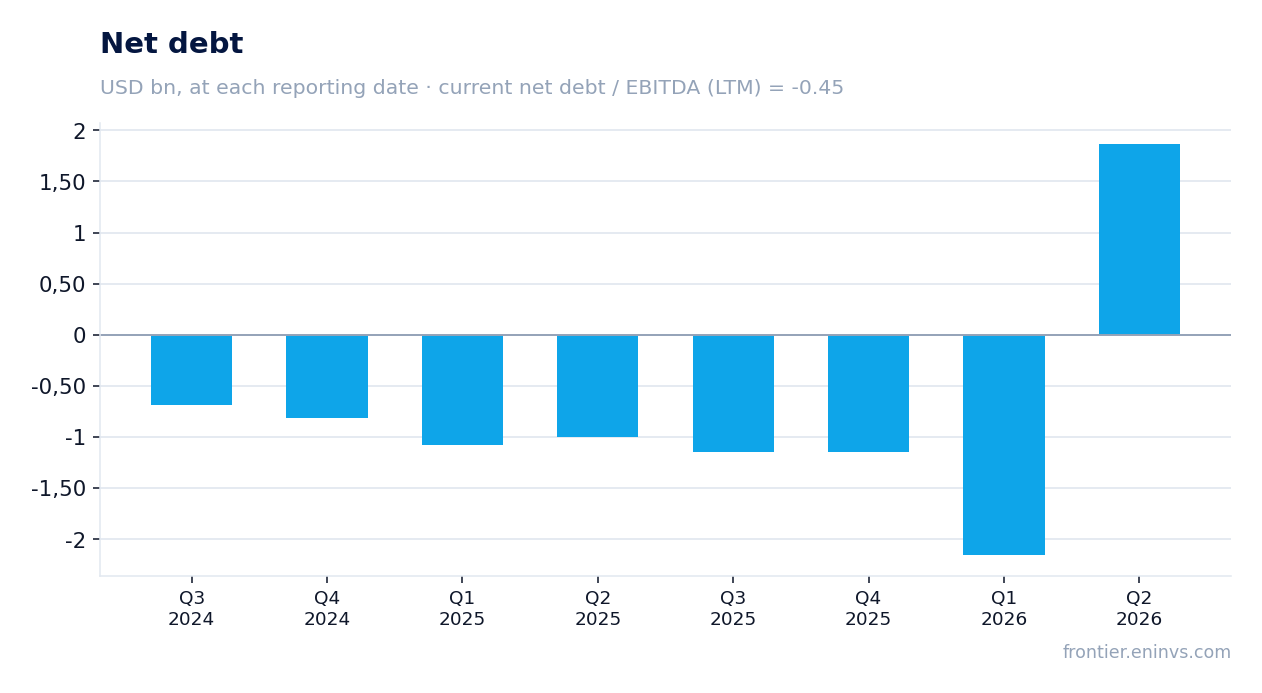
The company turned to a positive net debt of $1,869.7 million as of end-June 2026, the first time in the last four quarters
As of end-June 2026, Wheaton Precious Metals' net debt stood at $1,869.7 million – the first time in the last four quarters that the company has become a net debtor. A year earlier, net debt was negative (-$997.6 million as of end-June 2025), meaning the company had more cash than debt. The change over the quarter was $4.0 billion, and over the last 12 months $2.9 billion.
Positive net debt implies that the company either raised significant borrowings or spent its cash reserves. Given that operating cash flow for the quarter was $649.5 million and capex was negligible, the main reason was likely large investments in new streams or acquisitions. However, the company does not disclose details in the quarterly report.
Operating cash flow of $649.5 million in the quarter covers capex, but net debt increased by $4.0 billion versus the previous reporting date
In Q2 2026, Wheaton Precious Metals generated operating cash flow of $649.5 million, well above capital expenditures, which were minimal in the latest reported quarter (in Q1 2026 – $61.2 million). The company generates sufficient cash to fund current investments and dividend payments.
Nevertheless, net debt increased by $4.0 billion versus the previous reporting date (end-March 2026), when it stood at -$2,156.8 million (negative, i.e., cash exceeded debt). Such a sharp change cannot be explained by operating activities alone – it points to large external investments or acquisitions that the company has not yet detailed.
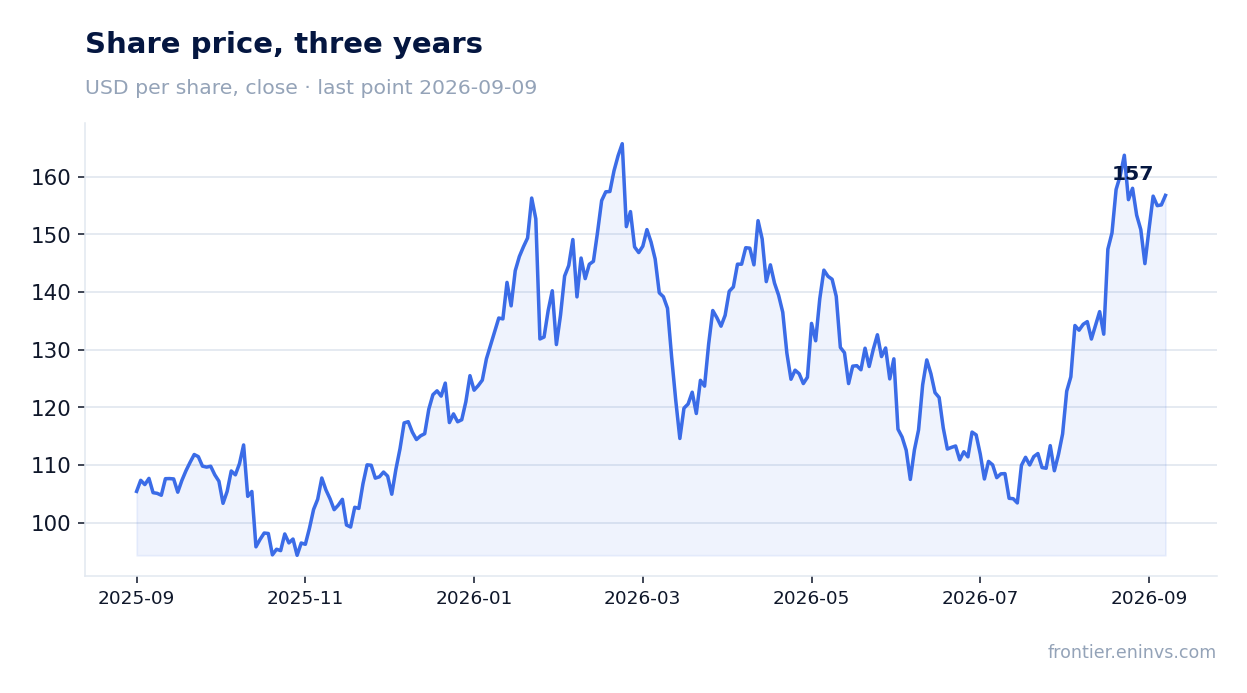
Trailing dividend yield is only 0.37%, below historical levels and the key rate
Over the last 12 months, Wheaton Precious Metals paid dividends corresponding to a yield of 0.37% at the current share price. This is extremely low, especially for a company with high profitability and significant cash flow. Historically, Wheaton Precious Metals has sought to increase dividends, but the current yield does not provide attractive income for yield-oriented shareholders.
The low dividend yield is likely explained by a combination of a high share price (market cap of $71,174.3 million) and a conservative dividend policy that pays out a certain percentage of cash flow. At such a yield, dividends are hardly a key reason to buy the shares, especially compared to risk-free asset yields.
On the portal's model, the share's fair value is 64% below the current price, indicating significant overvaluation
According to the portal's model, which reprices EBITDA at current metal prices and applies a target EV/EBITDA multiple, the fair value of Wheaton Precious Metals' share is 64% below the current market price. This implies that the market is pricing in either persistently high metal prices or significant volume growth that is not yet confirmed by reports.
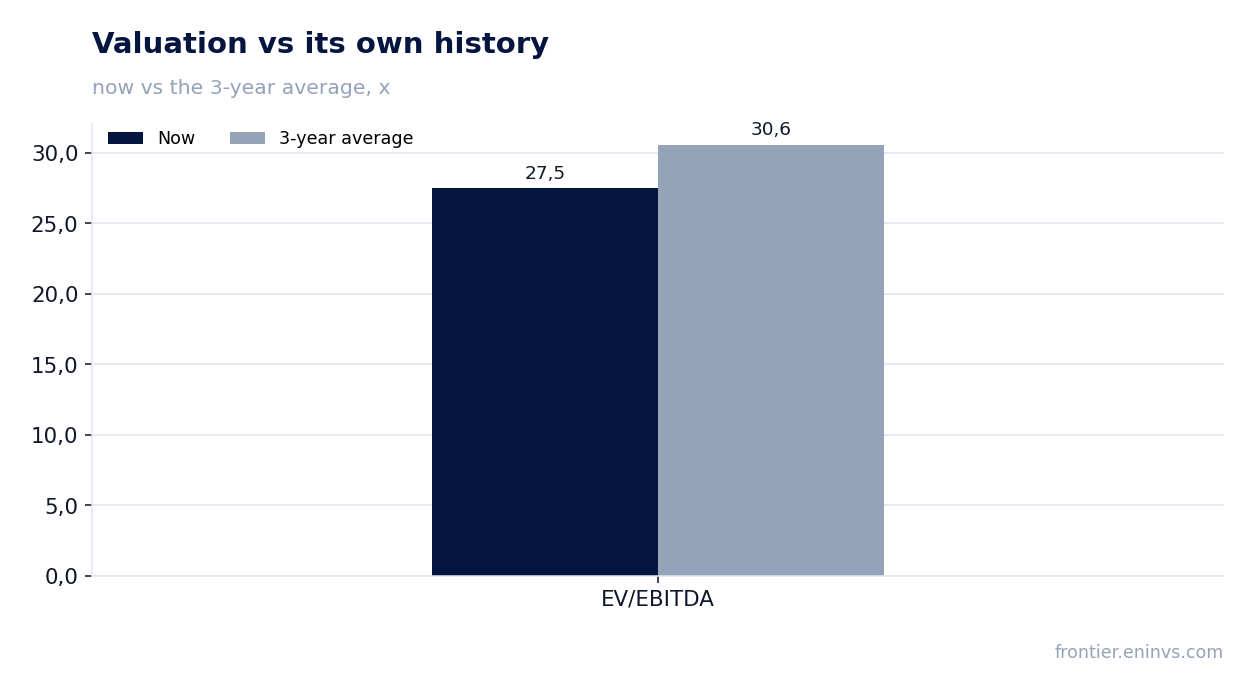
The current EV/EBITDA multiple for the last 12 months is 27.5, which is below its own three-year average of 30.6. Thus, the share trades at a discount to its own history, but the portal's model indicates overvaluation relative to fair value based on current metal prices.
Valuation on the latest reported figures
| Metric | Value |
|---|---|
| Market cap | 71.2 bn USD |
| P/E (LTM) | 34.7 |
| EV/EBITDA (LTM) | 27.5 |
| P/B | 8.19 |
| Net debt / EBITDA (LTM) | -0.45 |
| Operating cash flow (LTM) | 1.90 bn |
| ROE | 23.0% |
| Dividend yield (12m) | 0.4% |
| EV/EBITDA, 3-year average | 30.6 |
Bottom line
Wheaton Precious Metals continues to deliver impressive revenue and EBITDA growth, driven by high precious metal prices. However, behind this growth lies a worrying signal: the company turned to a net debtor for the first time in four quarters, with net debt rising by $4.0 billion in the quarter. The dividend yield remains extremely low at 0.37%, making the share unattractive for income-oriented investors. According to the portal's model, the fair value of the share is 64% below the current price, indicating significant overvaluation. At current metal prices and debt levels, the share looks rather unattractive.
Open the company's financial profile WPM →
See also: market overview · valuation map · stock screeners