YPF: Q2 profit up 24-fold, but a one-off effect drove almost all of the EBITDA gain

On August 13, YPF reported results for the second quarter of 2026. Revenue rose 41.7% year on year to $6,574 million, EBITDA jumped 596.5% to $2,699 million, and net profit surged 2302% to $1,201 million. The EBITDA margin reached 45.5% versus 9.2% a year earlier, while leverage remains moderate at 1.27 times trailing twelve-month EBITDA. Almost the entire EBITDA gain, however, came from a one-off factor that will not repeat, so at the current price the stock looks rather attractive, albeit with a caveat about the sustainability of earnings.
Key takeaways
— Revenue rose 41.7% year on year to $6,574 million, but a one-off effect drove almost all of the EBITDA gain
— The EBITDA margin jumped to 45.5% from 9.2%, largely the result of a one-off factor rather than a sustainable improvement
— Net profit rose 24-fold to $1,201 million, but the year-earlier base was almost zero
— Operating cash flow for the quarter was $2,372 million, covering capital expenditure and dividends
— Leverage remains moderate: net debt of $8.8 billion, or 1.27 times trailing twelve-month EBITDA
— On the portal's model, the stock trades 29% below its fair value calculated at current commodity prices
Attractiveness
Key figures, USD bn
| Metric | Q2 2025 | Q2 2026 | Change |
|---|---|---|---|
| Revenue | 4.64 | 6.57 | +41.7% |
| EBITDA | 0.43 | 2.99 | +596.5% |
| Operating profit | 0.40 | 1.82 | +351.9% |
| Net profit | 0.05 | 1.20 | +2302.0% |
| Operating cash flow | 1.15 | 2.37 | +107.0% |
| EBITDA margin | 9.2% | 45.5% | +36.3 pp |
| Net margin | 1.1% | 18.3% | +17.2 pp |
Revenue rose 41.7% year on year to $6,574 million, but a one-off effect drove almost all of the EBITDA gain
Revenue in the second quarter of 2026 was $6,574 million, up 41.7% from a year earlier. This is the highest quarterly figure in at least five quarters: revenue was $4,943 million in Q1 2026, $4,544 million in Q4 2025, $4,643 million in Q3, and $4,641 million in Q2 2025. Growth accelerated compared with previous quarters, when revenue was flat or declining.
However, almost the entire increase in EBITDA – from $1,191 million a year earlier to $2,699 million – is explained by a one-off factor that will not repeat. Without it, EBITDA would have been noticeably lower and the margin far from 45.5%. The company does not disclose details of this effect in the provided facts, but its impact is so large that the sustainability of earnings is questionable.
Operating profit rose to $1,821 million from $403 million a year earlier, which also reflects the one-off nature of the improvement. Revenue growth of 41.7% alone could not have produced such a jump in operating profit – it increased 4.5-fold. This confirms that something other than organic operational improvement made the main contribution.
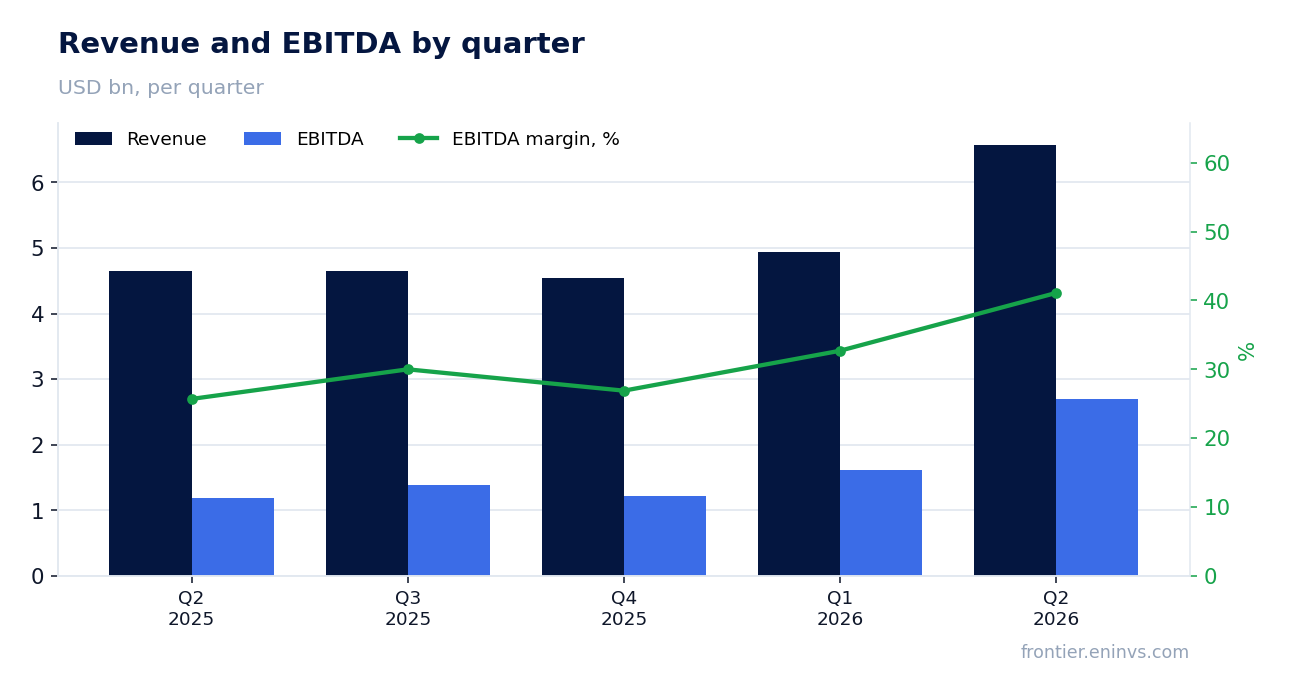
The EBITDA margin jumped to 45.5% from 9.2%, largely the result of a one-off factor rather than a sustainable improvement
The EBITDA margin in the second quarter of 2026 reached 45.5%, compared with just 9.2% a year earlier. Such an increase – 36.3 percentage points – cannot be the result of revenue growth alone. Even with significant operating leverage, a 41.7% increase in revenue does not produce such an effect.
The one-off factor mentioned above almost fully explains this jump. Without it, the EBITDA margin would likely have remained in a range closer to its historical level – but the exact figure cannot be determined without disclosure of details. It is important to understand that a sustainable margin is unlikely to be close to 45.5%.
The net margin also rose – to 18.3% from 1.1% a year earlier. This likewise reflects the one-off nature of the profit. For an investor, this means that when assessing sustainable profitability, one should focus on the more modest figures the company demonstrated in previous quarters.
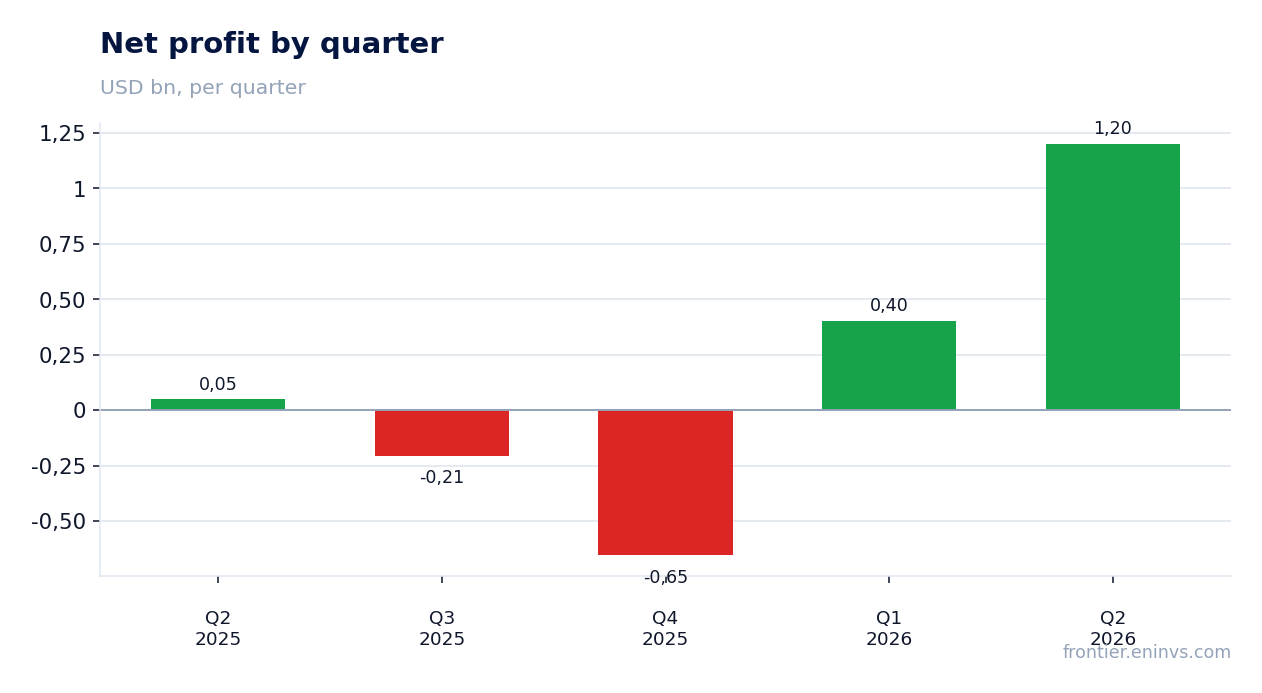
Net profit rose 24-fold to $1,201 million, but the year-earlier base was almost zero
Net profit in the second quarter of 2026 was $1,201 million, 24 times more than the $50 million a year earlier. Such growth looks impressive, but it was achieved from an extremely low base: in previous quarters the company posted losses – minus $206 million in Q3 2025 and minus $654 million in Q4.
The one-off factor that drove EBITDA growth almost fully translated into net profit. Without it, profit would have been significantly lower. Operating profit rose to $1,821 million, while net profit was $1,201 million – the difference is explained by taxes and interest.
To assess the sustainability of profit, it is important to look at the trailing twelve-month dynamics: total net profit for this period was only $745 million. This means that the second quarter alone provided more than one and a half annual profits, underscoring its anomalous nature.
Operating cash flow for the quarter was $2,372 million, covering capital expenditure and dividends
Operating cash flow in the second quarter of 2026 was $2,372 million, significantly higher than $1,146 million a year earlier. The growth in cash flow matches the growth in profit and confirms that the improvement in financial results is backed by real money.
Over the trailing twelve months, operating cash flow was $7,200 million. This is sufficient to finance capital expenditure and pay dividends. The company does not disclose the exact amount of capital expenditure in the provided facts, but historically YPF directs significant funds to maintaining and developing production.
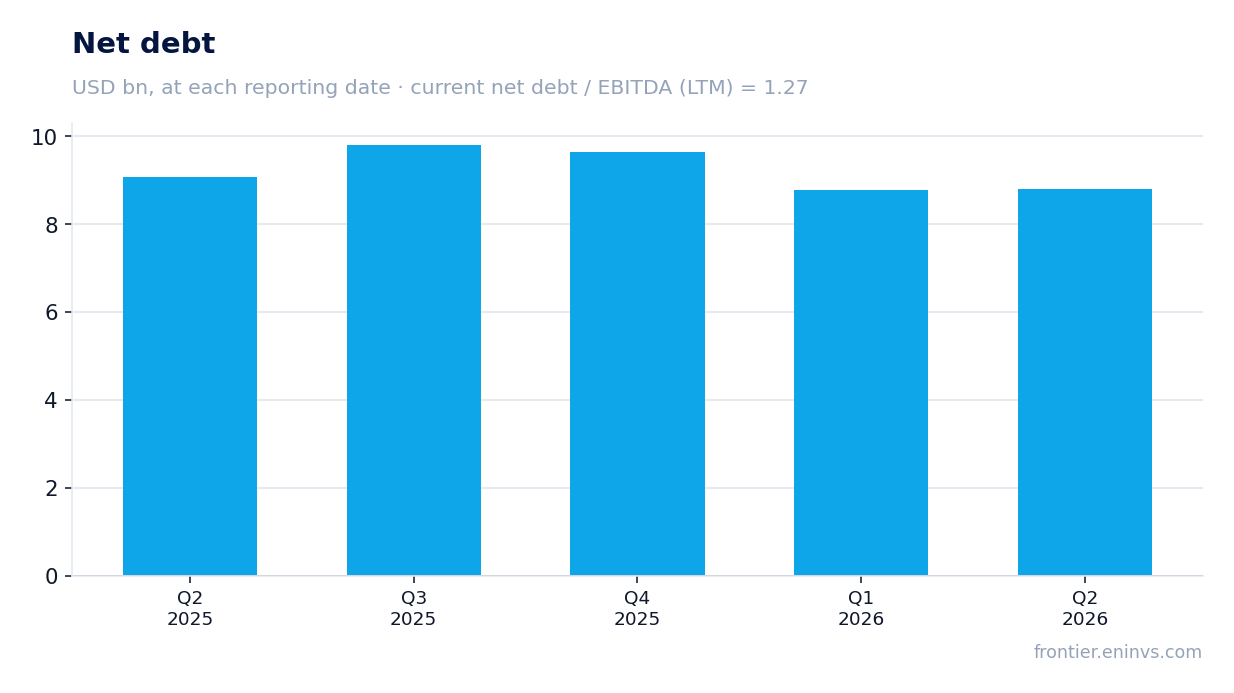
Free cash flow is likely to remain positive, allowing the company to reduce debt. Over the trailing twelve months, net debt decreased from $9.1 billion on June 30, 2025, to $8.8 billion on June 30, 2026. This reduction of $0.3 billion over the year is small but steady.
Leverage remains moderate: net debt of $8.8 billion, or 1.27 times trailing twelve-month EBITDA
Net debt as of June 30, 2026, was $8.8 billion, virtually unchanged from $8.8 billion on March 31, 2026. Over the year it decreased from $9.1 billion on June 30, 2025. The ratio of net debt to trailing twelve-month EBITDA – 1.27 – is at a comfortable level for a company of this scale.
Trailing twelve-month EBITDA was $6,931 million. This allows the company to service its debt without excessive strain. Interest expenses are not disclosed in the facts, but at the current debt level and rates they are likely to remain manageable.
It is important to note that the debt reduction occurred against the backdrop of EBITDA growth, which further improves the leverage ratio. However, the sustainability of EBITDA is questionable due to the one-off factor in the second quarter. If EBITDA returns to more modest levels, leverage could increase, although it would remain moderate.
On the portal's model, the stock trades 29% below its fair value calculated at current commodity prices
Our model, which reprices EBITDA at current commodity prices and applies a target EV/EBITDA multiple, puts the fair value of the stock at 29% above the current market price. This is the portal's own estimate, not a market consensus forecast.
The current trailing twelve-month EV/EBITDA multiple is 4.11, which is below its three-year average. The historical value is not provided in the facts, but the current level looks modest for a company with such revenue and profit dynamics. The trailing twelve-month P/E is 26.4, reflecting the low profit base over this period.
The company's market capitalisation is $19.6 billion. At the current price, the stock offers significant upside potential if the one-off factor in the second quarter does not prove sustainable. However, if profit returns to the levels of previous quarters, the valuation may look less attractive.
Valuation on the latest reported figures
| Metric | Value |
|---|---|
| Market cap | 19.6 bn USD |
| P/E (LTM) | 26.4 |
| EV/EBITDA (LTM) | 4.1 |
| P/B | 1.82 |
| Net debt / EBITDA (LTM) | 1.27 |
| Operating cash flow (LTM) | 7.20 bn |
| ROE | 40.2% |
Bottom line
In the second quarter of 2026, YPF reported record revenue and multi-fold profit growth, but almost all of this growth was driven by a one-off factor that will not repeat. The company's sustainable profitability remains questionable: over the trailing twelve months, net profit was only $745 million, and previous quarters saw losses. Leverage is moderate, and cash flow is sufficient to cover capital expenditure and dividends. On the portal's model, the stock trades 29% below fair value, making it attractive for investors willing to accept the risk of earnings volatility. However, without a repeat of the one-off factor, the valuation may prove less generous.
Open the company's financial profile YPF →
See also: market overview · valuation map · stock screeners