Zijin Mining: profit up by half, but revenue growth slowed to 14%
Zijin Mining reported second-quarter 2026 results. Revenue reached USD 14.0 bn, up 14.0% year on year; EBITDA came in at USD 4.8 bn (+66.7%), and net profit was USD 2.8 bn (+53.9%). The EBITDA margin rose to 34.1% from 23.3% a year earlier. However, revenue growth decelerated: it was 30.8% in Q1 2026 and 14.0% in Q2. Leverage remains low: net debt to LTM EBITDA stands at 0.42. The stock looks attractive at current levels: the LTM EV/EBITDA multiple of 2.14 is below its own three-year average of 3.46, while a 2.86% dividend yield and a 37.7% return on equity support the valuation.
Key takeaways
— Revenue grew 14.0% year on year, but that is half the pace of the previous quarter
— EBITDA rose 66.7%, lifting the margin to 34.1% from 23.3%
— Net profit increased 53.9%, yet the quarterly level was lower than in the prior quarter
— Net debt fell to USD 6.9 bn from USD 15.5 bn a year earlier
— Dividend yield of 2.86% with a payout ratio still to be assessed
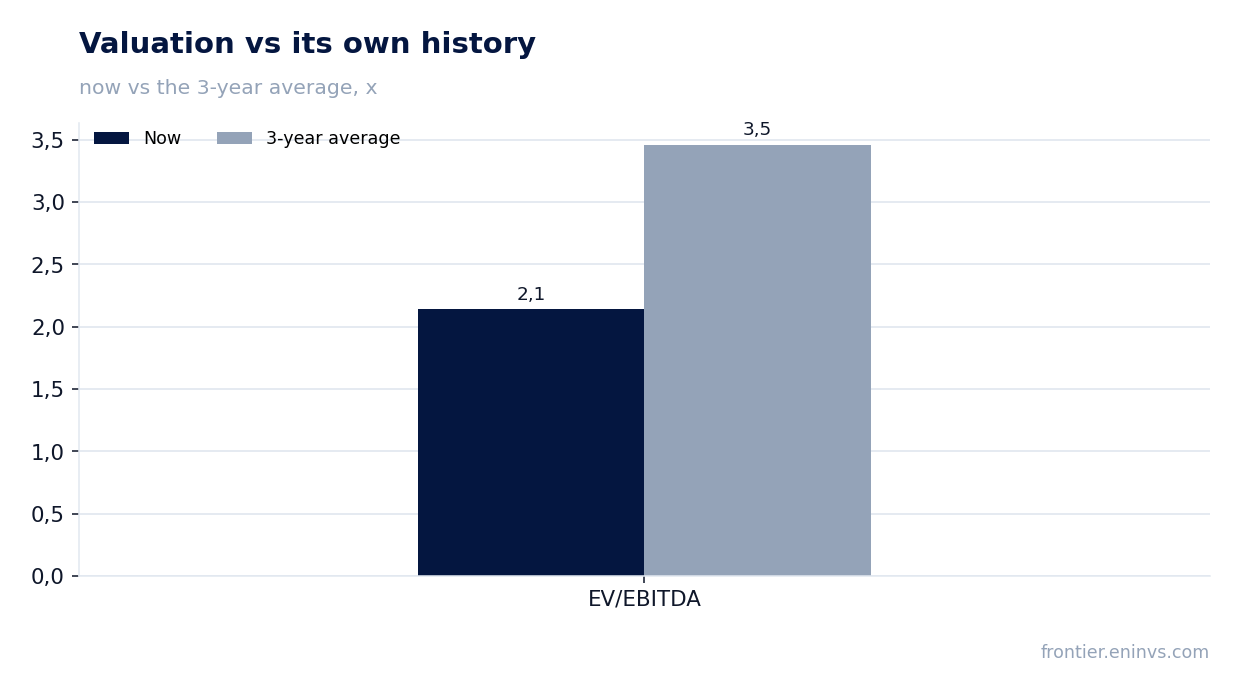
— LTM EV/EBITDA of 2.14 is below its own three-year average of 3.46
— The portal's model values the share 4% below fair value
Attractiveness
Key figures, USD bn
| Metric | Q2 2025 | Q2 2026 | Change |
|---|---|---|---|
| Revenue | 12.3 | 14.0 | +14.0% |
| EBITDA | 2.87 | 4.79 | +66.7% |
| Operating profit | 2.41 | 4.56 | +89.5% |
| Net profit | 1.82 | 2.80 | +53.9% |
| EBITDA margin | 23.3% | 34.1% | +10.8 pp |
| Net margin | 14.8% | 20.0% | +5.2 pp |
Revenue grew 14.0% year on year, but that is half the pace of the previous quarter
In the second quarter of 2026, Zijin Mining's revenue reached USD 14.0 bn, up 14.0% year on year. This marks a notable deceleration from the first quarter, when growth was 30.8%. The slowdown may reflect the high base of Q2 2025 as well as metal price dynamics, but the exact cause is not disclosed in the provided data.
The sequential comparison also shows a decline: revenue was USD 14.2 bn in Q1 2026 and USD 14.0 bn in Q2. A slight quarterly contraction alongside annual growth suggests the company is maintaining volumes but the pace of expansion has slowed.
For a mining company, such revenue dynamics are often tied to gold and copper prices as well as production volumes. These details are not disclosed in the report, so we limit ourselves to stating that growth remains double-digit but its speed has decreased.
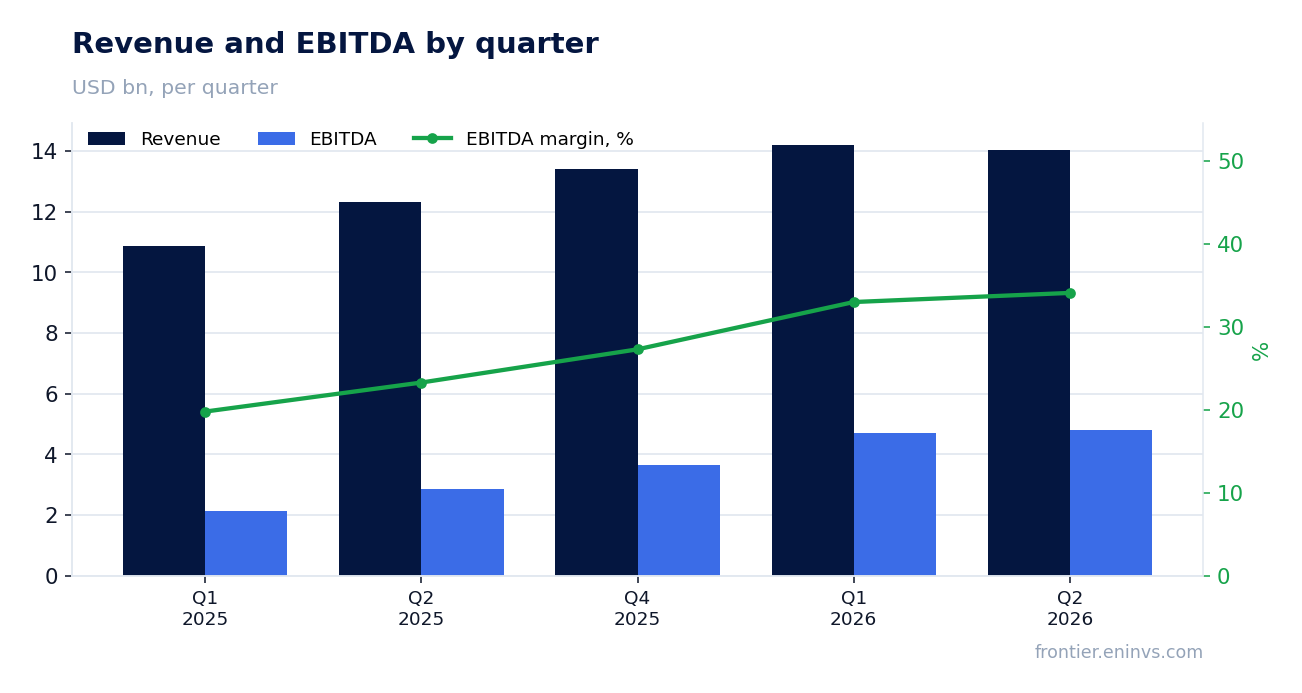
EBITDA rose 66.7%, lifting the margin to 34.1% from 23.3%
EBITDA in Q2 2026 reached USD 4.8 bn, up 66.7% year on year. The EBITDA margin rose to 34.1% from 23.3% in Q2 2025. Such margin expansion on relatively modest revenue growth points to significant operational efficiency gains or favourable pricing.
Operating profit also increased, from USD 2.4 bn a year earlier to USD 4.6 bn. This confirms that the margin improvement occurred at the operating level, not through one-off items below the operating line.
EBITDA growing almost twice as fast as revenue is the key positive of the report. However, the sustainability of this improvement depends on commodity prices and cost control, which are not detailed in the provided data.
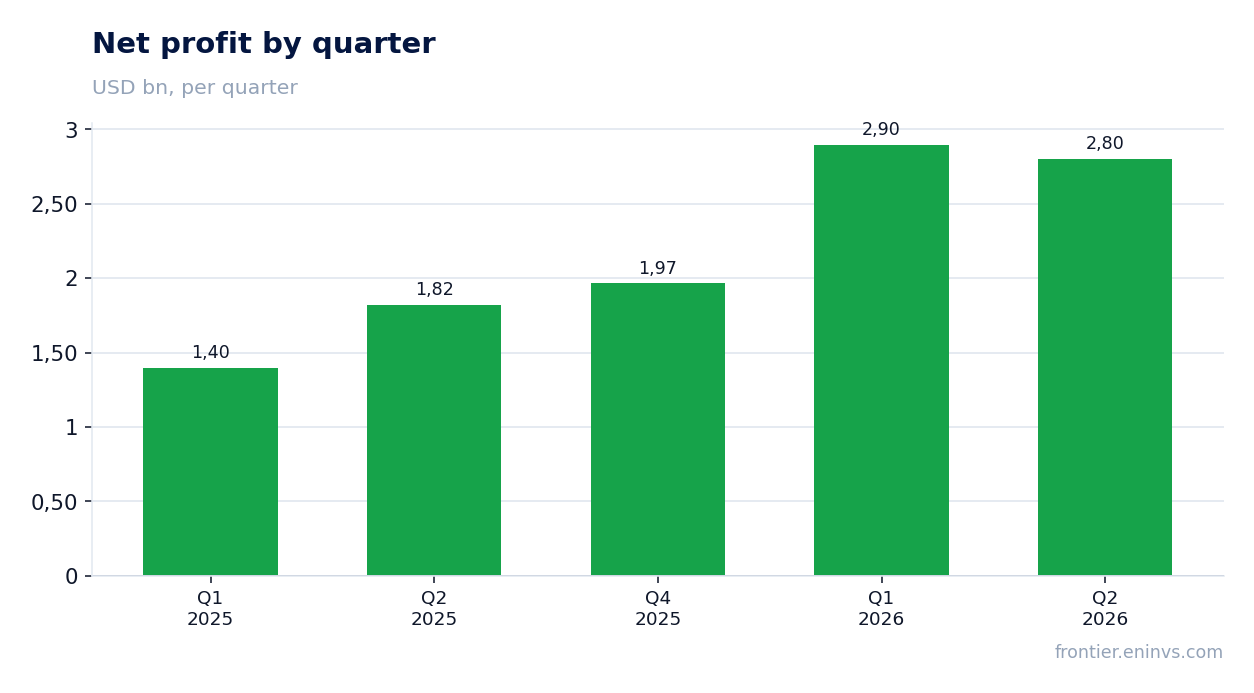
Net profit increased 53.9%, yet the quarterly level was lower than in the prior quarter
Net profit in Q2 2026 was USD 2.8 bn, up 53.9% from Q2 2025. The net margin rose to 20.0% from 14.8% a year earlier. This reflects both improved operating efficiency and possibly lower financial expenses amid debt reduction.
However, on a sequential basis profit declined: it was USD 2.9 bn in Q1 2026 and USD 2.8 bn in Q2. This divergence from the annual growth is explained by an exceptionally strong first quarter of 2026. Nevertheless, the sequential decline warrants attention.
One-off factors in profit are not disclosed. If profit growth was supported by asset sales or other non-operating income, the sustainability of the result may be lower. Such information is not available in the provided data.
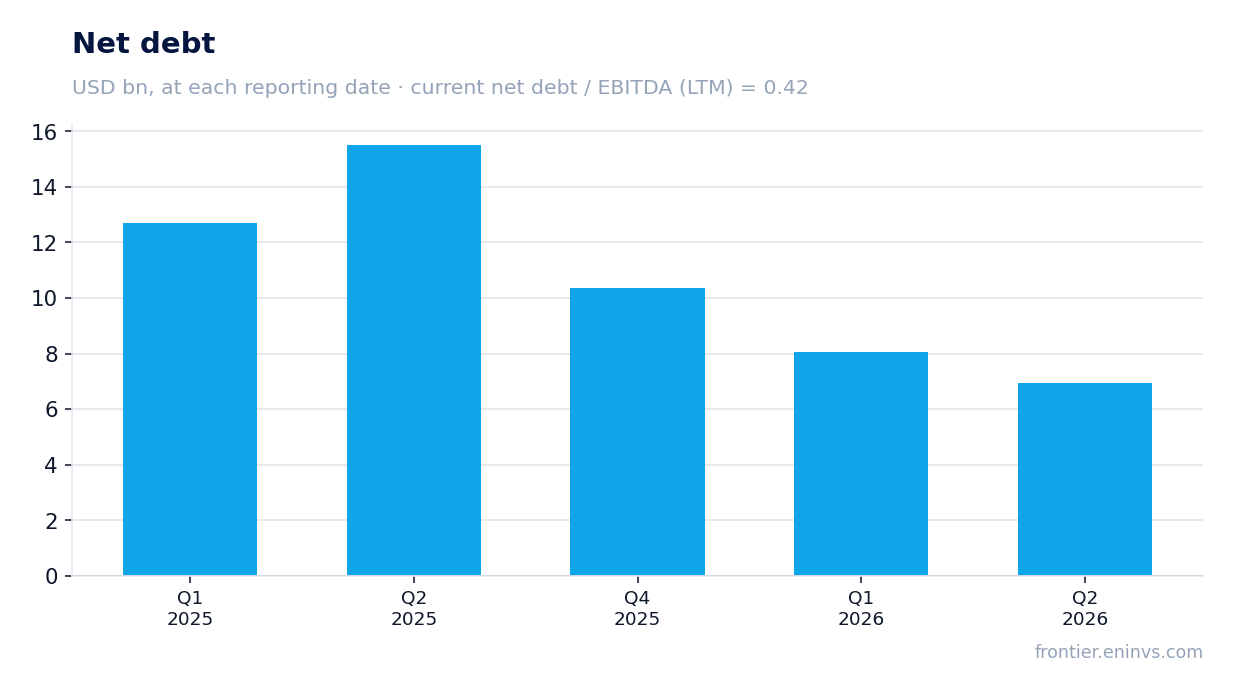
Net debt fell to USD 6.9 bn from USD 15.5 bn a year earlier
Net debt as of 30 June 2026 stood at USD 6.9 bn. A year earlier, on 30 June 2025, it was USD 15.5 bn, a reduction of USD 8.6 bn over 12 months. Compared with 31 March 2026, net debt decreased from USD 8.0 bn to USD 6.9 bn.
The net debt to LTM EBITDA ratio is 0.42. This is a low level, giving the company significant financial flexibility. However, the previous value of this ratio is not provided, so we cannot state whether leverage rose or fell — we only note the current level.
The debt reduction is likely linked to strong operating cash flow, but exact OCF and capex figures are absent from the provided data. Nevertheless, the net debt dynamics alone are a significant positive.
Dividend yield of 2.86% with a payout ratio still to be assessed
The trailing 12-month dividend yield is 2.86%. This is a moderate level that may be attractive relative to the current key rate, but without data on the payout ratio and the absolute dividend amount, it is difficult to assess the sustainability of payments.
Our estimate for the current year's dividend is based on LTM profit of USD 8.2 bn and the company's historical practice. If Zijin maintains a conservative approach to profit distribution, the dividend may remain close to the current level. However, without a confirmed dividend policy and data on one-off items in profit, this estimate remains preliminary.
What could make the payout smaller: lower metal prices, higher capital expenditures, or the need to allocate more funds to development projects. The provided data does not include information on the dividend policy, so we limit ourselves to stating the current yield.
LTM EV/EBITDA of 2.14 is below its own three-year average of 3.46
The LTM EV/EBITDA multiple is 2.14. This is significantly below its own three-year average of 3.46, indicating the stock is undervalued relative to its historical levels. The LTM P/E is 3.0, which also appears low.
Return on equity (ROE) reaches 37.7%, confirming high business efficiency. With such profitability and low debt, the current valuation may not fully reflect the company's fundamental value.
According to the portal's model, which reprices EBITDA at current commodity prices at the target EV/EBITDA, the fair value of the share is 4% below the market capitalisation. This means the market is already pricing in a fairly optimistic scenario, and upside potential is limited.
The portal's model values the share 4% below fair value
Our model, which reprices EBITDA at current commodity prices at the target EV/EBITDA, shows that the fair value of the share is 4% below the current market capitalisation. This suggests the market is already pricing in favourable pricing conditions.
Nevertheless, the LTM EV/EBITDA multiple of 2.14 is below its own three-year average of 3.46. If metal prices remain high and the company continues to reduce debt, the multiple could revert to historical levels, providing additional upside.
However, the portal's model is not a target price and reflects only the current scenario. For an investor, it is important to monitor revenue and margin dynamics in the next quarter, as well as gold and copper prices.
Valuation on the latest reported figures
| Metric | Value |
|---|---|
| Market cap | 24.6 bn USD |
| P/E (LTM) | 3.0 |
| EV/EBITDA (LTM) | 2.1 |
| P/B | 0.93 |
| Net debt / EBITDA (LTM) | 0.42 |
| ROE | 37.7% |
| Dividend yield (12m) | 2.9% |
| EV/EBITDA, 3-year average | 3.5 |
Bottom line
Bottom line: Zijin Mining delivered strong profit and margin growth, along with a significant reduction in debt. However, the deceleration in revenue and the sequential decline in net profit suggest that peak growth may be behind. The stock trades at an LTM EV/EBITDA of 2.14, below its own three-year average of 3.46, and offers a 2.86% dividend yield. According to the portal's model, fair value is 4% below the market, limiting upside potential. We view the stock as attractive at current levels due to its low valuation and high return on equity, but confirmation of revenue and profit sustainability in the next quarter is needed.
Open the company's financial profile ZIJIN →
See also: market overview · valuation map · stock screeners