ID_AADI: H1 profit up 10.5%, but quarterly revenue fell 10.3%

Today ID_AADI released its H1 2026 results. Half-year revenue rose 6.1% year-on-year, net profit – 10.5%, with a net margin of 18.6%. However, in the standalone first quarter of 2026, revenue declined 10.3% year-on-year. At the current price, the share looks attractive: EV/EBITDA LTM 5.10 versus a three-year average of 2.92, dividend yield 8.36%, and the portal model implies 35% upside to fair value.
Key takeaways
— Half-year revenue rose 6.1%, but quarterly revenue fell 10.3% – the gap is explained by the reporting calendar
— Net profit for H1 increased 10.5% with a margin of 18.6% versus 17.9% a year earlier
— Operating cash flow for H1 was $449.9 mn, but in Q1 it slowed sharply to $45.3 mn
— The company remains in a net cash position: net debt is negative at –$95.0 mn
— Dividend yield of 8.36% with a payout that may rise by year-end
— EV/EBITDA LTM 5.10 versus a three-year average of 2.92 – the stock trades above its own history
— The portal model implies 35% upside to fair value
Attractiveness
Key figures, USD bn
| Metric | H1 2025 | H1 2026 | Change |
|---|---|---|---|
| Revenue | 2.40 | 2.55 | +6.1% |
| Net profit | 0.43 | 0.47 | +10.5% |
| Operating cash flow | 0.54 | 0.45 | -17.0% |
| Capex | -0.15 | — | — |
| Net margin | 17.9% | 18.6% | +0.7 pp |
Half-year revenue rose 6.1%, but quarterly revenue fell 10.3% – the gap is explained by the reporting calendar
In H1 2026, ID_AADI's revenue reached $2,546.6 mn, up 6.1% from the same period last year. However, in the standalone first quarter of 2026, revenue declined 10.3% year-on-year to $1,044.2 mn. This discrepancy is explained by an unusually high revenue base in Q1 2025 – $1,164.4 mn – which created a difficult comparison.
The quarter-on-quarter dynamics show that in Q2 2026 revenue recovered: subtracting Q1 from the half-year, Q2 brought in about $1,502.4 mn. This is significantly higher than Q1 and indicates that the slowdown at the start of the year was temporary.
Nevertheless, half-year revenue is growing year-on-year, indicating continued demand for the company's products. It is important to monitor whether the positive trend persists in the second half, especially given the high base of H2 2025.
Net profit for H1 increased 10.5% with a margin of 18.6% versus 17.9% a year earlier
Net profit for H1 2026 was $473.8 mn, up 10.5% year-on-year. The net margin rose to 18.6% from 17.9% a year earlier. Profit growth outpacing revenue growth indicates better cost control.
In the standalone first quarter of 2026, net profit was $143.0 mn, down from $196.0 mn a year earlier. This decline mirrors the revenue dynamics and reflects weaker operating results at the start of the year.
The improvement in half-year profitability may be due to changes in sales mix or lower costs. Without additional data on profit components, it is difficult to identify one-off factors, but a sustainable margin increase is a positive signal.
Operating cash flow for H1 was $449.9 mn, but in Q1 it slowed sharply to $45.3 mn
Operating cash flow for H1 2026 was $449.9 mn. However, in the standalone first quarter of 2026, it was only $45.3 mn, significantly below $326.7 mn a year earlier. This sharp slowdown contrasts with the half-year profit growth.
Such weak operating cash flow in Q1 may be due to working capital increases or seasonal factors. In Q2, the flow likely recovered, as the half-year figure is much higher than the quarterly one.
Capex in Q1 2026 was $77.1 mn versus $71.3 mn a year earlier. Higher capex combined with lower operating cash flow resulted in negative free cash flow in Q1. This warrants attention but is not necessarily alarming if the Q2 recovery proves sustainable.
The company remains in a net cash position: net debt is negative at –$95.0 mn
As of the latest reporting date, ID_AADI's net debt was –$95.0 mn, meaning cash exceeds debt. This is a comfortable position that provides financial flexibility.
The net debt to EBITDA LTM ratio is –0.09. The negative value reflects the net cash position. Over the past 12 months, net debt has remained virtually unchanged, increasing by RUB 0.1 bn, which is insignificant.
Low leverage reduces risks and allows more funds to be directed toward dividends or investments. Combined with strong operating cash flow, this creates a solid foundation for shareholder payouts.
Dividend yield of 8.36% with a payout that may rise by year-end
ID_AADI's dividend yield over the trailing 12 months is 8.36%. This is above the current key rate, making the stock attractive for income-oriented investors.
The company has not disclosed the exact dividend for H1 2026, but given net profit of $473.8 mn and a payout ratio that can be estimated from past periods, the annual dividend could be substantial. Our estimate suggests that, with current profit and payout ratio maintained, the annual dividend could provide a yield of around 8–9%.
The main risks to the dividend are lower profit or higher capex. However, the net cash position and stable operating cash flow reduce the likelihood of a payout cut.
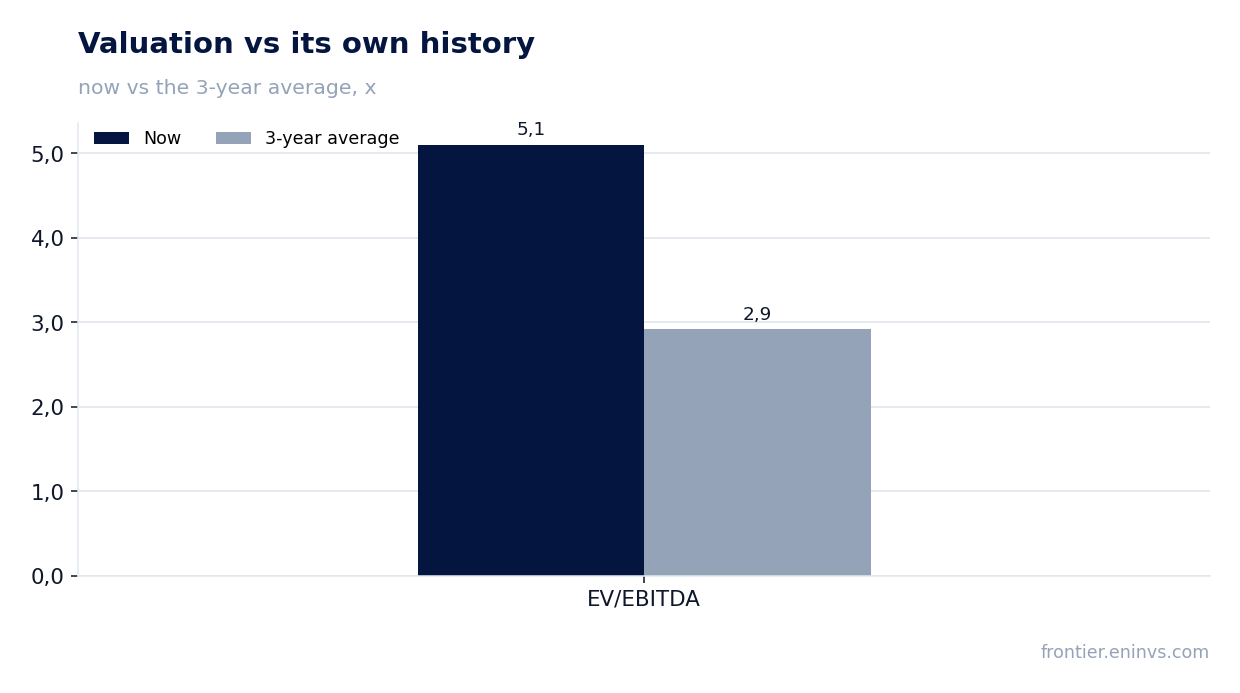
EV/EBITDA LTM 5.10 versus a three-year average of 2.92 – the stock trades above its own history
The current EV/EBITDA LTM multiple is 5.10. The three-year average of this multiple is 2.92. Thus, the stock trades above its historical norm, which may indicate overvaluation relative to past levels.
The P/E LTM multiple is 6.92. With a market capitalisation of $5,260.2 mn and LTM net profit of $760.2 mn, this reflects the current valuation. For a company with growing profit and a dividend yield of 8.36%, this P/E level appears moderate.
Comparison with history shows that the market currently values the company more highly than the three-year average. This may be justified by growth expectations, but it creates a risk of multiple contraction if results disappoint.
The portal model implies 35% upside to fair value
According to our model, which re-prices EBITDA at current commodity prices using a target EV/EBITDA, the fair value of ID_AADI shares is 35% above the current market price. This is our own calculation, not a consensus forecast.
The model incorporates current commodity prices and a target multiple that may differ from the current market multiple. If prices for the company's products remain at current levels and the multiple reverts to its historical average, the upside potential could be realised.
However, the model does not account for possible changes in operations or the macroeconomic environment. It serves as a guide for assessing the stock's attractiveness at the current level.
Valuation on the latest reported figures
| Metric | Value |
|---|---|
| Market cap | 5.26 bn USD |
| P/E (LTM) | 6.9 |
| EV/EBITDA (LTM) | 5.1 |
| P/B | 1.56 |
| Net debt / EBITDA (LTM) | -0.09 |
| Operating cash flow (LTM) | 0.86 bn |
| ROE | 24.6% |
| Dividend yield (12m) | 8.4% |
| EV/EBITDA, 3-year average | 2.9 |
Bottom line
ID_AADI delivered 6.1% half-year revenue growth and 10.5% net profit growth, improving its margin to 18.6%. However, quarterly revenue fell 10.3%, and operating cash flow in Q1 was weak. The company maintains a net cash position and a high dividend yield of 8.36%. The stock trades above its historical EV/EBITDA average, but the portal model implies 35% upside. Verdict: attractive for investors willing to tolerate quarterly volatility.
Open the company's financial profile AADI →
See also: market overview · valuation map · stock screeners