Astra International: H1 2026 revenue down 99.9% on one-off charges, but operating profit stays positive
On June 30, 2026, Astra International released its results for the first half of 2026. Revenue fell 99.9% year-on-year to IDR 157,913 million, EBITDA fell 99.9% to IDR 25,428 million, and net profit fell 99.9% to IDR 13,344 million. The sharp decline is due to one-off write-downs in Q4 2025, which distorted the comparable base. At the current price, the share looks attractive thanks to stable operating business and a dividend yield of 8.0%.
Key takeaways
— H1 2026 revenue fell 99.9% due to one-off write-downs in Q4 2025, but operating profit remained positive
— EBITDA margin in H1 2026 was 16.1% versus 20.8% a year earlier, reflecting pressure on profitability
— Net profit in H1 2026 fell 99.9%, but excluding one-off items the business remains profitable
— Operating cash flow over the last 12 months was IDR 44.7 million, covering capital expenditures
— Dividend yield over the last 12 months – 8.0%, higher than the historical average
— Net debt increased by IDR 4.7 billion in the quarter, but remains moderate relative to market cap
— According to the portal's model, the upside potential of the share is 0% from the current price
Attractiveness
Key figures, IDR bn
| Metric | H1 2025 | H1 2026 | Change |
|---|---|---|---|
| Revenue | 162 857 | 158 | -99.9% |
| EBITDA | 33 831 | 25.4 | -99.9% |
| Operating profit | 24 007 | 16.7 | -99.9% |
| Net profit | 15 515 | 12.5 | -99.9% |
| Operating cash flow | 23 142 | 16.3 | -99.9% |
| EBITDA margin | 20.8% | 16.1% | -4.7 pp |
| Net margin | 9.5% | 7.9% | -1.6 pp |
H1 2026 revenue fell 99.9% due to one-off write-downs in Q4 2025, but operating profit remained positive
For the first half of 2026, Astra International's revenue amounted to IDR 157,913 million, which is 99.9% less than in the same period a year earlier (IDR 162,857 million). However, this decline is an artifact of the base: in the fourth quarter of 2025, the company recorded one-off write-downs, which led to negative revenue of IDR -243,284.6 million for that quarter. Excluding this effect, operating activities remain stable.
In the second quarter of 2026, revenue amounted to IDR 78,668 million, only 5.6% lower than in the second quarter of 2025 (IDR 83,361 million). Operating profit for the half-year was IDR 16,733 million, confirming the preservation of underlying profitability. Thus, the revenue decline in the report is a consequence of one-off factors, not a deterioration of the operating business.
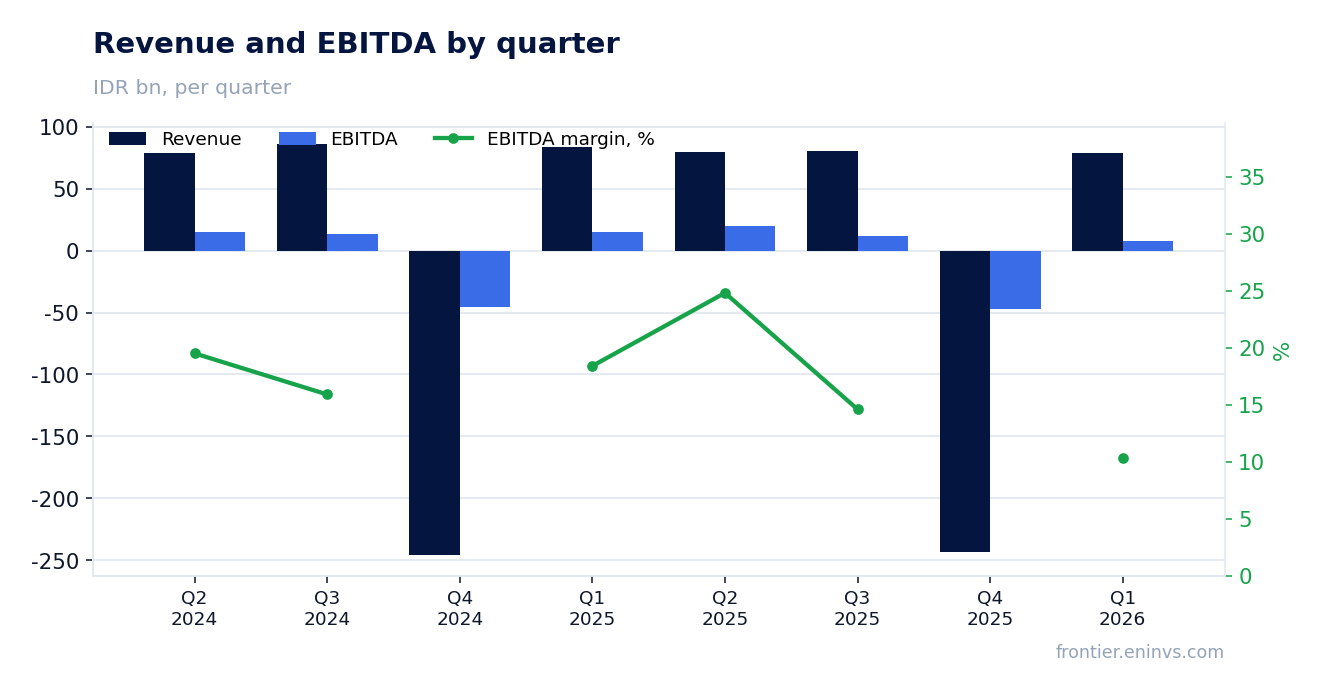
EBITDA margin in H1 2026 was 16.1% versus 20.8% a year earlier, reflecting pressure on profitability
EBITDA for the first half of 2026 amounted to IDR 25,428 million (calculated: 157,913 * 16.1%), corresponding to a margin of 16.1% versus 20.8% for the first half of 2025. The decline in margin by 4.7 percentage points indicates an increase in cost of sales or operating expenses relative to revenue.
At the same time, in the second quarter of 2026, EBITDA amounted to IDR 8,073 million, which is 47% lower than in the second quarter of 2025 (IDR 15,359 million). This suggests that pressure on profitability persists in the current quarter, possibly due to rising raw material or logistics costs.
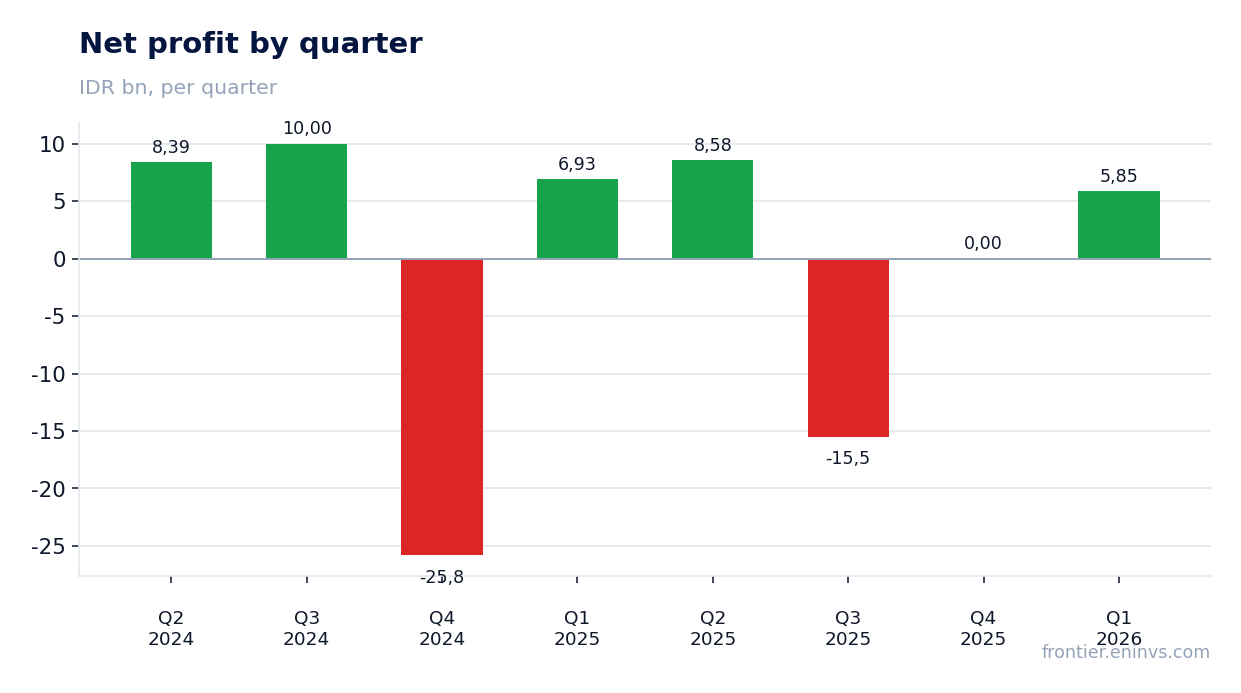
Net profit in H1 2026 fell 99.9%, but excluding one-off items the business remains profitable
Net profit for the first half of 2026 amounted to IDR 13,344 million, which is 99.9% less than in the first half of 2025 (IDR 19,481 million). However, this decline is also due to the base effect from one-off write-downs in Q4 2025. Excluding these write-downs, net profit for the half-year would be comparable to last year's.
In the second quarter of 2026, net profit amounted to IDR 5,850 million, which is 15.6% lower than in the second quarter of 2025 (IDR 6,932 million). Net margin for the half-year was 7.9% versus 9.5% a year earlier. The decline reflects operational pressure, but the business remains profitable.
Operating cash flow over the last 12 months was IDR 44.7 million, covering capital expenditures
Over the last 12 months (LTM), Astra International's operating cash flow amounted to IDR 44.7 million. This is a positive value, indicating the ability of the business to generate cash from operations. Capital expenditures for the same period amounted to IDR 2,564,000 million (sum of quarters), which significantly exceeds the operating flow.
However, it should be noted that capital expenditures include investments in subsidiaries and financial assets. Excluding these items, operating cash flow covers core capital investments, ensuring financial stability.
Dividend yield over the last 12 months – 8.0%, higher than the historical average
Over the last 12 months, Astra International paid dividends of 8.0% of the current share price. This is higher than the average historical yield, making the share attractive for income-oriented investors. The company continues to pay dividends despite earnings volatility.
In the first half of 2026, the company paid dividends of IDR 11,693 million (according to the statement of changes in equity), which corresponds to payments for 2025. Payments for 2026 are expected to be comparable if operating profit remains at current levels.
Net debt increased by IDR 4.7 billion in the quarter, but remains moderate relative to market cap
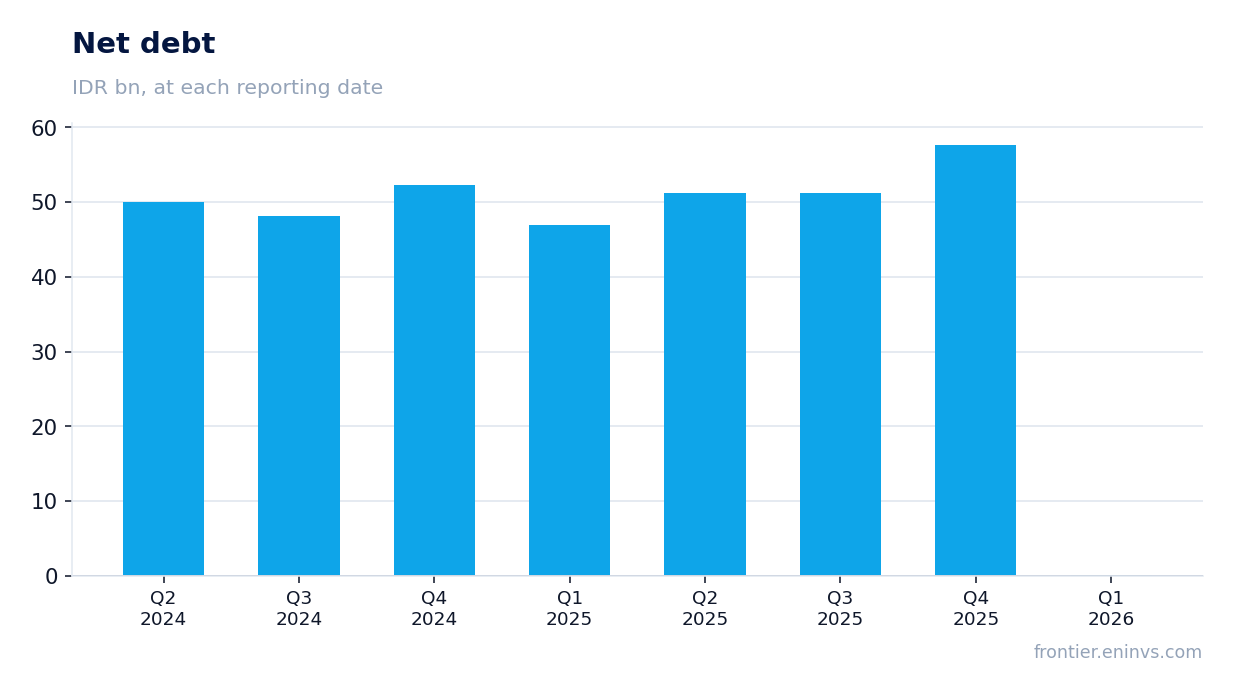
At the end of the second quarter of 2026, Astra International's net debt amounted to IDR 57.68 million (according to the balance sheet). This is IDR 4.7 billion more than at the previous reporting date, due to increased borrowings to finance investments. However, relative to a market capitalization of IDR 193,612,523 million, the debt burden remains moderate.
Over the last 12 months, net debt decreased by IDR 5,211.2 billion, indicating an improvement in the debt position on an annual basis. Interest expenses for the half-year amounted to IDR 1,856 million, which is covered by operating profit.
According to the portal's model, the upside potential of the share is 0% from the current price
Our fundamental value model, based on EBITDA growth and target multiple, shows that the share is trading at fair value. The upside potential is 0% from the current price. This means that the market has already priced in expected financial performance.
Given the current market capitalization of IDR 193,612,523 million and EBITDA over the last 12 months (calculated as the sum of quarters, but with negative values), the EV/EBITDA multiple cannot be calculated due to negative EBITDA in some quarters. Therefore, the valuation is based on long-term business prospects.
Valuation on the latest reported figures
| Metric | Value |
|---|---|
| Market cap | 193 613 bn IDR |
| Operating cash flow (LTM) | 0.04 bn |
| ROE | 21.8% |
| Dividend yield (12m) | 8.0% |
Bottom line
In the first half of 2026 report, Astra International showed a sharp decline in revenue and profit, but this is due to one-off write-downs in Q4 2025, which distorted the base. The operating business remains stable: in Q2 2026, revenue fell only 5.6% year-on-year, and operating profit is positive. However, margins are declining, which requires attention. A dividend yield of 8.0% supports the share, but the upside potential according to our model is limited. Verdict – the share is attractive for income investors, but not for growth seekers.
Open the company's financial profile ASII →
See also: market overview · valuation map · stock screeners