ID_INCO: H1 profit grew 4.1x while cash flow lagged

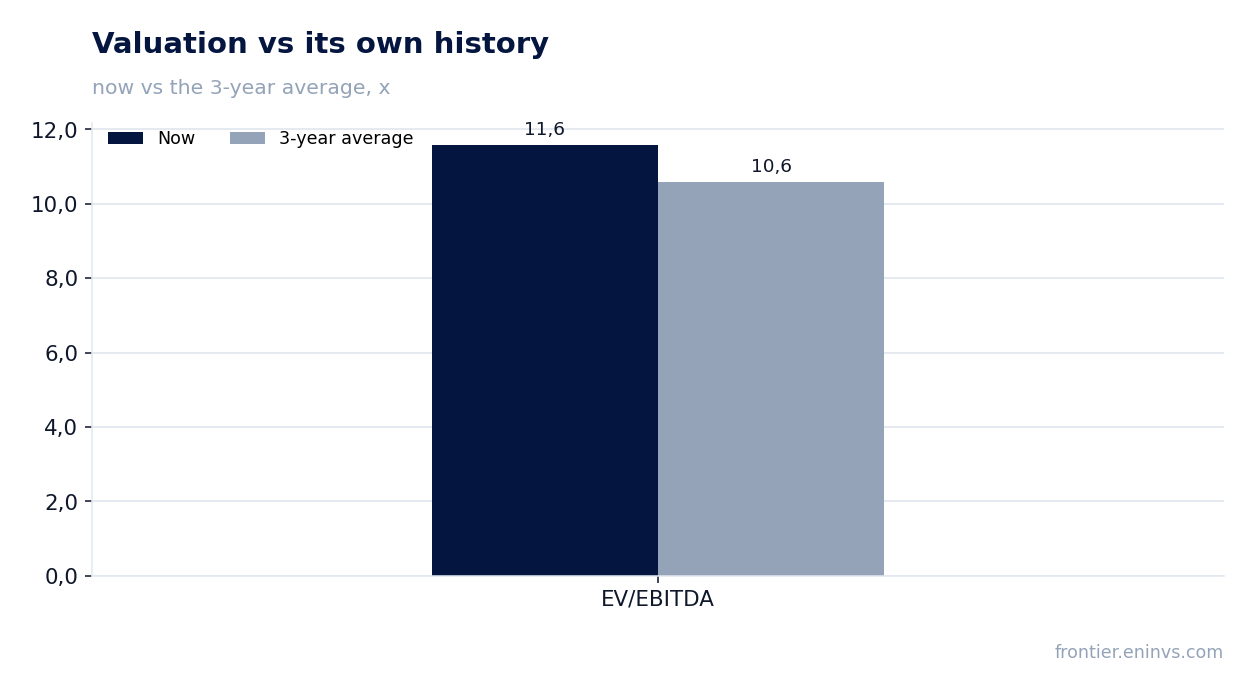
The H1 2026 report showed revenue of $543.1 million and net profit of $104.4 million. Net margin rose to 19.2% from 5.9% a year earlier, with profit up 313.4%. Operating cash flow was only $38.4 million, well below net profit. At the current price the stock trades at 18.2x trailing earnings and 11.6x trailing EBITDA, above its own three-year average EV/EBITDA of 10.6x, while the portal model implies -66% upside to fair value – so the share looks rather unattractive.
Key takeaways
— H1 revenue grew 27.3%, but Q2 growth slowed to 22.3%
— Net profit grew 4.1x, with margin rising to 19.2% from 5.9%
— Operating cash flow of $38.4 million is 2.7x smaller than net profit
— The company sits on a net cash cushion of $372.9 million
— Trailing 12-month dividend yield is 1.6%
— EV/EBITDA of 11.6 is above its own three-year average of 10.6
— The portal model points to -66% versus fair value
Attractiveness
Key figures, USD bn
| Metric | H1 2025 | H1 2026 | Change |
|---|---|---|---|
| Revenue | 0.43 | 0.54 | +27.3% |
| EBITDA | 0.09 | — | — |
| Operating profit | 0.01 | — | — |
| Net profit | 0.03 | 0.10 | +313.4% |
| Operating cash flow | 0.09 | 0.04 | -58.8% |
| EBITDA margin | 21.2% | — | — |
| Net margin | 5.9% | 19.2% | +13.3 pp |
H1 revenue grew 27.3%, but Q2 growth slowed to 22.3%
In H1 2026, revenue reached $543.1 million, up 27.3% from the same period a year earlier. The growth was driven by higher sales volumes, although the report does not provide a segment breakdown.
In Q2 2026, revenue amounted to $252.7 million, up 22.3% year-on-year. This is below the half-year average, indicating a slowdown compared to Q1 2026, when growth was also 22.3% (quarterly data).
The slowdown in quarterly growth relative to the half-year figure may be due to the base effect: H1 2025 revenue was lower, which provided a higher percentage growth for the full period. Nevertheless, the company continues to grow revenue at a double-digit pace.
Net profit grew 4.1x, with margin rising to 19.2% from 5.9%
Net profit for H1 2026 was $104.4 million, 4.1 times higher than in the same period last year. Net margin rose to 19.2% from 5.9% a year earlier.
Such a sharp profit increase, with revenue growing only 27.3%, is explained by significantly better cost control. The company likely reduced operating expenses or received one-off income, but the report does not provide details.
In Q2 2026, net profit was $43.6 million, also higher than in Q1 2025 ($21.8 million). This confirms the sustainability of the profitability improvement.
Operating cash flow of $38.4 million is 2.7x smaller than net profit
Operating cash flow for H1 2026 was $38.4 million, 2.7 times less than net profit. This gap indicates that a significant portion of profit is not converting into cash.
In Q2 2026, operating cash flow was negative at -$17.6 million. This contrasts sharply with positive flow in Q1 2025 ($55.7 million), possibly due to working capital increases or seasonal factors.
The gap between profit and cash flow is a key risk in the report. If the company cannot improve cash conversion, it may limit its ability to fund investments or pay dividends.
The company sits on a net cash cushion of $372.9 million
Net debt at the latest reporting date is negative at -$372.9 million, meaning the company has more cash than debt. This provides financial stability and investment capacity.
The net debt to EBITDA ratio for the trailing twelve months is also negative at -1.76. This means the company could repay all debt using its cash cushion.
However, the change in net debt versus the previous reporting date was plus 0.1 billion rubles, and over 12 months plus 0.3 billion rubles. This indicates some increase in debt, but in absolute terms it remains negative.
Trailing 12-month dividend yield is 1.6%
The trailing 12-month dividend yield is 1.6%. This is a modest level that may not appeal to income-oriented investors.
At the current share price and trailing 12-month profit ($155.2 million), the dividend payout ratio remains low. The company prefers to reinvest profits or accumulate cash.
Given negative net debt and high profit, the company has potential to increase dividends, but the current yield is not a key attractiveness factor for the stock.
EV/EBITDA of 11.6 is above its own three-year average of 10.6
The current trailing 12-month EV/EBITDA is 11.6, above its own three-year average of 10.6. This indicates the stock is more expensive than usual relative to its history.
The trailing 12-month P/E is 18.2. Trailing 12-month profit was $155.2 million, and EBITDA was $211.5 million.
The premium to the historical multiple may be justified by growth expectations, but current revenue growth is slowing, posing a risk of valuation correction.
The portal model points to -66% versus fair value
According to the portal model, the fair value of the share is 66% below the current market price. This is our own calculation based on re-pricing EBITDA at current commodity prices and the target EV/EBITDA.
The company's market capitalisation is $2,824.2 million. EV/EBITDA of 11.6 is above the historical average, confirming overvaluation.
The portal model is not a consensus forecast, but it signals a significant downside risk. For investors, this is an important argument for caution.
Valuation on the latest reported figures
| Metric | Value |
|---|---|
| Market cap | 2.82 bn USD |
| P/E (LTM) | 18.2 |
| EV/EBITDA (LTM) | 11.6 |
| P/B | 1.02 |
| Net debt / EBITDA (LTM) | -1.76 |
| Operating cash flow (LTM) | 0.23 bn |
| ROE | 7.4% |
| Dividend yield (12m) | 1.6% |
| EV/EBITDA, 3-year average | 10.6 |
Bottom line
The H1 2026 report showed strong profit and margin growth, but the quality of these results is questionable: cash flow significantly lags profit, and revenue growth is slowing. The company maintains a net cash cushion, reducing financial risks, but the dividend yield remains low. Valuation by EV/EBITDA is above its own history, and the portal model points to significant downside. At the current price, the share looks rather unattractive.
Open the company's financial profile INCO →
See also: market overview · valuation map · stock screeners