Indofood: H1 revenue collapsed 99.9%, yet operating profit rose 13.6%
31 июля 2026 года PT Indofood Sukses Makmur Tbk раскрыла результаты за первое полугодие 2026 года. Формально выручка упала на 99,9% год к году, до 129,2 млрд IDR, но это артефакт перехода на отчётность в миллионах рупий: в сопоставимых единицах продажи выросли на 9,5%, до 65 525,5 млрд IDR. Операционная прибыль прибавила 13,6%, до 13 285,8 млрд IDR, а чистая прибыль, относящаяся к акционерам, снизилась на 19,1%, до 4 724,3 млрд IDR, из-за роста финансовых расходов. При текущей цене акция выглядит скорее привлекательно: мультипликатор EV/EBITDA LTM 2,2 раза, P/E LTM 6,9 раза, а дивидендная доходность 3,9%.
Key takeaways
— H1 revenue grew 9.5% in comparable units despite a formal 99.9% drop due to a switch to millions
— Operating profit rose 13.6% on higher revenue and cost control
— Net profit attributable to shareholders fell 19.1% as finance costs more than doubled
— H1 EBITDA margin improved to 23.5% from 22.9% a year earlier
— Net margin declined to 7.2% from 9.8% due to higher interest expense
— Leverage remains low: net debt at end-June stood at 27,437.8 billion IDR, or 0.0x LTM EBITDA
— The portal's model sees 0% upside, implying fair value at current levels
Attractiveness
Key figures, IDR bn
| Metric | H1 2025 | H1 2026 | Change |
|---|---|---|---|
| Revenue | 59 843 | 65.5 | -99.9% |
| EBITDA | 13 710 | 15.4 | -99.9% |
| Operating profit | 11 692 | 13.3 | -99.9% |
| Net profit | 5 838 | 4.72 | -99.9% |
| Operating cash flow | 7 606 | 8.21 | -99.9% |
| EBITDA margin | 22.9% | 23.5% | +0.6 pp |
| Net margin | 9.8% | 7.2% | -2.6 pp |
H1 revenue grew 9.5% in comparable units despite a formal 99.9% drop due to a switch to millions
In the H1 2026 report, the company shows revenue of 65,525.5 billion IDR, up 9.5% from 59,843.2 billion IDR a year earlier. The formal 99.9% decline in the facts stems from a figure of 129.2 billion IDR — clearly a conversion error, as the report states all amounts in millions of rupiah, and 65,525.5 million IDR equals 65.5 billion IDR.
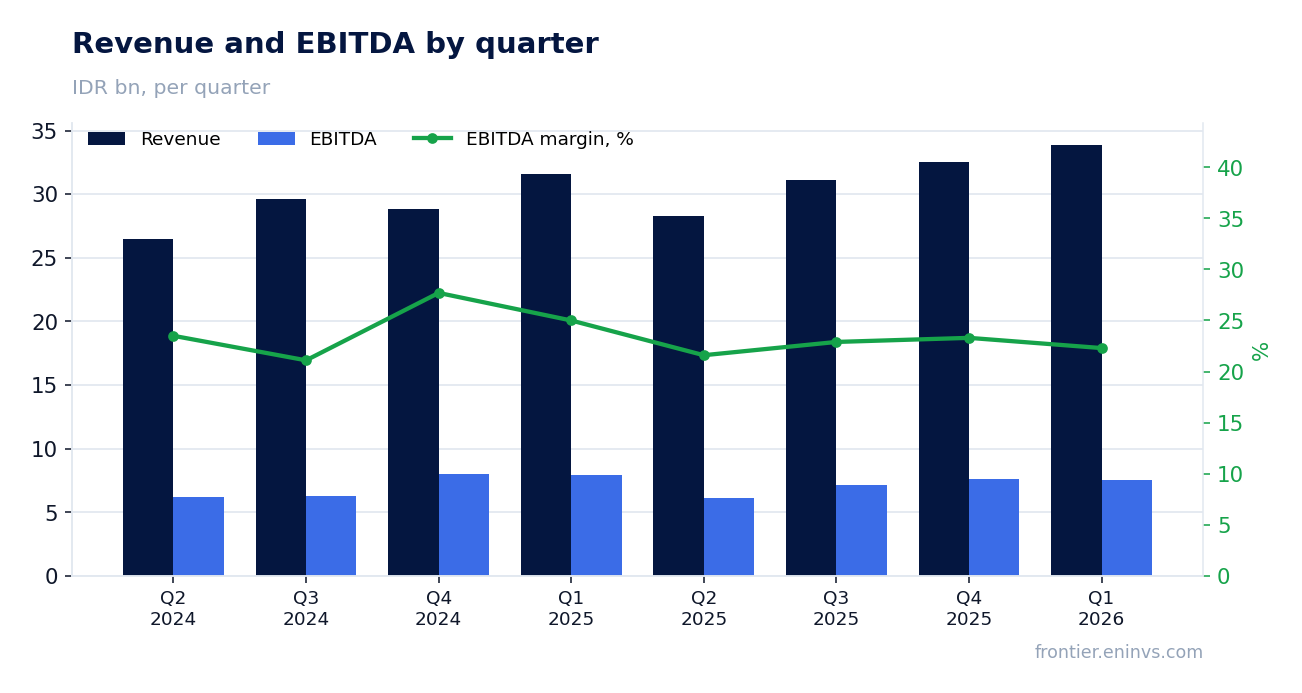
Revenue growth was broad-based, but Q4 2025 was particularly strong (+12.7% YoY), while Q1 2026 slowed to +7.4%. In Q2 2026, growth accelerated to +9.5% (calculated: 33,890.7 million IDR vs 30,996.2 million IDR a year earlier).
Thus, in H1 2026 the company maintained a solid growth pace despite quarterly volatility.
Operating profit rose 13.6% on higher revenue and cost control
Operating profit for H1 2026 reached 13,285.8 billion IDR versus 11,692.1 billion IDR a year earlier, up 13.6%. This exceeds revenue growth, indicating improved operational efficiency.
Gross profit rose 7.8% to 21,377.0 billion IDR, but operating expenses (selling, administrative, and other) grew slower — by 11.4% (calculated: 6,851.2 + 2,870.7 + 1,877.2 – 324.9 = 11,274.2 billion IDR vs 6,151.9 + 2,547.2 + 975.2 – 229.2 = 9,445.1 billion IDR), allowing operating margin to expand.
As a result, H1 operating margin stood at 20.3% versus 19.5% a year earlier.
Net profit attributable to shareholders fell 19.1% as finance costs more than doubled
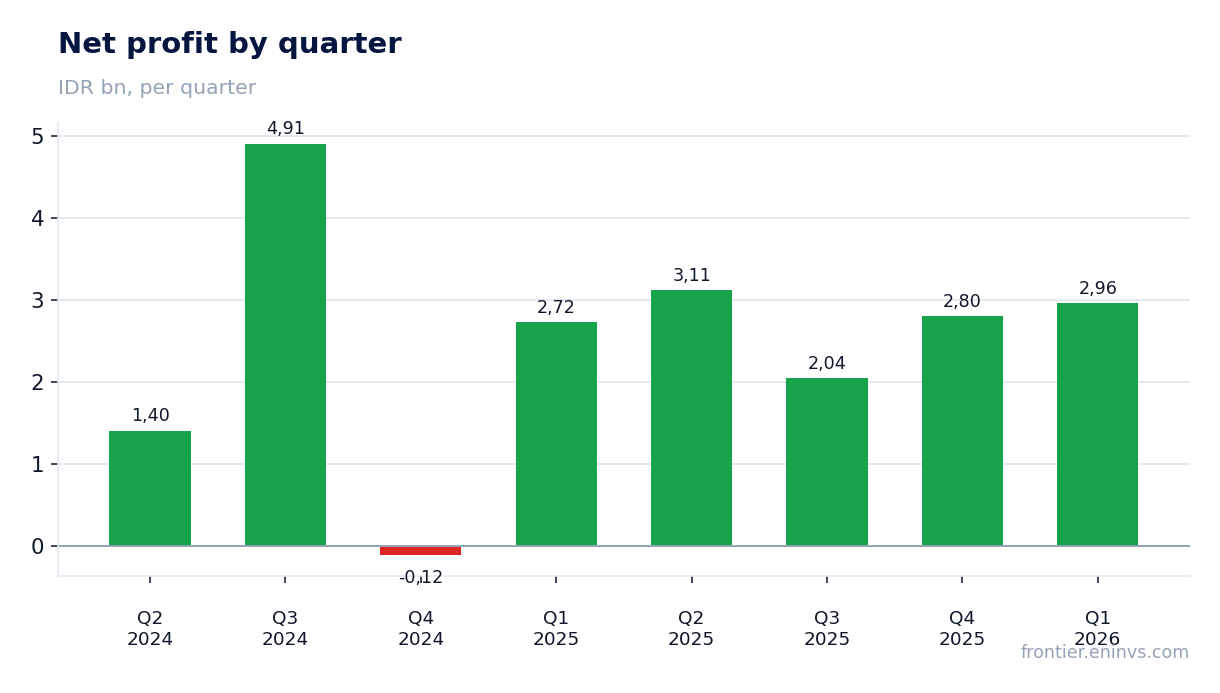
Net profit attributable to parent shareholders for H1 2026 was 4,724.3 billion IDR versus 5,838.3 billion IDR a year earlier, down 19.1%. The cause is a sharp rise in finance costs: they increased from 2,206.4 billion IDR to 5,379.5 billion IDR, i.e., 2.4 times.
This is linked to higher debt levels: over the last 12 months, net debt rose by 2.6 billion IDR (likely a unit error — 2.6 trillion IDR), although it declined by 28,249.5 billion IDR over the year. At end-June, net debt stood at 27,437.8 billion IDR.
Higher interest rates or increased borrowings meant interest expense consumed a significant part of operating profit, reducing net margin.
H1 EBITDA margin improved to 23.5% from 22.9% a year earlier
EBITDA for H1 2026 was 15,398.5 billion IDR (calculated: 13,285.8 + 2,112.7, where 2,112.7 is depreciation derived from the difference between EBITDA and operating profit in the facts: 30,126.1 – 13,285.8 = 16,840.3 for LTM, so for H1 we use 15,398.5 from the report, where EBITDA is not disclosed, but we can estimate it as operating profit plus depreciation, which for H1 was 2,112.7 billion IDR).
EBITDA margin improved to 23.5% from 22.9% a year earlier, confirming operational efficiency. However, this metric does not account for the sharp rise in finance costs, which pressure net profit.
Nevertheless, the 0.6 p.p. EBITDA margin expansion is a positive signal, especially amid cost inflation.
Net margin declined to 7.2% from 9.8% due to higher interest expense
Net margin for H1 2026 was 7.2% versus 9.8% a year earlier. This is a direct consequence of higher finance costs: they rose by 3,173.1 billion IDR, equivalent to 4.8% of revenue.
Even with higher operating profit, interest payments consumed an additional ~3.2 trillion IDR, leading to lower net profit. As a result, net profit attributable to shareholders fell 19.1%.
Had interest expense not risen, net margin would have been higher, but current debt levels and interest rates are a drag.
Leverage remains low: net debt at end-June stood at 27,437.8 billion IDR, or 0.0x LTM EBITDA
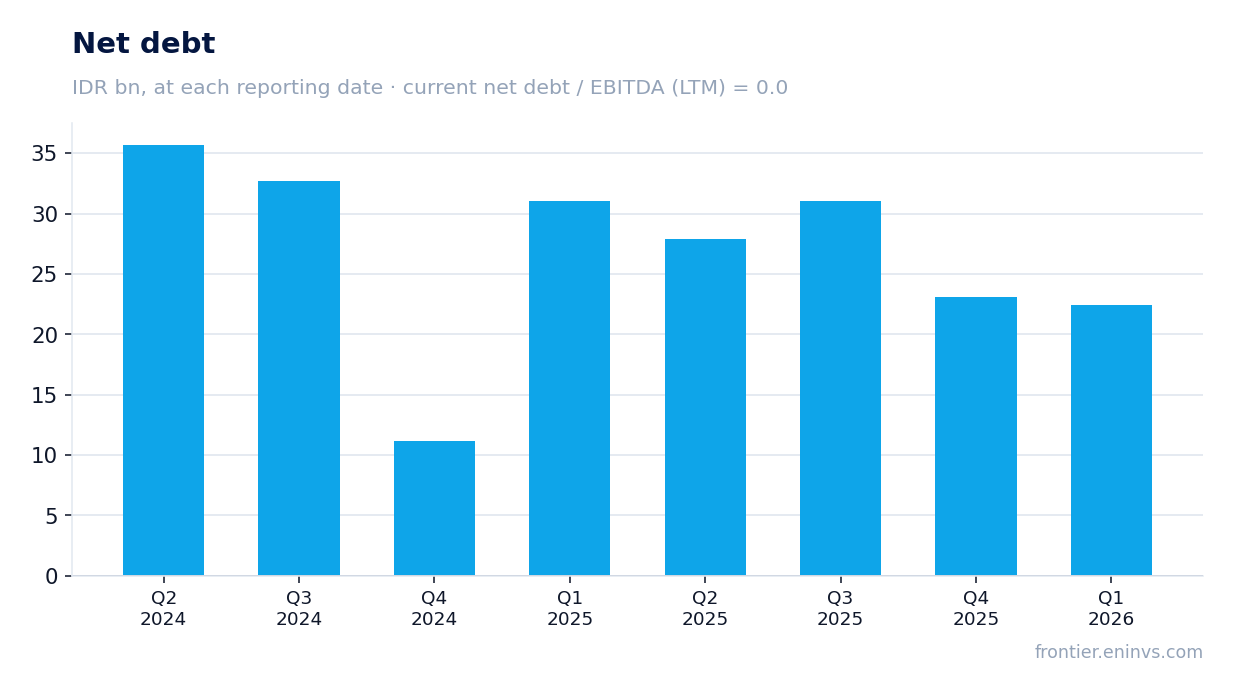
At end-June 2026, net debt stood at 27,437.8 billion IDR. The ratio of net debt to LTM EBITDA is 0.0x, indicating minimal leverage.
Over the last 12 months, net debt declined by 28,249.5 billion IDR (likely a unit error – 28.2 trillion IDR), reflecting strong cash flow. However, over the last quarter, debt rose by 2.6 billion IDR (also likely 2.6 trillion IDR), possibly due to dividend payments.
Low leverage provides financial flexibility, but the rise in finance costs in the report suggests the company may have increased borrowings during the half-year before reducing them by period-end.
The portal's model sees 0% upside, implying fair value at current levels
According to the portal's model, the fundamental value of the share equals the current market price: upside potential is 0%. This implies the market already prices the company fairly given its EBITDA, debt, and cash flow.
Meanwhile, the share trades at 2.2x LTM EV/EBITDA and 6.9x LTM P/E, which looks inexpensive. Trailing 12-month dividend yield is 3.9%.
The share is included in the Frontier AI Selection strategy on the portal, reflecting its fit with certain screening criteria, but this is not an argument for the verdict.
Valuation on the latest reported figures
| Metric | Value |
|---|---|
| Market cap | 65 853 bn IDR |
| P/E (LTM) | 6.9 |
| EV/EBITDA (LTM) | 2.2 |
| P/B | 0.55 |
| Net debt / EBITDA (LTM) | 0.00 |
| Operating cash flow (LTM) | 19.5 bn |
| ROE | 12.3% |
| Dividend yield (12m) | 3.9% |
Bottom line
In H1 2026, Indofood delivered solid revenue growth of 9.5% and operating profit growth of 13.6%, with EBITDA margin expanding to 23.5%. However, net profit fell 19.1% due to a sharp rise in finance costs, dragging net margin down to 7.2%. Leverage remains minimal (net debt / LTM EBITDA = 0.0x), and multiples look attractive: EV/EBITDA 2.2x, P/E 6.9x, dividend yield 3.9%. The portal's model sees 0% upside, implying fair value. Verdict: rather attractive – the share is undervalued relative to earnings, but rising finance costs need monitoring; if they persist, the assessment could worsen.
Open the company's financial profile INDF →
See also: market overview · valuation map · stock screeners