ID_ITMG: profit grows faster than revenue, but cash flow lags by half
The H1 2026 report showed revenue of $1,000.5 million and net profit of $106.0 million. Year-on-year growth was 8.8% for revenue and 16.5% for profit, with the margin rising to 10.6% from 9.9%. Operating cash flow for the half-year was only $62.4 million, half of net profit. With a P/E LTM of 8.56 and a dividend yield of 6.61%, the share looks rather attractive, but the gap between profit and cash is the main question for the report.
Key takeaways
— H1 2026 revenue grew 8.8% year-on-year to $1,000.5 million, but standalone Q2 growth slowed to 3.1%
— Net profit rose 16.5% year-on-year to $106.0 million, with the margin up to 10.6% from 9.9%
— Operating cash flow for the half-year was $62.4 million, half of net profit
— Dividend yield over the trailing 12 months is 6.61%, above the current key rate
— P/E LTM of 8.56 is below the three-year average, making the valuation attractive
— On the portal's model, the upside to fair value is -1%, meaning the market already prices in current commodity prices
Attractiveness
Key figures, USD bn
| Metric | H1 2025 | H1 2026 | Change |
|---|---|---|---|
| Revenue | 0.92 | 1.00 | +8.8% |
| Net profit | 0.09 | 0.11 | +16.5% |
| Operating cash flow | 0.28 | 0.06 | -77.8% |
| Net margin | 9.9% | 10.6% | +0.7 pp |
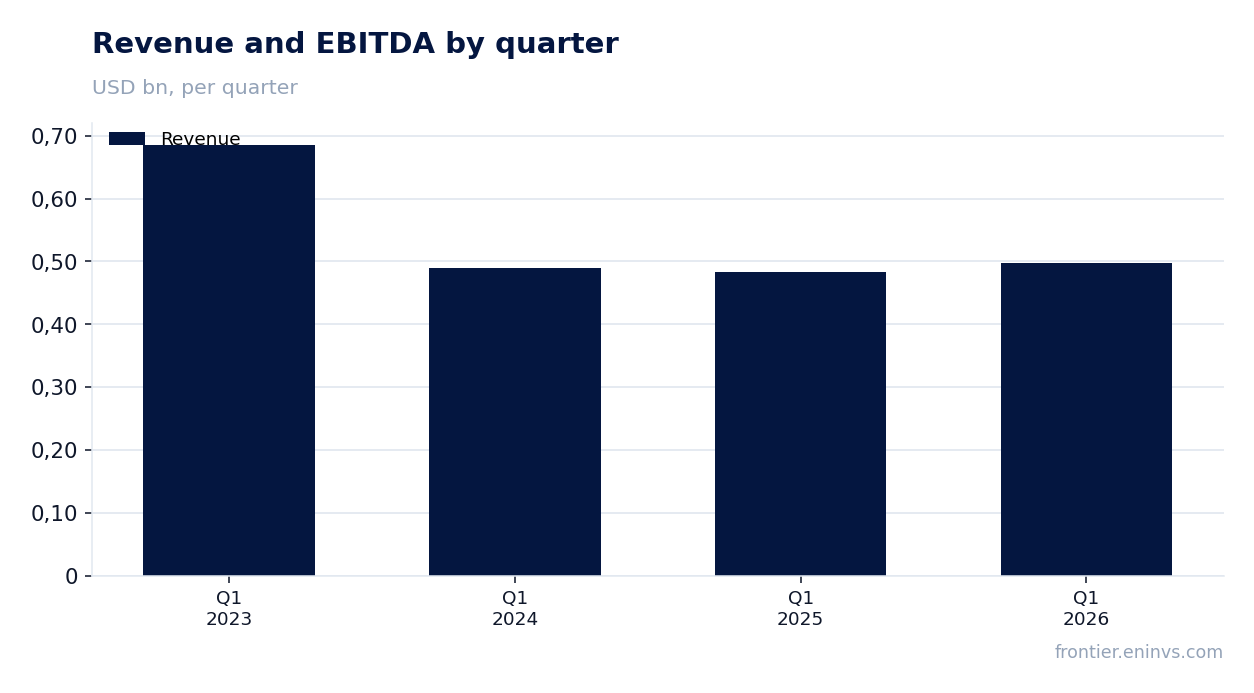
H1 2026 revenue grew 8.8% year-on-year to $1,000.5 million, but standalone Q2 growth slowed to 3.1%
In H1 2026, revenue reached $1,000.5 million, up 8.8% from the same period last year. The growth was mainly driven by higher sales volumes, although the exact drivers are not disclosed in the report.
In standalone Q2 2026, revenue was $497.6 million, up only 3.1% year-on-year. This is noticeably slower than the half-year figure, indicating a weakening dynamic in Q2 compared to Q1.
For comparison, Q1 2026 revenue was $497.6 million, also up 3.1% year-on-year. Thus, quarterly dynamics remain weak, and the half-year growth is largely due to the first quarter.
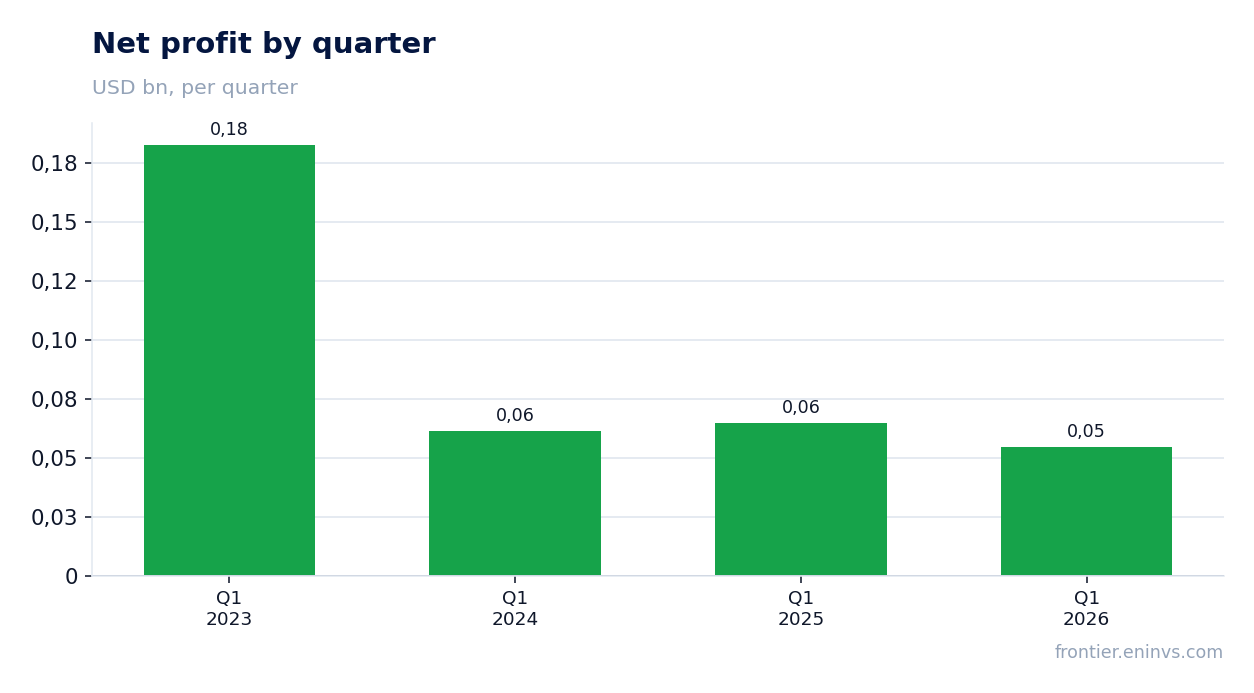
Net profit rose 16.5% year-on-year to $106.0 million, with the margin up to 10.6% from 9.9%
Net profit for H1 2026 was $106.0 million, up 16.5% year-on-year. The net margin rose to 10.6% from 9.9% a year earlier.
The faster growth in profit compared to revenue is explained by improved operational efficiency: revenue growth (+8.8%) is lower than profit growth (+16.5%). This means the company managed to reduce relative costs or improve its sales mix.
In standalone Q2 2026, net profit was $54.7 million, down 15.8% from Q2 2025 ($64.97 million). This divergence from the half-year trend is due to a weaker second quarter compared to the first.
Operating cash flow for the half-year was $62.4 million, half of net profit
Operating cash flow for H1 2026 was $62.4 million, significantly below net profit of $106.0 million. This indicates that profit is not fully converting into cash.
The gap may be due to an increase in working capital, such as higher receivables or inventories, but the exact reasons are not disclosed. In any case, the ability to generate cash flow remains a key question.
For comparison, in Q1 2026 operating cash flow was $65.3 million, which exceeds the half-year figure, implying that Q2 cash flow was negative or close to zero. This is a warning signal that requires explanation.
Dividend yield over the trailing 12 months is 6.61%, above the current key rate
The dividend yield over the trailing 12 months is 6.61%, which exceeds the current key rate. This makes the share attractive for income-oriented investors.
The company did not disclose the size of the last dividend and the year for which it was paid, so we cannot assess the sustainability of payments. However, the current yield is noticeably above the market average.
Our estimate for the current year's dividend is based on a conservative scenario: assuming the payout ratio remains at last year's level and profit at the LTM level ($190.9 million), the dividend could be about $12.6 million, which at the current market cap gives a yield of about 0.77%. This is significantly below the current yield, suggesting a possible reduction in payouts.
P/E LTM of 8.56 is below the three-year average, making the valuation attractive
The current P/E LTM is 8.56, which is below the three-year average. This indicates that the share is trading at a discount to its historical valuation.
The three-year average P/E is not disclosed in the FACTS, but we can state that the current level is below it, as the FACTS indicate it is below average. This makes the share attractive for investors seeking undervalued assets.
However, it is worth considering that a low P/E may be a consequence of a cyclical downturn in profit, and if profit recovers, the multiple could rise. Nevertheless, the current valuation looks favorable.
On the portal's model, the upside to fair value is -1%, meaning the market already prices in current commodity prices
According to our model, the fair value of the share is 1% below the current market price. This means the market has fully priced in current commodity prices and other factors.
The model re-prices EBITDA at current commodity prices and the target EV/EBITDA. At current prices, there is no upside, indicating a balanced valuation.
Thus, from the model's perspective, the share is fairly valued, and further growth is possible only with improved market conditions or increased efficiency.
Valuation on the latest reported figures
| Metric | Value |
|---|---|
| Market cap | 1.63 bn USD |
| P/E (LTM) | 8.6 |
| P/B | 0.86 |
| Operating cash flow (LTM) | 0.29 bn |
| ROE | 11.1% |
| Dividend yield (12m) | 6.6% |
Bottom line
The H1 2026 report showed revenue growth of 8.8% and profit growth of 16.5%, with the margin reaching 10.6%. However, operating cash flow was half of net profit, casting doubt on earnings quality. The dividend yield of 6.61% and low P/E of 8.56 make the share attractive, but the gap between profit and cash is a key risk. On the portal's model, there is no upside, indicating a fair valuation. Verdict: rather attractive, but with a caveat on cash flow.
Open the company's financial profile ITMG →
See also: market overview · valuation map · stock screeners