ID_TPIA: H1 profit fell 77.5% even as revenue rose 83.6%
The H1 2026 report, ended 30 June, showed revenue of 5,348.8 million dollars and net profit of 283.2 million dollars. Revenue rose 83.6% year on year, but net profit fell 77.5%, and the net margin dropped from 43.3% to 5.3%. At a price implying a P/E LTM of 8.24 and a dividend yield of 0.54%, the share looks rather unattractive: revenue growth is not converting into profit, and net debt of 633.8 million dollars against operating cash flow of 9.6 million dollars for the half-year leaves no margin of safety.
Key takeaways
— H1 revenue rose 83.6% to 5,348.8 million dollars, but profit fell 77.5%
— Net margin collapsed from 43.3% to 5.3% – revenue growth did not reach the bottom line
— Operating cash flow for the half-year was only 9.6 million dollars against revenue of 5,348.8 million
— Net debt of 633.8 million dollars against LTM profit of 1,090.1 million – leverage is moderate, but cash flow does not cover it
— Dividend yield of 0.54% does not compensate for the profit decline and debt risks
— P/E LTM of 8.24 versus ROE of 11.5% – valuation does not look cheap given the margin collapse
Attractiveness
Key figures, USD bn
| Metric | H1 2025 | H1 2026 | Change |
|---|---|---|---|
| Revenue | 2.91 | 5.35 | +83.6% |
| Net profit | 1.26 | 0.28 | -77.5% |
| Operating cash flow | -0.11 | 0.01 | в прибыль |
| Net margin | 43.3% | 5.3% | -38.0 pp |
H1 revenue rose 83.6% to 5,348.8 million dollars, but profit fell 77.5%
H1 2026 revenue was 5,348.8 million dollars, up 83.6% year on year. This is strong growth, but it was not accompanied by profit growth: net profit fell 77.5% to 283.2 million dollars. The gap between revenue and profit dynamics points to a sharp increase in costs or one-off write-offs not disclosed in the provided data.
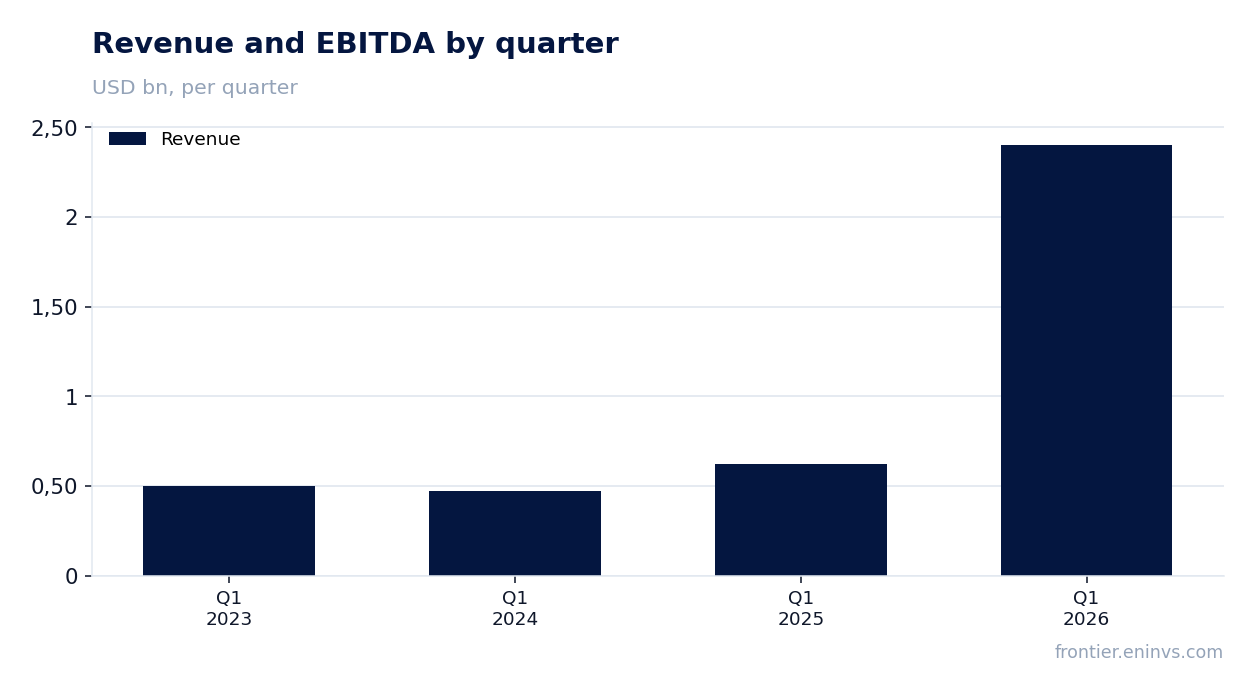
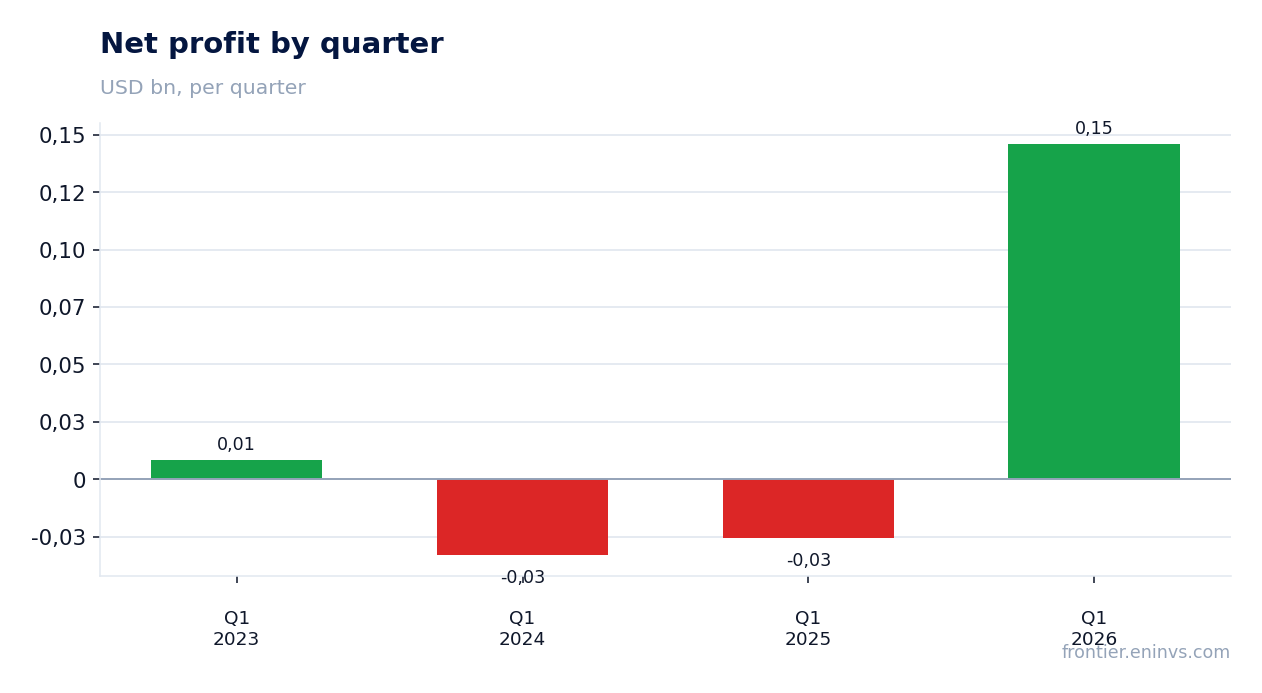
For comparison, in Q1 2026 revenue was 2,403.7 million dollars and net profit was 146.1 million dollars. This implies Q2 revenue slowed to approximately 2,945.0 million dollars, while profit was about 137.1 million dollars. Thus, Q2 profit was lower than Q1 despite higher revenue, confirming the margin deterioration.
Falling profit on rising revenue is a key negative signal from the report. Without disclosure of the reasons for this divergence, an investor cannot assess whether it is a one-off or a sustainable trend. Until the situation is clarified, the share is unlikely to receive support from fundamentals.
Net margin collapsed from 43.3% to 5.3% – revenue growth did not reach the bottom line
The net profit margin for H1 2026 was 5.3% versus 43.3% in the same period last year. This 38 percentage point drop is the most alarming item in the report. Even with significant revenue growth, the company barely earns: out of every 100 dollars of revenue, only 5.3 dollars reach the bottom line.
Such a sharp margin decline could be due to one-off factors or a structural increase in costs. The provided data does not break this down, so it is impossible to say exactly what ate the profit. However, the fact that the margin fell below 10% makes the company vulnerable to any slowdown in revenue.
For an investor, this means the business model may need reassessment. If last year's high margin was an anomaly rather than the norm, the current valuation may be overstated. Until details on costs and one-off items emerge, we cannot recommend the share for purchase.
Operating cash flow for the half-year was only 9.6 million dollars against revenue of 5,348.8 million
Operating cash flow for H1 2026 was 9.6 million dollars – an extremely low figure against revenue of 5,348.8 million dollars. In effect, the company generates almost no cash from core operations, which casts doubt on the quality of earnings and the ability to fund investments or debt from internal sources.
For comparison, over the trailing twelve months operating cash flow was 349.9 million dollars, also small relative to LTM revenue of 7,000.0 million dollars. This means the problem of converting profit into cash is not solely a half-year issue – it is more persistent.
Low operating cash flow combined with net debt of 633.8 million dollars creates refinancing risk. If the company cannot improve cash generation, it will have to raise external financing, potentially diluting shareholder value.
Net debt of 633.8 million dollars against LTM profit of 1,090.1 million – leverage is moderate, but cash flow does not cover it
Net debt at the latest reporting date was 633.8 million dollars. With LTM net profit of 1,090.1 million dollars, this corresponds to a debt-to-profit ratio of about 0.58 – a moderate level. However, servicing debt requires cash, and operating cash flow for the half-year was only 9.6 million dollars, insufficient even to cover interest if it is significant.
The company does not disclose its debt structure or interest rates, so the cost of servicing cannot be assessed. Nevertheless, the combination of low cash flow and debt limits financial flexibility. If market conditions worsen or rates rise, the company could face difficulties.
For shareholders, this means part of future profit may go to debt servicing and repayment rather than dividends or development. Until cash flow recovers, debt burden remains a risk factor.
Dividend yield of 0.54% does not compensate for the profit decline and debt risks
The dividend yield over the trailing twelve months is 0.54%. This is an extremely low level, unattractive to income-oriented investors. At the current share price, dividend payments have virtually no impact on total investment return.
For comparison, the key rate in the dollar zone is significantly higher, making ID_TPIA's dividend yield uncompetitive. Even if the company maintains payments, they do not compensate for the risks associated with falling profit and debt burden.
Moreover, with H1 net profit of 283.2 million dollars and the need to fund investments and debt, the company may be forced to cut dividends. This is another argument against the share at current levels.
P/E LTM of 8.24 versus ROE of 11.5% – valuation does not look cheap given the margin collapse
The P/E LTM is 8.24, and return on equity (ROE) is 11.5%. At first glance, a P/E below 10 may seem attractive, but with ROE at 11.5% and a falling margin, it is not. The market values the company based on earnings sustainability, and current results cast doubt on its stability.
Comparing the current P/E with a 3-year historical average is impossible, as this information is not in the provided data. However, the fact that profit fell 77.5% in the half-year suggests the current P/E may be deceptively low – if profit continues to decline, the multiple will rise.
For an investor, this means the share is not undervalued. Rather, the market is already pricing in expectations of further deterioration. Until there are signs of recovery in margin and cash flow, the valuation is unlikely to be revised upward.
Valuation on the latest reported figures
| Metric | Value |
|---|---|
| Market cap | 8.98 bn USD |
| P/E (LTM) | 8.2 |
| P/B | 3.06 |
| Operating cash flow (LTM) | 0.35 bn |
| ROE | 11.5% |
| Dividend yield (12m) | 0.5% |
Bottom line
The strong point of the report is revenue growth of 83.6% to 5,348.8 million dollars in H1 2026. However, this growth did not convert into profit: net profit fell 77.5% to 283.2 million dollars, and the margin collapsed from 43.3% to 5.3%. Operating cash flow of 9.6 million dollars is virtually absent, and net debt of 633.8 million dollars requires servicing. Dividend yield of 0.54% does not compensate for the risks. With P/E LTM of 8.24 and ROE of 11.5%, the share looks rather unattractive: the market is likely already pricing in further deterioration. A change in valuation would require signs of recovery in margin and cash flow.
Open the company's financial profile TPIA →
See also: market overview · valuation map · stock screeners