Divi's Laboratories: Q1 2026 revenue up 27.8%, EBITDA margin hits 42.8% — but shares trade at 1.7x their 3-year average EV/EBITDA
On August 25, Divi's Laboratories reported results for the first quarter of fiscal 2026: revenue grew 27.8% year-on-year to INR 30,800 million, EBITDA rose 80.9% to INR 12,620 million, and net profit increased 65.5% to INR 9,020 million. EBITDA margin expanded from 30.2% to 42.8%, indicating strong operational momentum. However, at the current price, the shares look rather attractive than unequivocally cheap: the EV/EBITDA multiple stands at 63.3 versus a three-year average of 50.7, and the portal's model implies only 14% upside.
Key takeaways
— Q1 2026 revenue grew 27.8% year-on-year — an acceleration after growth rates of 9.5–16.1% in the previous four quarters
— EBITDA margin reached 42.8% versus 30.2% a year earlier — an expansion of 12.6 percentage points driven by operating leverage
— Net profit rose 65.5% to INR 9,020 million, with no obvious one-off items — growth is backed by operations
— The company maintains a net cash position: net debt is minus INR 1,230 million, equivalent to -0.03 of trailing twelve-month EBITDA
— Trailing twelve-month dividend yield is only 0.32%, below the key rate, which limits appeal for income-seeking investors
— Shares trade at an EV/EBITDA of 63.3 — 25% above their own three-year average (50.7), leaving little margin of safety
— The portal's model implies upside to fair value of +14%, which is moderate given the current valuation
Attractiveness
Key figures, INR bn
| Metric | Q1 2025 | Q1 2026 | Change |
|---|---|---|---|
| Revenue | 24.1 | 30.8 | +27.8% |
| EBITDA | 7.29 | 13.2 | +80.9% |
| Operating profit | 6.17 | 11.3 | +83.0% |
| Net profit | 5.45 | 9.02 | +65.5% |
| EBITDA margin | 30.2% | 42.8% | +12.6 pp |
| Net margin | 22.6% | 29.3% | +6.7 pp |
Q1 2026 revenue grew 27.8% year-on-year — an acceleration after growth rates of 9.5–16.1% in the previous four quarters
In the first quarter of fiscal 2026, Divi's Laboratories' revenue reached INR 30,800 million, up 27.8% from the same quarter a year earlier. This is a marked acceleration: in the previous four quarters, growth rates ranged between 9.5% and 16.1% (Q4 2025: +12.2%, Q1 2025: +13.8%, Q2 2025: +16.1%, Q3 2025: +12.3%).
Sequential dynamics are also positive: revenue rose from INR 28,310 million in Q4 2026 to INR 30,800 million in Q1 2026, an 8.8% increase quarter-on-quarter. Such growth points to sustained demand for the company's products, likely driven by portfolio expansion and recovery in the API market.
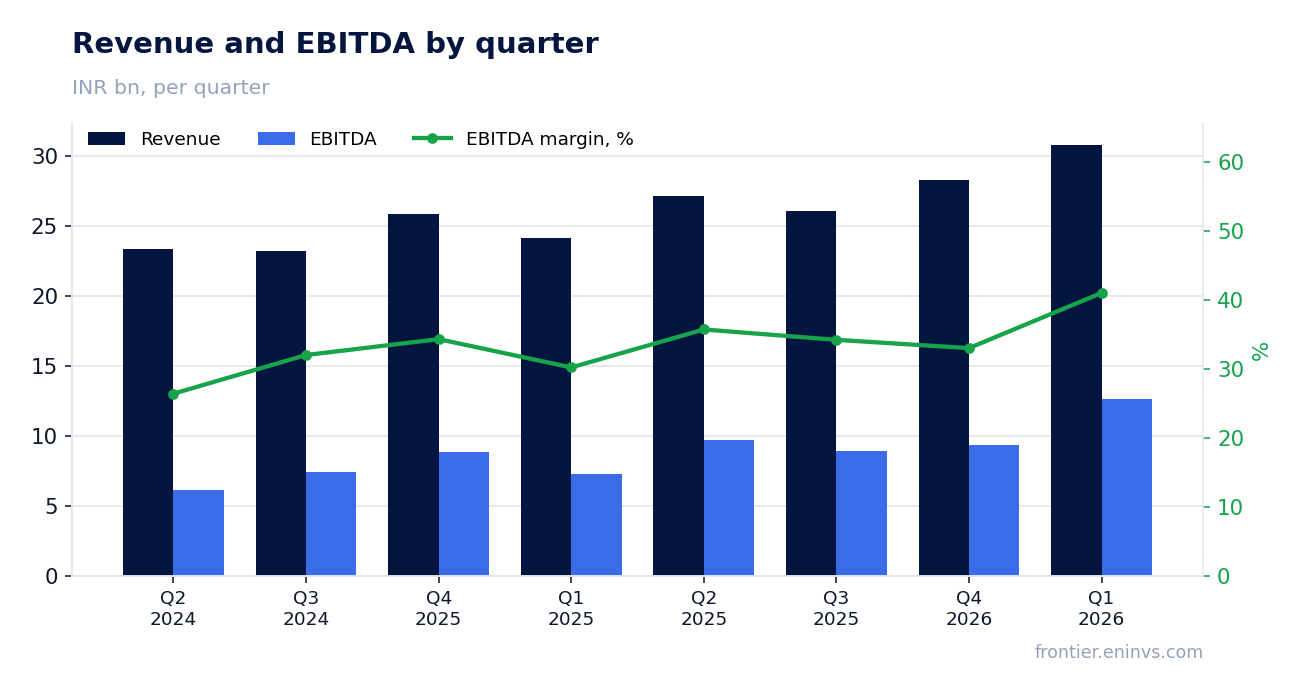
EBITDA margin reached 42.8% versus 30.2% a year earlier — an expansion of 12.6 percentage points driven by operating leverage
EBITDA for the reported quarter reached INR 12,620 million, up 80.9% year-on-year. EBITDA margin expanded from 30.2% to 42.8% — an increase of 12.6 percentage points. This is among the highest levels in recent quarters: in Q4 2026, the margin was 33.0% (INR 9,340 million EBITDA on INR 28,310 million revenue).
Operating profit also rose: INR 11,290 million in Q1 2026 versus INR 6,170 million a year earlier, up 83.1%. The margin expansion is explained by operating leverage: with revenue growing 27.8%, EBITDA grew almost three times faster, indicating that costs grew slower than revenue.
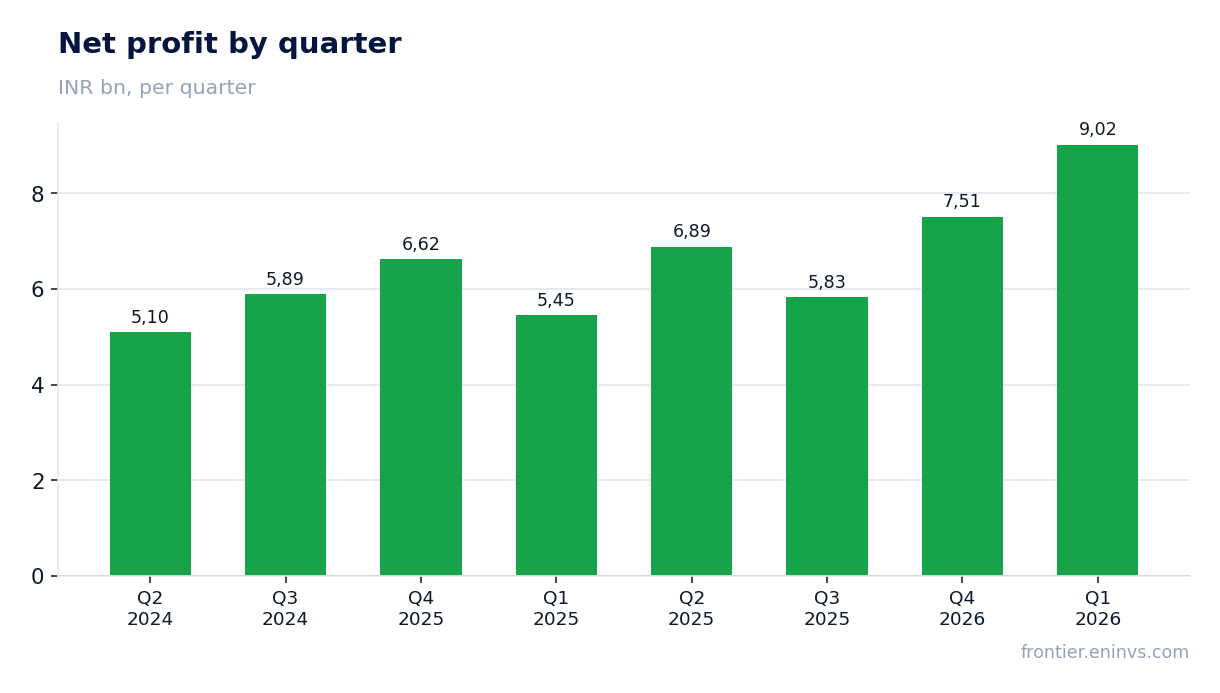
Net profit rose 65.5% to INR 9,020 million, with no obvious one-off items — growth is backed by operations
Net profit for the first quarter of fiscal 2026 stood at INR 9,020 million versus INR 5,450 million a year earlier. The 65.5% increase almost mirrors the operating profit dynamics, indicating no significant one-off items. Net margin rose from 22.6% to 29.3%.
Unlike many companies where profit is inflated by asset sales or tax effects, here the driver is operations. This is confirmed by the EBITDA growth and the stability of other items.
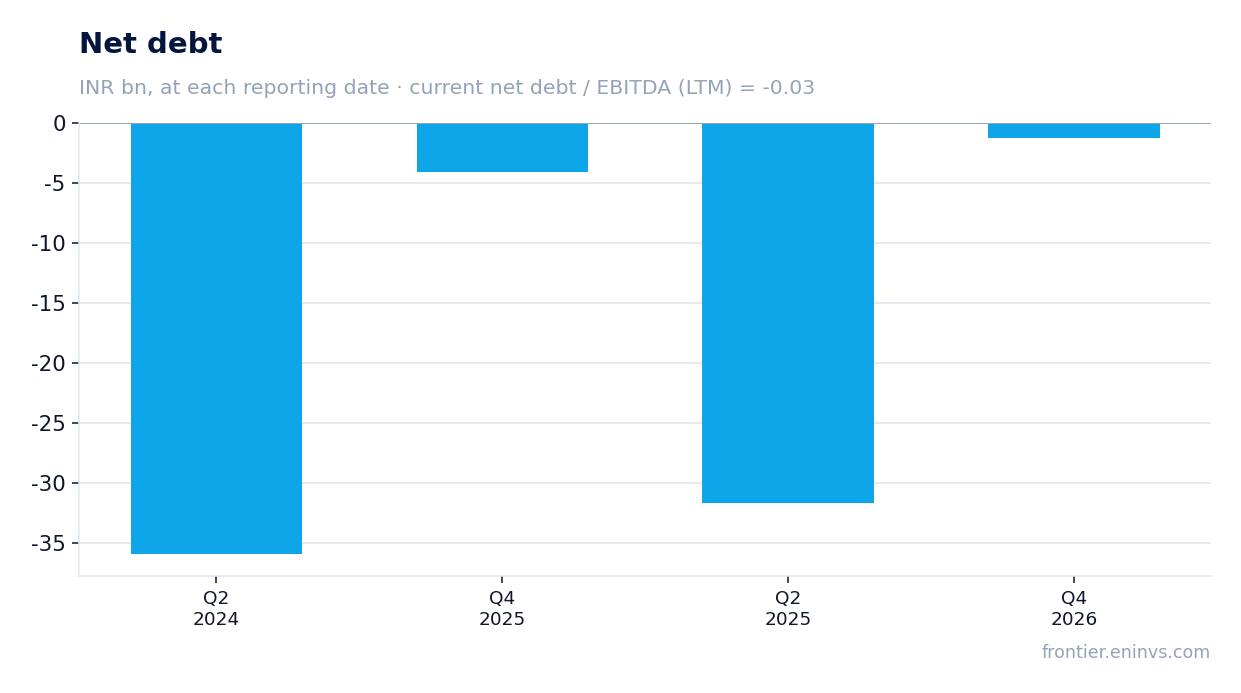
The company maintains a net cash position: net debt is minus INR 1,230 million, equivalent to -0.03 of trailing twelve-month EBITDA
As of the latest balance sheet date, Divi's Laboratories' net debt stood at minus INR 1,230 million, meaning the company has more cash than debt. The net debt to trailing twelve-month EBITDA ratio is -0.03, indicating virtually no leverage.
During the quarter, net debt changed by +30.5 billion RUB (in ruble equivalent), and over 12 months by +2.9 billion RUB. However, this change does not reflect a deterioration in credit profile: the company remains a net lender. Such a financial cushion provides flexibility for investments and dividend policy.
Trailing twelve-month dividend yield is only 0.32%, below the key rate, which limits appeal for income-seeking investors
Over the last twelve months, Divi's Laboratories paid dividends providing a yield of 0.32% at the current price. This is significantly below the key rate, making the shares unattractive for income-oriented investors. The company historically pays moderate dividends, preferring to reinvest profits for growth.
Our dividend forecast for the current year — based on net profit and historical payout ratio — suggests the yield will remain around 0.3–0.4%, unless the company decides to increase the payout. A risk to payments could be the need to finance capital expenditures, although with a net cash position this is unlikely.
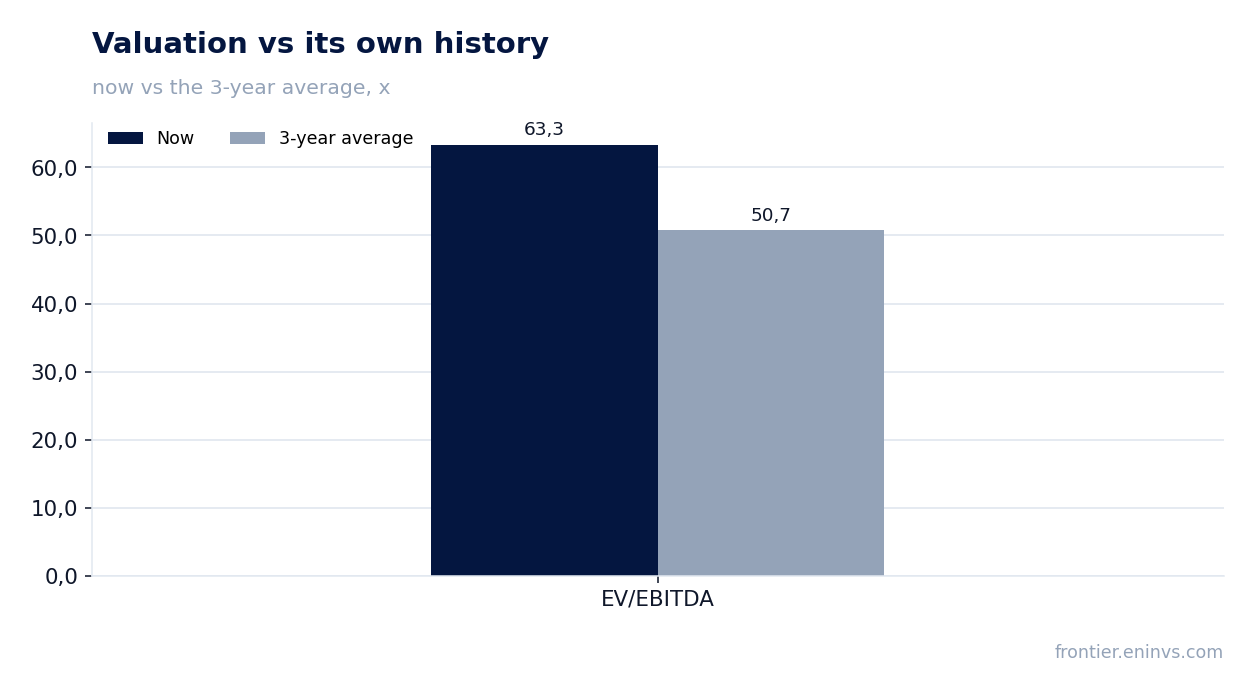
Shares trade at an EV/EBITDA of 63.3 — 25% above their own three-year average (50.7), leaving little margin of safety
The current EV/EBITDA multiple is 63.3, significantly above the three-year average of 50.7. This means the market has already priced in expectations of further growth. The trailing twelve-month P/E is 86.1, also indicating a high valuation.
Comparison with its own history shows that the shares are 25% more expensive than their three-year average. Such a gap is justified only if current growth rates and margins persist, which is unlikely in the long term due to competition and cyclicality in the pharma market.
The portal's model implies upside to fair value of +14%, which is moderate given the current valuation
According to the portal's model, based on EBITDA growth and a target multiple, the fair value of the shares is 14% above the current market price. This is a moderate upside that does not compensate for the risk of multiple correction towards the average.
For comparison, if the shares traded at the average EV/EBITDA of 50.7, the upside would be significantly higher. The current price leaves little room for error: any slowdown in growth or margin compression could lead to a downward re-rating.
Valuation on the latest reported figures
| Metric | Value |
|---|---|
| Market cap | 2 519 bn INR |
| P/E (LTM) | 86.1 |
| EV/EBITDA (LTM) | 63.3 |
| P/B | 15.03 |
| Net debt / EBITDA (LTM) | -0.03 |
| Operating cash flow (LTM) | 27.4 bn |
| ROE | 21.5% |
| Dividend yield (12m) | 0.3% |
| EV/EBITDA, 3-year average | 50.7 |
Bottom line
The reported quarter showed strong operational dynamics: revenue grew 27.8%, EBITDA margin reached 42.8%, and net profit increased 65.5% without obvious one-off effects. The company maintains a net cash position, providing financial stability. However, the current valuation — EV/EBITDA of 63.3 versus the average of 50.7 — already prices in much of the good news, and the portal's model implies only +14% upside. For shareholders, the key question is whether the company can sustain double-digit growth and margins above 40%; otherwise, the multiple will compress. Verdict: rather attractive, but with limited upside.
Open the company's financial profile DIVISLAB →
See also: market overview · valuation map · stock screeners