Hindustan Unilever: revenue accelerated to +10.3%, but profit fell 3.0% on one-offs
25 августа Hindustan Unilever раскрыла результаты за первый квартал 2026 года. Выручка выросла на 10,3% год к году, до 171 840 млн INR, EBITDA – на 9,3%, до 39 470 млн INR, однако чистая прибыль снизилась на 3,0%, до 26 730 млн INR, из-за разовых статей. При текущей цене акция выглядит скорее привлекательно: рост ускоряется, долг отрицательный, а модель портала даёт потенциал +5%.
Key takeaways
— Revenue accelerated to +10.3% – the best quarterly growth in a year
— EBITDA margin nearly flat, but net profit fell on one-offs
— Company remains net cash: debt rose, but the ratio is negative
— Dividend yield of 2.1% – below history, but payouts backed by cash flow
— EV/EBITDA multiple below its own three-year average, but P/E stays high
— Operating cash flow of INR 110 bn over 12 months covers capex and dividends
Attractiveness
Key figures, INR bn
| Metric | Q1 2025 | Q1 2026 | Change |
|---|---|---|---|
| Revenue | 156 | 172 | +10.3% |
| EBITDA | 37.1 | 40.6 | +9.3% |
| Operating profit | 33.1 | 35.9 | +8.4% |
| Net profit | 27.6 | 26.7 | -3.0% |
| EBITDA margin | 23.8% | 23.6% | -0.2 pp |
| Net margin | 17.7% | 15.6% | -2.1 pp |
Revenue accelerated to +10.3% – the best quarterly growth in a year
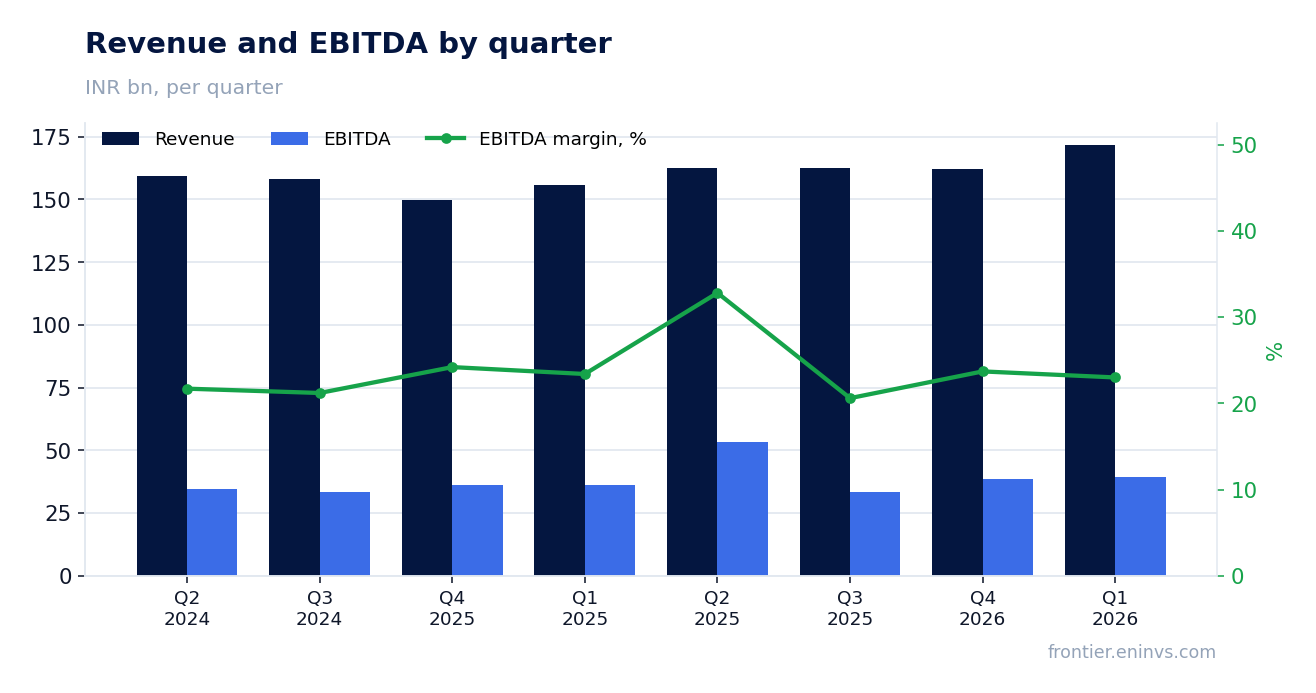
In Q1 2026, Hindustan Unilever's revenue reached INR 171,840 million, up 10.3% year-on-year. This is a marked acceleration from previous quarters: Q2 2025 grew +2.0%, Q3 2025 +2.6%, Q4 2025 +8.2%. Thus, the top-line trend is steadily improving.
The acceleration likely reflects recovering demand in key categories – foods, home care, and personal care. The company does not disclose segment drivers in this release, but the trend is clear: after several quarters of modest growth, revenue has moved to double-digit rates.
EBITDA margin nearly flat, but net profit fell on one-offs
EBITDA for Q1 2026 grew 9.3% year-on-year to INR 39,470 million, with margin at 23.6% versus 23.8% a year earlier – nearly flat. Operating profit rose to INR 35,940 million, indicating stability in the core business.
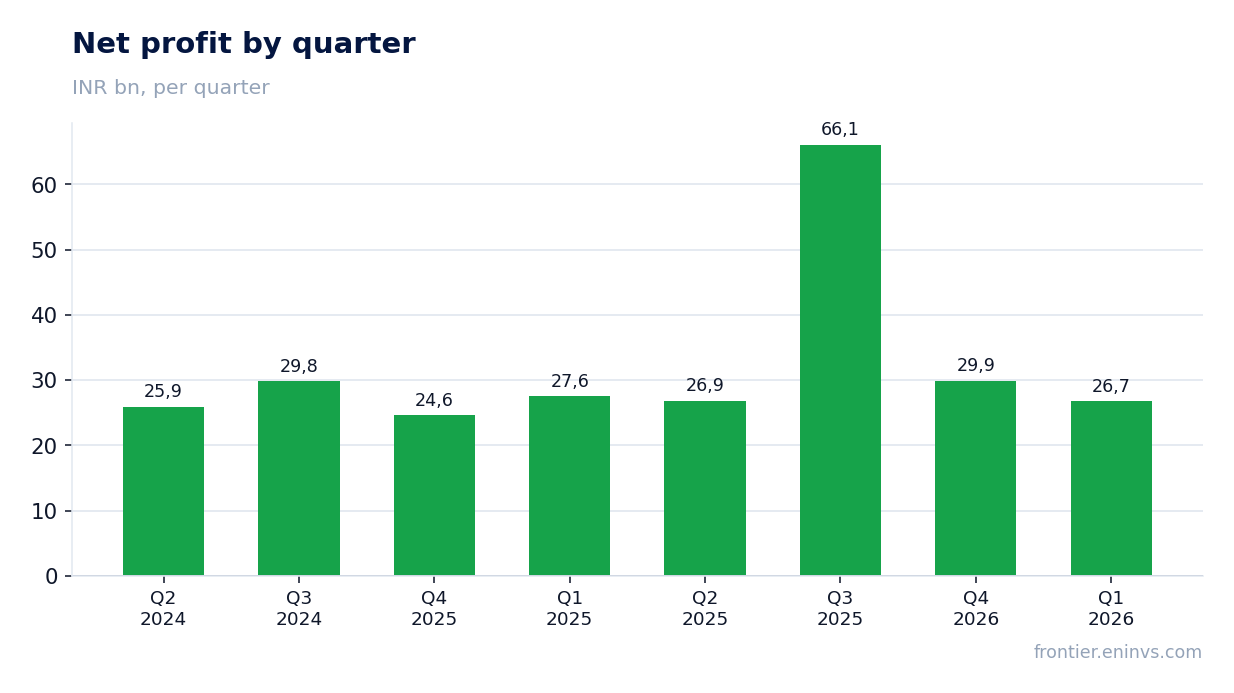
Net profit, however, fell 3.0% to INR 26,730 million, and net margin contracted from 17.7% to 15.6%. The gap between operating and net dynamics points to one-off items – likely tax or financial effects not disclosed in the report. Without them, profit would probably have grown in line with operations.
Company remains net cash: debt rose, but the ratio is negative
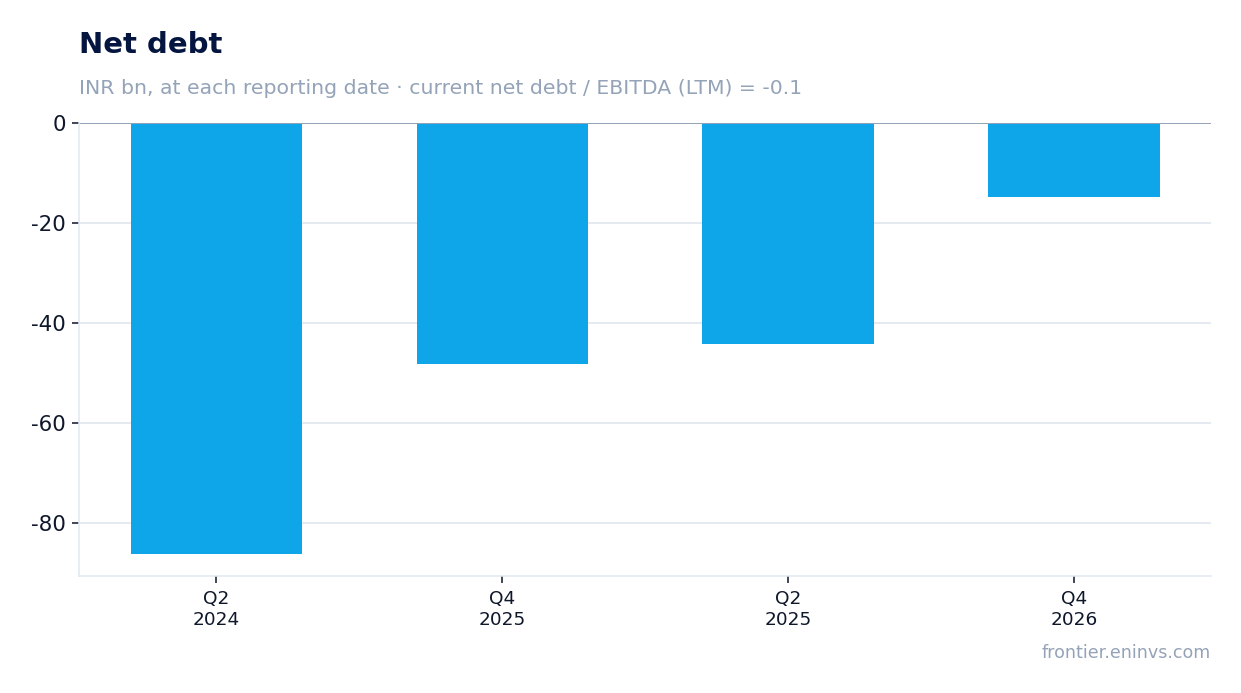
On the latest balance sheet, net debt stands at INR -14,790 million, meaning cash exceeds debt. The net debt to EBITDA ratio for the trailing twelve months is -0.1. Over the quarter, net debt rose by INR 29.5 billion, and over the year by INR 33.5 billion, but the company remains a net lender.
The rise in debt likely stems from working capital or payouts, but financial stability is not in question: negative net debt means the company does not rely on borrowed funds and has a cushion for investments and dividends.
Dividend yield of 2.1% – below history, but payouts backed by cash flow
Over the trailing twelve months, Hindustan Unilever paid dividends with a yield of 2.1% at the current price. This is lower than one might expect from a company with stable cash flow, but payouts are backed by operating cash flow of INR 110,000 million over the trailing twelve months.
Given current earnings and payout policy, the dividend is likely to remain at a comparable level. The main risk to payouts is a decline in profit due to one-offs, but operating cash flow remains strong, providing a safety margin.
EV/EBITDA multiple below its own three-year average, but P/E stays high
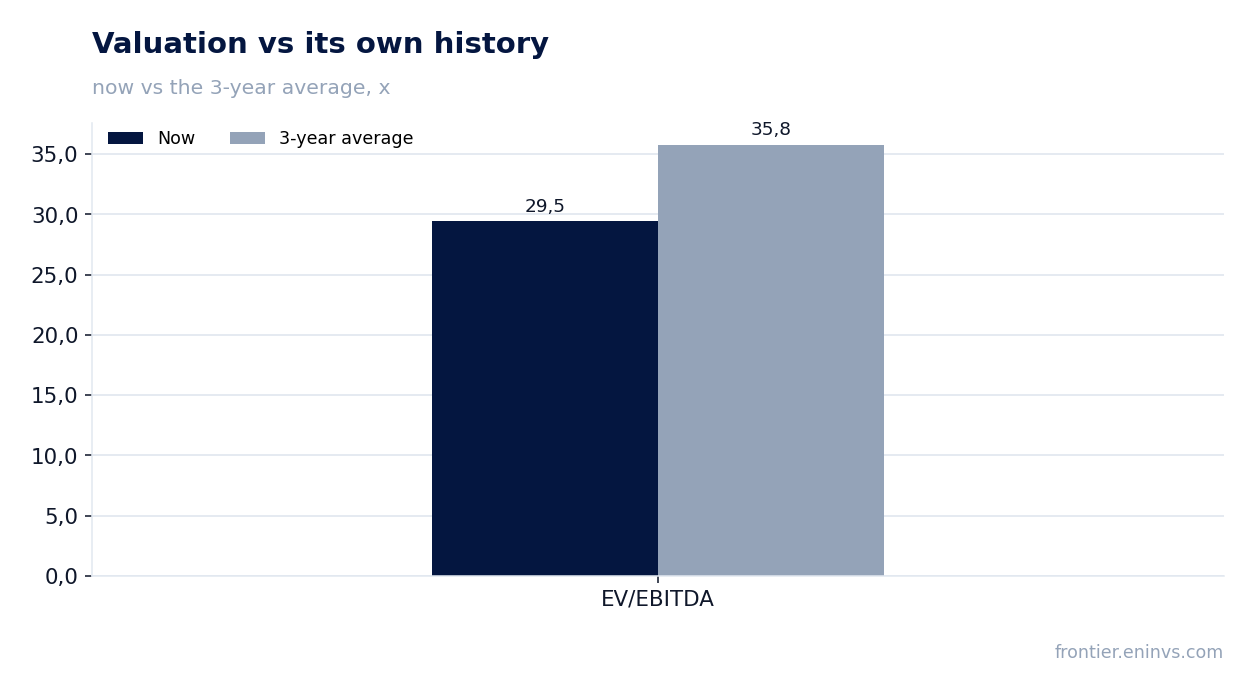
The current EV/EBITDA multiple for the trailing twelve months is 29.5, below the three-year average of 35.8. This suggests the stock trades at a discount to its own history on this metric.
At the same time, P/E LTM stands at 30.6, reflecting a high valuation of earnings. Return on equity is 21.9%, which justifies a premium, but investors should note that much of the value is already priced in.
Operating cash flow of INR 110 bn over 12 months covers capex and dividends
Over the trailing twelve months, operating cash flow reached INR 110,000 million. This is a substantial amount that covers both capital expenditures and dividend payments, ensuring business sustainability.
Strong cash flow is a key factor supporting the dividend policy and allowing the company to maintain negative net debt. Even with rising capex, the company is unlikely to face a liquidity shortfall.
Valuation on the latest reported figures
| Metric | Value |
|---|---|
| Market cap | 4 570 bn INR |
| P/E (LTM) | 30.6 |
| EV/EBITDA (LTM) | 29.5 |
| P/B | 9.38 |
| Net debt / EBITDA (LTM) | -0.10 |
| Operating cash flow (LTM) | 110 bn |
| ROE | 21.9% |
| Dividend yield (12m) | 2.1% |
| EV/EBITDA, 3-year average | 35.8 |
Bottom line
Hindustan Unilever reported strong revenue acceleration – +10.3% in Q1, the best result in a year. EBITDA margin remained stable, and operating profit grew, but net profit fell due to one-offs, which does not reflect a deterioration in the core business. The company maintains negative net debt and generates strong operating cash flow covering dividends. The stock trades below its own three-year average EV/EBITDA, but P/E remains high. Verdict – rather attractive: growth is accelerating, the balance sheet is solid, and the portal's model implies +5% upside.
Open the company's financial profile HINDUNILVR →
See also: market overview · valuation map · stock screeners