Tata Consultancy Services: revenue accelerated to +13.9%, but net margin compressed to 18.5%

Tata Consultancy Services раскрыла результаты за первый квартал 2026 финансового года (апрель–июнь 2025 календарного года). Выручка выросла на 13,9% год к году, до 722 750 млн INR, EBITDA – на 15,3%, до 185 560 млн INR, а чистая прибыль – лишь на 4,6%, до 133 490 млн INR. При текущей цене акция выглядит скорее привлекательно: мультипликатор EV/EBITDA в 10,8 раза заметно ниже собственного трёхлетнего среднего (17,5 раза), а дивидендная доходность в 5,0% остаётся высокой.
Key takeaways
— Revenue in Q1 2026 grew 13.9% YoY – the fastest in the last five quarters
— EBITDA margin rose to 26.9% from 26.6% a year earlier, but net margin fell from 20.1% to 18.5%
— Net profit grew only 4.6% due to rising costs and likely tax effects
— Leverage remains minimal: net debt at the end of the quarter was INR 48,780 million, or 0.07 of LTM EBITDA
— Trailing twelve-month dividend yield is 5.0%, above the historical average
— On the portal's model, the stock has +9% upside to fair value
— Operating cash flow in Q1 2026 was INR 121,710 million, capex INR 7,530 million, leaving ample room for dividends
Attractiveness
Key figures, INR bn
| Metric | Q1 2025 | Q1 2026 | Change |
|---|---|---|---|
| Revenue | 634 | 723 | +13.9% |
| EBITDA | 169 | 195 | +15.3% |
| Operating profit | 155 | 173 | +11.6% |
| Net profit | 128 | 133 | +4.6% |
| Operating cash flow | 119 | 122 | +2.1% |
| Capex | 8.58 | 7.53 | -12.2% |
| EBITDA margin | 26.6% | 26.9% | +0.3 pp |
| Net margin | 20.1% | 18.5% | -1.6 pp |
Revenue in Q1 2026 grew 13.9% YoY – the fastest in the last five quarters
In Q1 FY2026 (April–June 2025 calendar year), Tata Consultancy Services' revenue reached INR 722,750 million, up 13.9% YoY. This is a marked acceleration from prior quarters: Q2 FY2025 grew 2.4%, Q3 FY2025 4.9%, Q4 FY2025 9.6%.
The top-line acceleration likely reflects recovering demand for IT services after a period of restrained client budgets. The company does not disclose segment details, but the overall trend points to improving conditions.
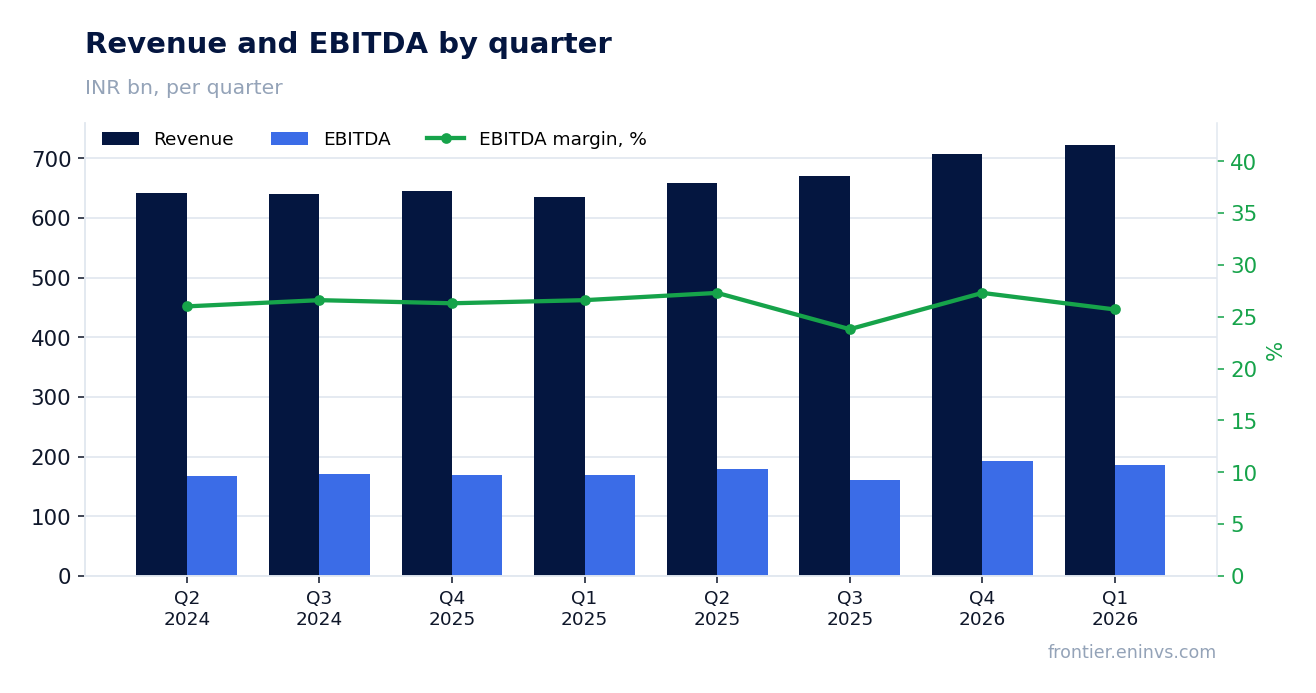
EBITDA margin rose to 26.9% from 26.6% a year earlier, but net margin fell from 20.1% to 18.5%
EBITDA in Q1 2026 was INR 185,560 million, with an EBITDA margin of 26.9% versus 26.6% a year earlier. The improvement in operating margin likely stems from revenue growth and cost control.
However, net margin contracted from 20.1% to 18.5%: net profit grew only 4.6% to INR 133,490 million despite higher EBITDA. The gap between EBITDA and net profit points to higher depreciation, interest expenses, or an effective tax rate – the company does not disclose details, but this is a key watch item.
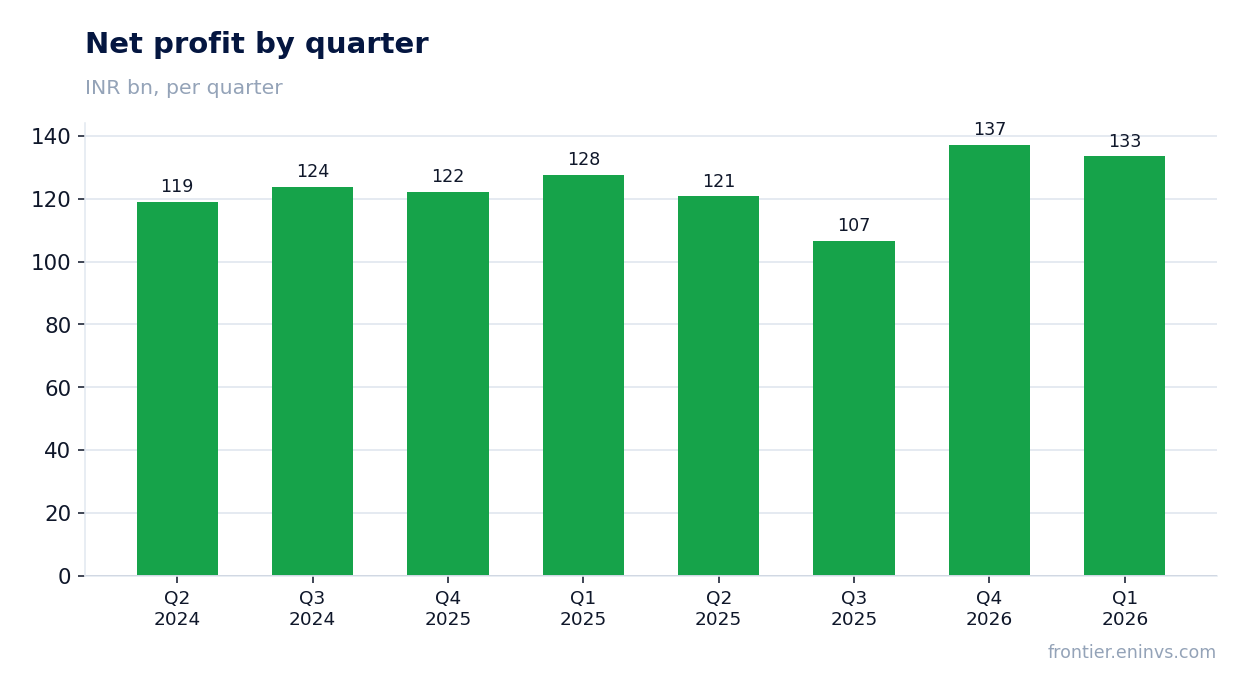
Net profit grew only 4.6% due to rising costs and likely tax effects
Net profit for Q1 2026 was INR 133,490 million, only 4.6% higher than a year earlier. Operating profit grew faster: INR 173,170 million versus INR 155,140 million in Q1 2025 (+11.6%).
The divergence between operating and net dynamics is most likely due to higher financial items – interest or taxes. The company does not disclose details, but investors should watch the effective tax rate in upcoming reports.
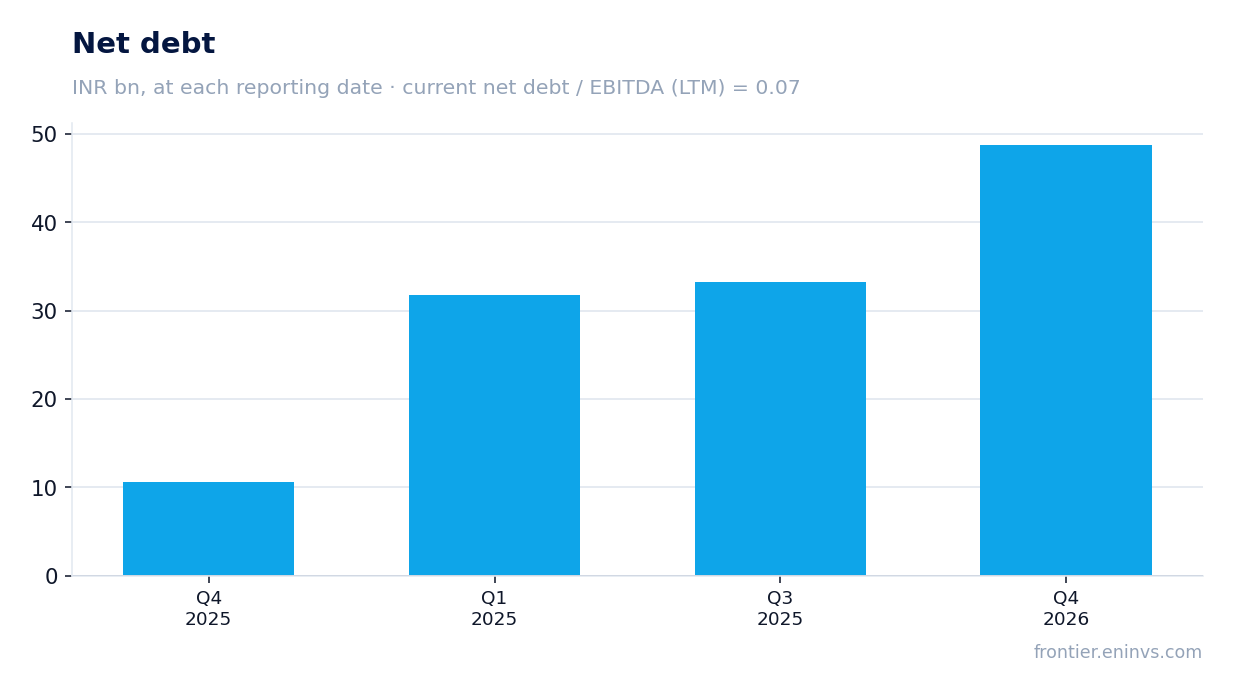
Leverage remains minimal: net debt at the end of the quarter was INR 48,780 million, or 0.07 of LTM EBITDA
Tata Consultancy Services' balance sheet at the end of Q1 2026 showed net debt of INR 48,780 million. The net debt to LTM EBITDA ratio is 0.07, indicating an almost debt-free capital structure.
Over the last 12 months, net debt increased by INR 38.2 billion, but given the scale of the business, this does not create strain. The company retains significant financial flexibility for investments and shareholder returns.
Trailing twelve-month dividend yield is 5.0%, above the historical average
Over the last 12 months, Tata Consultancy Services paid dividends yielding 5.0% at the current price. This is above the company's historical average yield, making the stock attractive for income-oriented investors.
The company historically distributes a significant portion of free cash flow as dividends. In Q1 2026, operating cash flow was INR 121,710 million and capex only INR 7,530 million, leaving ample room for payouts. However, net profit growth has slowed, so future dividends will depend on the company's ability to control costs.
On the portal's model, the stock has +9% upside to fair value
Our value-creation model, based on EBITDA growth and a target multiple, values the stock at 9% above the current market price. This is a moderate but positive upside.
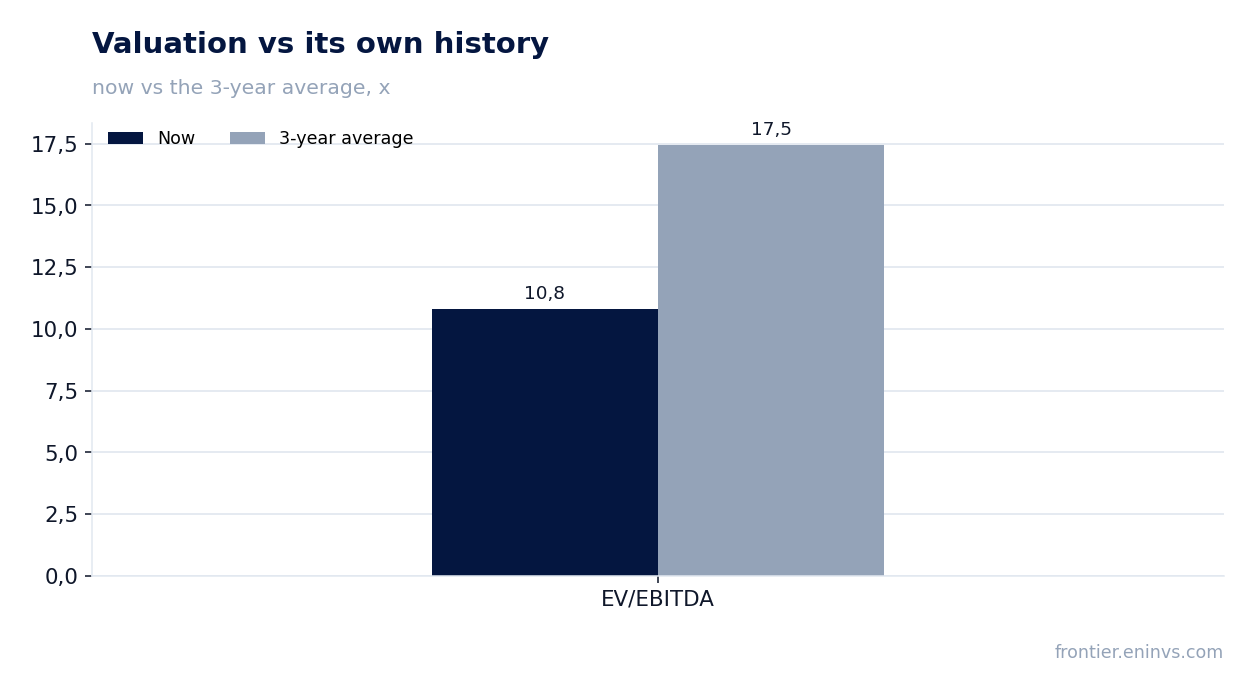
The current EV/EBITDA multiple is 10.8x versus the three-year average of 17.5x. Even considering slower profit growth, the discount to its own history looks undervalued. P/E LTM is 16.0x, also below historical levels for the company.
Operating cash flow in Q1 2026 was INR 121,710 million, capex INR 7,530 million, leaving ample room for dividends
Operating cash flow in Q1 2026 reached INR 121,710 million, up 2.1% from INR 119,190 million a year earlier. Capex was only INR 7,530 million, reflecting the asset-light IT services model.
Free cash flow (OCF minus capex) was approximately INR 114,180 million for the quarter – more than enough for dividends and investments. Over the last 12 months, operating cash flow was INR 520,900 million, confirming robust cash generation.
Valuation on the latest reported figures
| Metric | Value |
|---|---|
| Market cap | 7 989 bn INR |
| P/E (LTM) | 16.0 |
| EV/EBITDA (LTM) | 10.8 |
| P/B | 7.45 |
| Net debt / EBITDA (LTM) | 0.07 |
| Operating cash flow (LTM) | 521 bn |
| ROE | 49.0% |
| Dividend yield (12m) | 5.0% |
| EV/EBITDA, 3-year average | 17.5 |
Bottom line
Tata Consultancy Services reported strong revenue acceleration (+13.9% YoY) and EBITDA margin growth to 26.9%, confirming demand recovery. However, net profit grew only 4.6% due to net margin compression to 18.5%, and this is the key question for shareholders: whether it is a one-off or the start of a trend. Leverage is minimal (0.07 EBITDA), and the dividend yield of 5.0% remains attractive. Given the discount to its own history and +9% upside on the portal's model, the stock looks rather attractive, but investors should watch net margin dynamics in coming quarters.
Open the company's financial profile TCS →
See also: market overview · valuation map · stock screeners