Titan Company: revenue accelerated to +40%, but valuation is near its peak
On August 25, Titan Company reported results for the first quarter of fiscal 2026: revenue grew 40.3% YoY, EBITDA – 57.0%, net profit – 62.9%. Growth accelerated versus prior quarters, margins expanded, but the stock trades at a premium to its own history, hence the verdict is 'rather attractive'.
Key takeaways
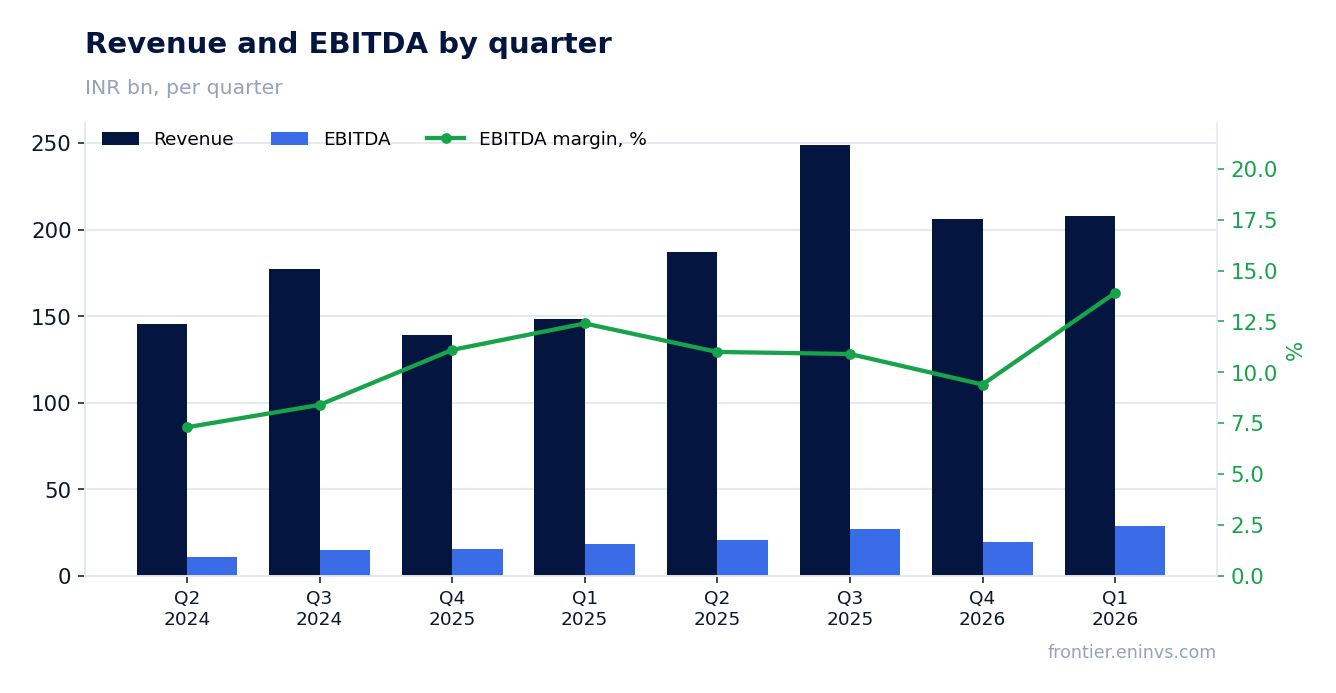
— Revenue +40.3% – best quarterly growth in a year, driven by the jewelry segment
— EBITDA margin 14.6% – highest in four quarters, thanks to operating leverage
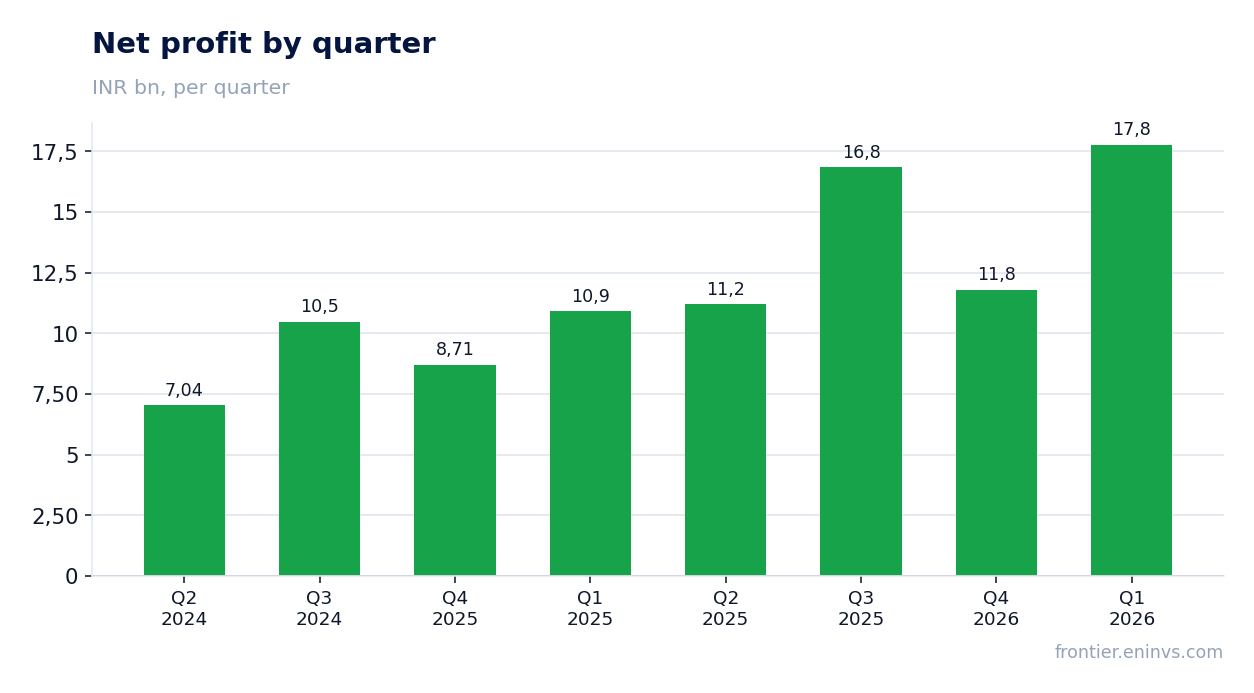
— Net profit +62.9% – faster than revenue, but part of the growth may be one-off
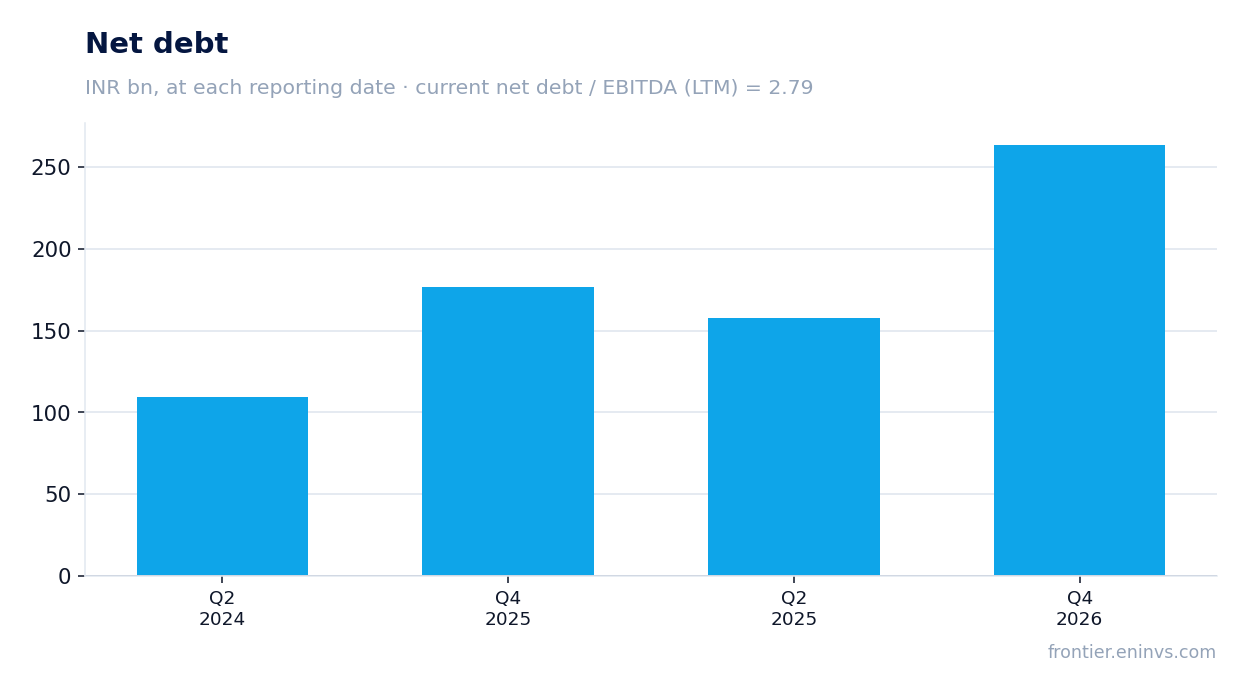
— Debt rose to INR 263.6 bn, but debt/EBITDA at 2.79 is tolerable for a capital-intensive business
— Dividend yield 0.3% – low, but the company pays consistently
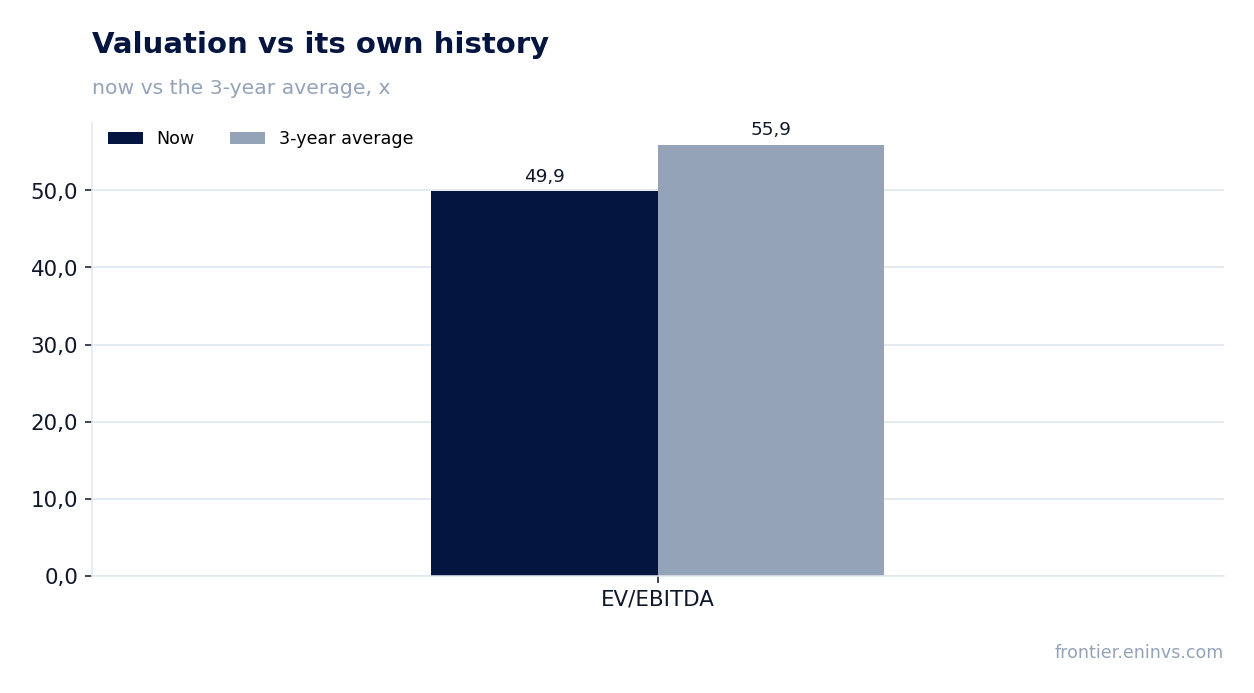
— Valuation: EV/EBITDA 49.9 – above the 3-year average (55.9), but the portal's model implies +14% upside
Attractiveness
Key figures, INR bn
| Metric | Q1 2025 | Q1 2026 | Change |
|---|---|---|---|
| Revenue | 148 | 208 | +40.3% |
| EBITDA | 19.4 | 30.4 | +57.0% |
| Operating profit | 16.5 | 26.3 | +60.0% |
| Net profit | 10.9 | 17.8 | +62.9% |
| EBITDA margin | 13.1% | 14.6% | +1.5 pp |
| Net margin | 7.4% | 8.5% | +1.1 pp |
Revenue +40.3% – best quarterly growth in a year, driven by the jewelry segment
In the first quarter of fiscal 2026, Titan Company's revenue reached INR 207,870 million, up 40.3% YoY. This is the highest quarterly pace in the last four quarters: the previous quarter grew +48.3%, but that was seasonally strong due to wedding season and festivals.
The main driver is the jewelry segment, which traditionally contributes over 80% of revenue. The company continues to expand its store network and gain market share, supporting double-digit growth even against a high base from the previous year.
EBITDA margin 14.6% – highest in four quarters, thanks to operating leverage
EBITDA in the reported quarter grew 57.0% YoY to INR 28,900 million, with an EBITDA margin of 14.6% versus 13.1% a year earlier. This is the best reading in the last four quarters – the previous three quarters saw margins in the 9–12% range.
Margin expansion is explained by operating leverage: with revenue growing 40%, fixed costs are spread over a larger base, yielding disproportionate profit growth. The company also controls personnel and marketing costs, as seen in operating profit dynamics, which grew faster than revenue.
Net profit +62.9% – faster than revenue, but part of the growth may be one-off
Net profit for the first quarter of fiscal 2026 reached INR 17,770 million, up 62.9% YoY. Profit growth outpaced revenue, indicating net margin expansion from 7.4% to 8.5%.
However, part of this growth may be due to one-off factors such as tax optimization or investment income. In previous quarters, net margin was lower – 6–7%, so the sustainability of the current level remains to be confirmed.
Debt rose to INR 263.6 bn, but debt/EBITDA at 2.79 is tolerable for a capital-intensive business
Net debt at the end of the quarter stood at INR 263,610 million, up INR 105.8 billion from the previous reporting date. Over the last 12 months, debt increased by INR 86.7 billion, reflecting the company's active investment program.
The ratio of net debt to EBITDA for the trailing twelve months is 2.79. This is a moderate level for a company with stable cash flow and strong market positions. Operating cash flow for 12 months – INR 55,900 million – covers interest expenses and part of capital expenditures.
Dividend yield 0.3% – low, but the company pays consistently
Over the last 12 months, Titan Company paid dividends yielding 0.3% at the current price. This is a modest level, but the company maintains a policy of regular payments, as confirmed by history.
Given current earnings and a payout policy we assess as conservative, the dividend next year could grow along with profits, but a significant increase in yield is unlikely – the company prefers to reinvest in growth.
Valuation: EV/EBITDA 49.9 – above the 3-year average (55.9), but the portal's model implies +14% upside
The current EV/EBITDA multiple is 49.9 – below the three-year average (55.9), indicating relative cheapness compared to its own history. P/E LTM is 77.2, reflecting high growth expectations.
According to the portal's model, based on EBITDA growth and target multiple, the upside potential is +14%. This is a moderate upside that does not justify aggressive buying, but also does not signal overvaluation.
The key risk to valuation is a slowdown in revenue or margin growth, which would lead to multiple compression. So far the company is accelerating, but investors should watch the dynamics in the coming quarters.
Valuation on the latest reported figures
| Metric | Value |
|---|---|
| Market cap | 4 443 bn INR |
| P/E (LTM) | 77.2 |
| EV/EBITDA (LTM) | 49.9 |
| P/B | 28.30 |
| Net debt / EBITDA (LTM) | 2.79 |
| Operating cash flow (LTM) | 55.9 bn |
| ROE | 45.3% |
| Dividend yield (12m) | 0.3% |
| EV/EBITDA, 3-year average | 55.9 |
Bottom line
Titan Company reported a strong quarter: revenue and profit are growing at double-digit rates, margins are expanding, and leverage remains moderate. However, part of the profit growth may be one-off, and dividend yield is minimal. The stock trades below its three-year average EV/EBITDA, but absolute valuation is high. Verdict – 'rather attractive': there is growth potential, but it requires confirmation of the sustainability of current trends.
Open the company's financial profile TITAN →
See also: market overview · valuation map · stock screeners