AltynGold: record profit was driven half by the gold price, not by volumes
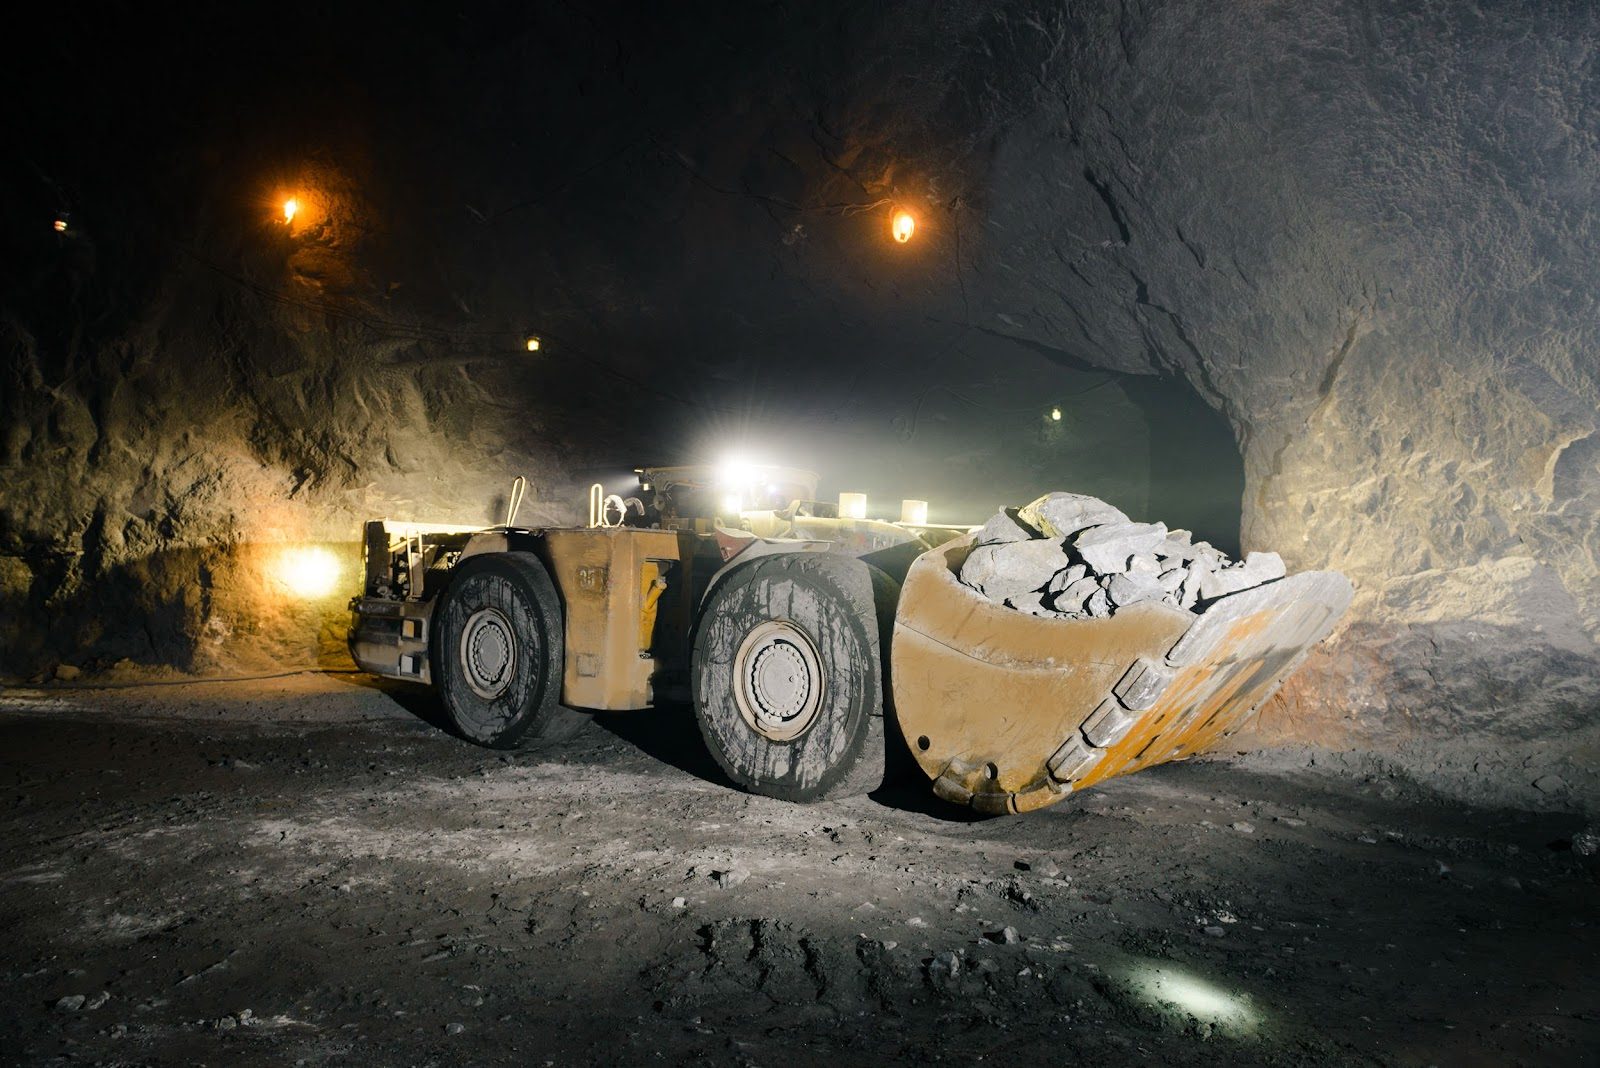
On 29 September AltynGold released unaudited results for the first half of 2026. Revenue rose 64.6% to USD 115.2m, adjusted EBITDA by 55.4% to USD 68.5m and net profit by 58.4% to USD 42.7m. Gold sold added only 9.0%, while the average realised price rose 50.3% to USD 4,615/oz, so the record is half price-driven. With EV/EBITDA at 3.0 against a three-year average of 152.8 and the portal model implying 56% upside, the share looks attractive, but the durability of the result hinges on the metal price.
Key takeaways
— Revenue rose 64.6% to USD 115.2m, but gold sales added only 9.0% – the rest came from the metal price
— EBITDA rose 55.4% to USD 68.5m, while the margin fell to 59.5% from 63.0% a year earlier
— Net profit rose 58.4% to USD 42.7m, and one-off items of USD 1.7m did not spoil it
— Operating cash flow rose 64.7% to USD 52.1m, but capex of USD 26.1m and tax of USD 15.6m absorbed almost the entire inflow
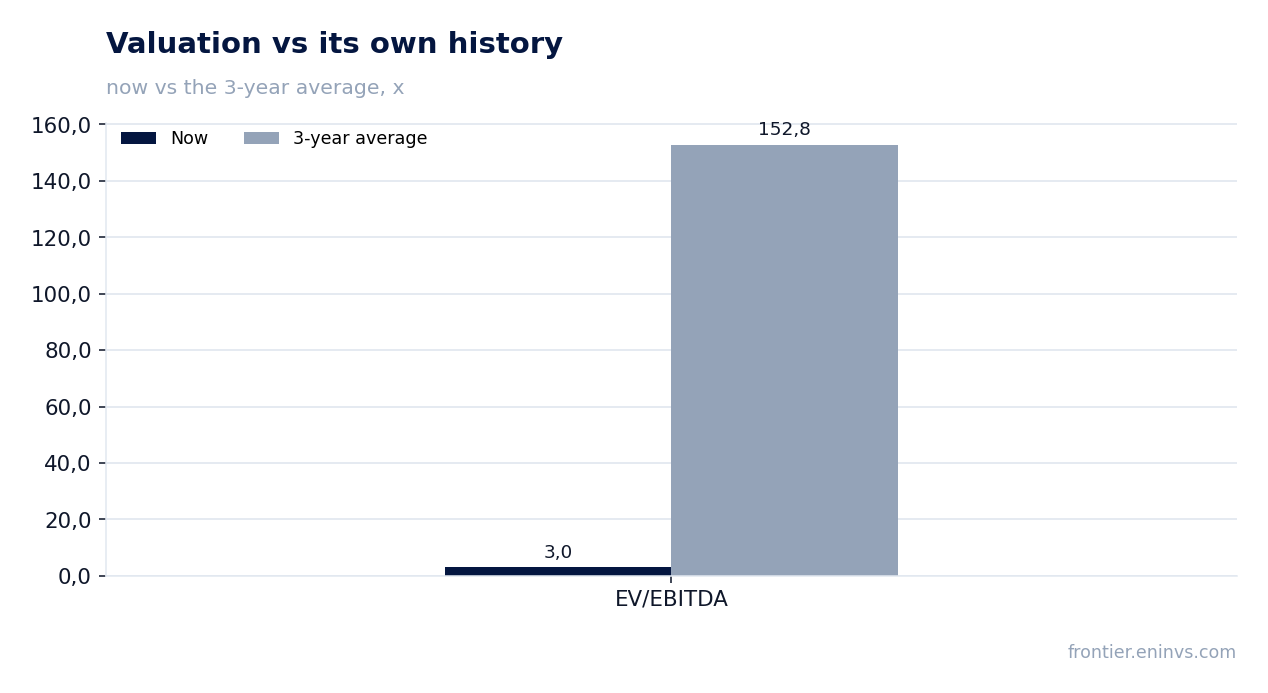
— EV/EBITDA of 3.0 against a three-year average of 152.8 – the market values the company several times cheaper than its own history
— The portal model implies 56% upside to the current price, but this is our estimate, not a consensus
Attractiveness
Key figures, USD bn
| Metric | H1 2025 | H1 2026 | Change |
|---|---|---|---|
| Revenue | 0.07 | 0.12 | +64.6% |
| EBITDA | 0.04 | 0.07 | +55.4% |
| Operating profit | 0.04 | 0.06 | +49.1% |
| Net profit | 0.03 | 0.04 | +58.4% |
| Operating cash flow | 0.03 | 0.05 | +64.7% |
| EBITDA margin | 63.0% | 59.5% | -3.5 pp |
| Net margin | 38.5% | 37.1% | -1.4 pp |
Revenue rose 64.6% to USD 115.2m, but gold sales added only 9.0% – the rest came from the metal price
Revenue for the first half of 2026 was USD 115.2m, up 64.6% year-on-year. Gold sales rose only 9.0% to 24,628 oz, while the average realised price increased 50.3% to USD 4,615/oz. Thus the price factor, not higher shipments, drove the growth.
Ore processed rose 10.1% to 498,331 tonnes, ore mined – by 1.7%. The processed grade fell to 1.76 g/t from 2.04 g/t a year earlier, but in the second quarter, after the bridging work was completed, the grade recovered to 1.84 g/t. This means operating metrics are improving but have not yet offset the grade decline in the first quarter.
Silver by-product revenue was USD 1.6m versus USD 0.6m a year earlier. This contribution is small relative to gold, but it also supported revenue.
EBITDA rose 55.4% to USD 68.5m, while the margin fell to 59.5% from 63.0% a year earlier
Adjusted EBITDA rose 55.4% to USD 68.5m, but its margin fell to 59.5% from 63.0% a year earlier. The reason is a 25.5m increase in cost of sales, or 85.6%, to USD 55.3m. More than half of that increase, according to the report, came from tax and non-cash factors as well as higher volumes.
The mineral extraction tax rose by USD 7.0m, of which about 40% is due to higher gold and silver prices and the rest to the higher rate under the new Tax Code from 1 January 2026. Depreciation within cost of sales increased by USD 6.3m to USD 13.3m due to the investment programme. These two items do not depend on operating efficiency and will continue to weigh on the margin.
Additionally, cost of sales was affected by the stronger tenge: the average rate was about KZT 487/USD versus KZT 512 a year earlier, increasing the USD value of tenge-denominated costs by approximately USD 2.2m. The drawdown of ore stockpiles also played a role: processing exceeded mining by 40,130 tonnes, and ore stockpiles fell from USD 27.3m to USD 24.5m, releasing working capital.
Net profit rose 58.4% to USD 42.7m, and one-off items of USD 1.7m did not spoil it
Net profit for the first half of 2026 was USD 42.7m, up 58.4% year-on-year. Operating profit rose 49.1% to USD 55.2m. A reduction in net finance costs to USD 0.2m from USD 2.4m a year earlier supported the result: interest expense fell 23.8% to USD 2.4m, while finance income rose to USD 1.3m.
The report highlights one-off items of USD 1.7m: USD 1.0m for legal and professional fees on possible group reconstruction and a dual listing, and USD 0.7m for tax-related charges. Without them, profit would have been higher, but these amounts are small relative to the overall result.
The effective tax rate was about 22.4% versus the Kazakhstan corporate income tax rate of 20%. Tax payments for the period reached USD 15.6m, including full settlement of the 2025 liability of USD 2.8m and advance payments for 2026, resulting in an income tax recoverable of USD 0.7m.
Operating cash flow rose 64.7% to USD 52.1m, but capex of USD 26.1m and tax of USD 15.6m absorbed almost the entire inflow
Cash generated from operations rose 64.7% to USD 52.1m, including a working capital release of USD 3.6m from lower inventories. However, after tax payments of USD 15.6m, net cash inflow from operating activities was only USD 36.5m, up 19.7% year-on-year. The growth of this metric is noticeably more modest than that of EBITDA due to the sharp increase in tax payments.
Capital expenditure reached USD 26.1m, more than double the level of the first half of 2025 (USD 11.7m) and almost matching USD 28.0m for the whole of 2025. Of this, USD 20.1m was classified as non-sustaining (growth and one-off development) and USD 6.0m as sustaining. Cash outflow on property, plant and equipment, including supplier advances, was USD 37.7m.
As a result, investing activities absorbed USD 36.4m and financing activities USD 11.6m (loan repayments of USD 10.0m and interest of USD 1.7m). Free cash flow after investment and tax was close to zero, which explains why, despite record profit, cash and cash equivalents fell to USD 12.1m from USD 22.7m at the beginning of the year.
Total borrowings decreased by USD 9.8m, or 23.8%, to USD 31.4m compared with USD 41.2m at the end of 2025. Only USD 8.1m falls due within one year. Net debt at 30 June 2026 was USD 19.3m, and the ratio of net debt to last-twelve-months EBITDA was 0.15. This is a low leverage level that gives the company a margin of safety.
The debt reduction occurred despite an accelerated investment programme and tax payments. The company also has access to financing from its principal banker and to the Astana International Exchange if needed. Net finance costs fell to USD 0.2m from USD 2.4m a year earlier, reflecting both the debt reduction and higher finance income.
It is worth noting that net debt at 30 June 2026 compared with 31 December 2025 changed insignificantly: from USD 18.5m to USD 19.3m. However, the net debt/EBITDA LTM ratio fell to 0.15 from 0.18 at the end of 2025 due to the growth in last-twelve-months EBITDA to USD 125.9m.
EV/EBITDA of 3.0 against a three-year average of 152.8 – the market values the company several times cheaper than its own history
The current EV/EBITDA is 3.0, several times lower than the three-year average of 152.8. This discrepancy is explained by the fact that in previous years EBITDA was close to zero or negative, which distorted the multiple. Now, with last-twelve-months EBITDA at USD 125.6m and a market capitalisation of USD 360.4m, the valuation looks very low both by historical standards and in absolute terms.
The trailing P/E is 4.6, which also points to cheapness. Return on equity (ROE) is 48.4%, confirming the high efficiency of the business under current price conditions. However, it is worth considering that profit and EBITDA are at a peak due to record gold prices, and if they decline, the multiples could rise.
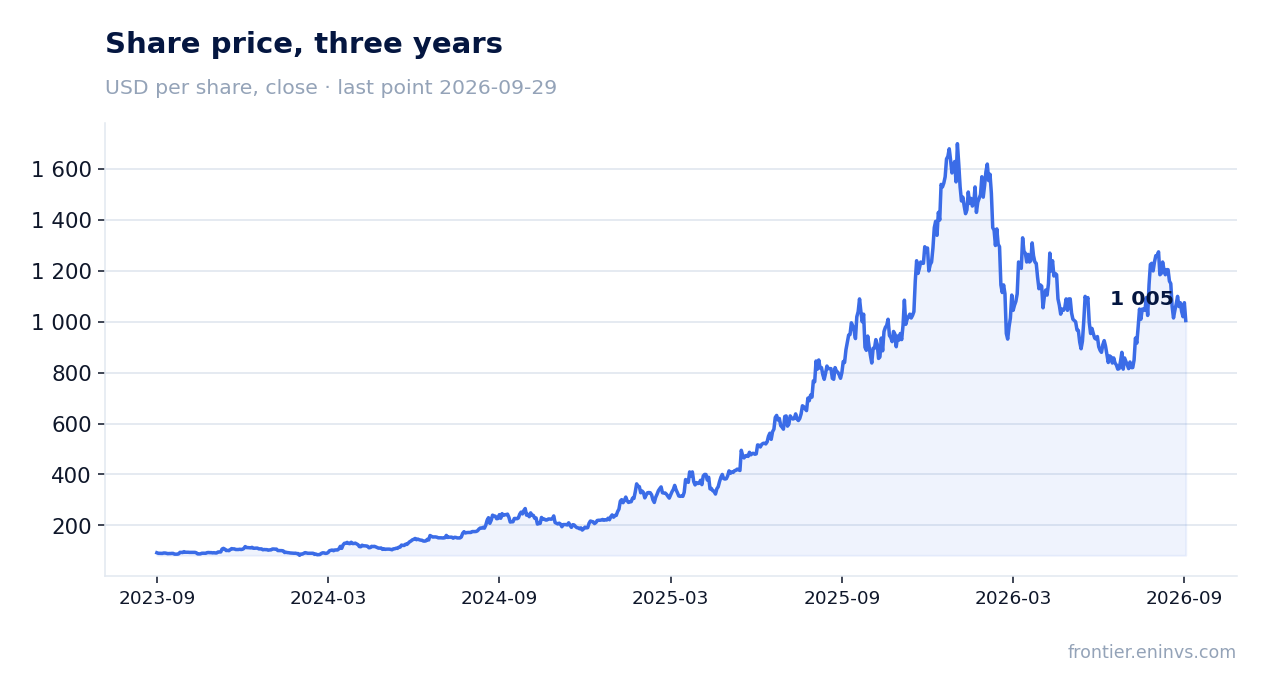
The portal model, which re-prices EBITDA at current commodity prices at the target EV/EBITDA, implies upside to fair value of 56%. This is our own estimate, not a market consensus. It relies on the current gold price environment and stable operations.
The portal model implies 56% upside to the current price, but this is our estimate, not a consensus
Our model, which re-prices EBITDA at current commodity prices at the target EV/EBITDA, shows upside to fair value of 56%. This is solely our estimate, based on current gold prices and operating metrics. It is not an analyst consensus and should not be taken as a guarantee of returns.
The share is held in our live model strategies on the portal, in particular KZ Fundamental potential (AI). This is a fact, not an argument for an investment decision. Inclusion in the strategy reflects compliance with selection criteria but does not replace risk analysis.
The key condition for realising the upside is that gold prices remain at current levels. If prices fall, EBITDA and profit will decline, and the valuation may prove less attractive. It is also important how the company manages cash flow: rising capital expenditure could limit free cash flow.
Valuation on the latest reported figures
| Metric | Value |
|---|---|
| Market cap | 0.36 bn USD |
| P/E (LTM) | 4.6 |
| EV/EBITDA (LTM) | 3.0 |
| P/B | 2.40 |
| Net debt / EBITDA (LTM) | 0.15 |
| Operating cash flow (LTM) | 0.08 bn |
| ROE | 48.4% |
| EV/EBITDA, 3-year average | 152.8 |
Bottom line
The first half of 2026 was a record for AltynGold: revenue, EBITDA and net profit reached historical highs. However, two-thirds of the growth came from the gold price, not volumes, and the margin declined due to taxes and depreciation. The company maintains low leverage (net debt/EBITDA 0.15) and high return on equity (ROE 48.4%), but free cash flow after investment and tax is close to zero. The valuation at EV/EBITDA 3.0 against a three-year average of 152.8 looks extremely low, and the portal model implies 56% upside. At the current price the share looks attractive, but the key question remains the sustainability of gold prices.
Open the company's financial profile ALTYNGOLD →
See also: market overview · valuation map · stock screeners