KEGC: H1 revenue up 31%, but Q2 net profit barely changed year-on-year
15 августа 2026 года KEGC опубликовала промежуточную консолидированную финансовую отчётность за первое полугодие 2026 года. Выручка за полугодие выросла на 31% год к году до 240,1 млрд тенге, EBITDA – на 37% до 100,2 млрд тенге, чистая прибыль – на 59% до 54,6 млрд тенге. Однако во втором квартале 2026 года чистая прибыль составила 21,3 млрд тенге, что лишь на 2% выше уровня годичной давности, а квартальная выручка выросла на 19,5%. При текущей цене акция выглядит привлекательно: мультипликатор EV/EBITDA LTM составляет 4,8, что ниже среднего за три года, дивидендная доходность превышает 10%, а модель портала оценивает потенциал роста в 62%.
Key takeaways
— H1 revenue grew 31% to KZT 240.1bn, but Q2 growth slowed to 19.5%
— H1 EBITDA increased 37% to KZT 100.2bn, margin at 41.7%
— H1 net profit rose 59% to KZT 54.6bn, but Q2 growth nearly stalled
— H1 operating cash flow reached KZT 81.6bn, up 17% year-on-year
— Net debt rose KZT 22.8bn in the quarter and KZT 34.3bn over the year, to KZT 104.5bn
— EV/EBITDA LTM is 4.8, below the three-year average, dividend yield at 10.9%
— Portal model implies 62% upside for the share
Attractiveness
Key figures, KZT bn
| Metric | — | Q2 2026 | Change |
|---|---|---|---|
| Revenue | — | 114 | — |
| EBITDA | — | 42.2 | — |
| Operating profit | — | 28.1 | — |
| Net profit | — | 21.3 | — |
| Operating cash flow | — | 37.8 | — |
| EBITDA margin | — | 37.1% | — |
| Net margin | — | 18.7% | — |
H1 revenue grew 31% to KZT 240.1bn, but Q2 growth slowed to 19.5%
For H1 2026, KEGC's revenue reached KZT 240.1bn, up 31% from KZT 183.1bn in the same period last year. The main contribution came from Q2: revenue for April–June hit KZT 113.6bn, up 19.5% year-on-year. In Q1 2026, growth was stronger at 43.6%.
The slowdown in Q2 reflects a high base effect: in Q3 2025 revenue grew 20% year-on-year, while in Q1 2025 it was only 3.4%. Still, the absolute revenue level remains high, supported by tariff increases and higher electricity transmission volumes.
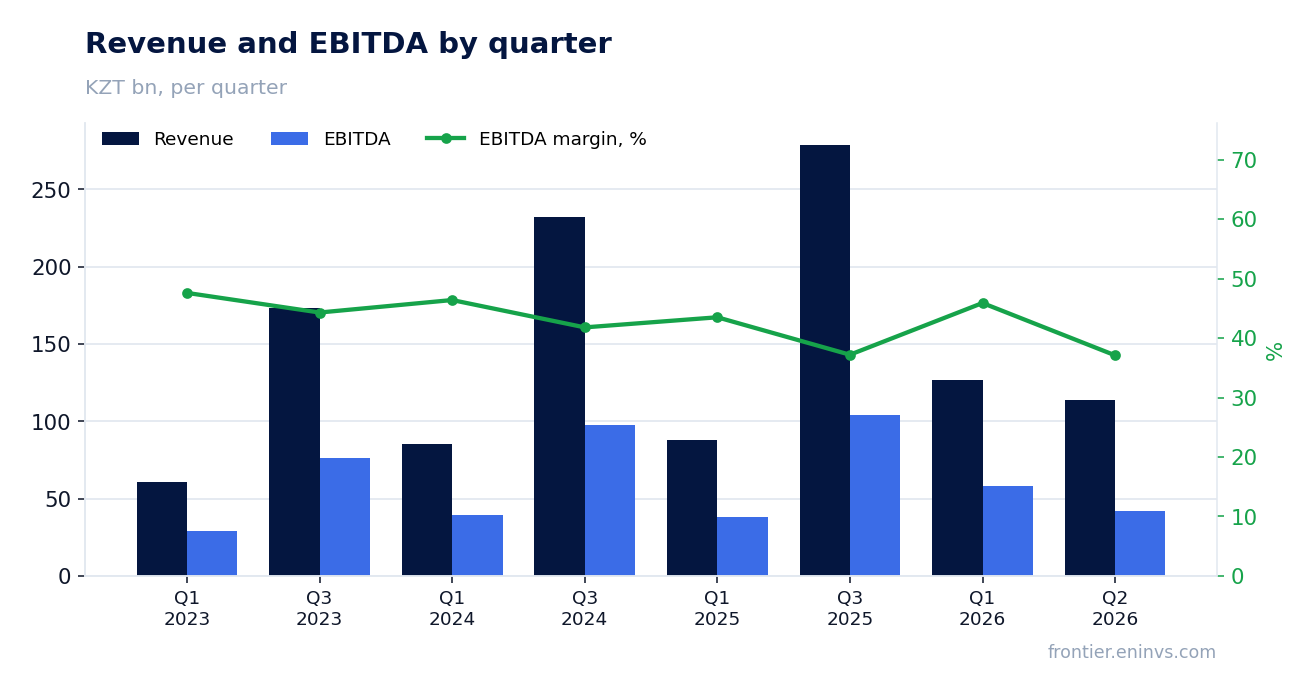
H1 EBITDA increased 37% to KZT 100.2bn, margin at 41.7%
H1 2026 EBITDA rose to KZT 100.2bn from KZT 73.1bn a year earlier, up 37%. The EBITDA margin for the half-year was 41.7%, above last year's 39.9%. In Q2 2026, EBITDA was KZT 42.2bn, with a margin of 37.1%.
EBITDA growth was driven by revenue outpacing operating costs. In the half-year report, cost of sales rose 15.8% to KZT 152.6bn, while revenue grew 31%, leading to margin expansion.
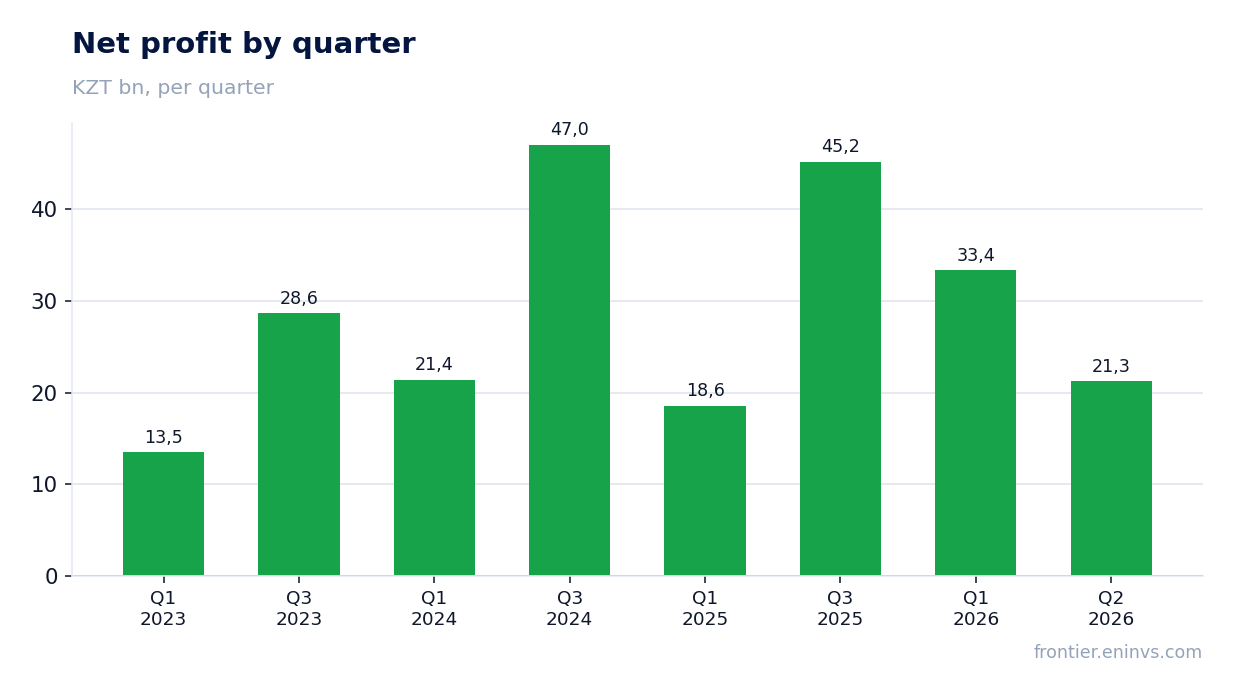
H1 net profit rose 59% to KZT 54.6bn, but Q2 growth nearly stalled
H1 2026 net profit was KZT 54.6bn, up 59% from KZT 34.3bn in H1 2025. However, in Q2 2026 net profit was only KZT 21.3bn, up just 2% year-on-year (vs KZT 20.9bn in Q2 2025).
The quarterly dynamics reflect one-off items: in Q2 2026 the company recognised a revaluation loss on property, plant and equipment of KZT 11.5bn and a reversal of a previous revaluation loss of KZT 3.5bn. Excluding these items, operating profit would have grown more, but net profit would still lag revenue growth due to higher finance costs.
H1 operating cash flow reached KZT 81.6bn, up 17% year-on-year
Operating cash flow for H1 2026 was KZT 81.6bn versus KZT 69.7bn a year earlier. The increase was driven by higher pre-tax profit and a positive contribution from working capital changes, although tax and interest payments rose.
In Q2 2026, operating cash flow was KZT 37.8bn, down 6.6% from KZT 40.5bn in Q2 2025. This reflects seasonal working capital movements, notably higher receivables and inventories.
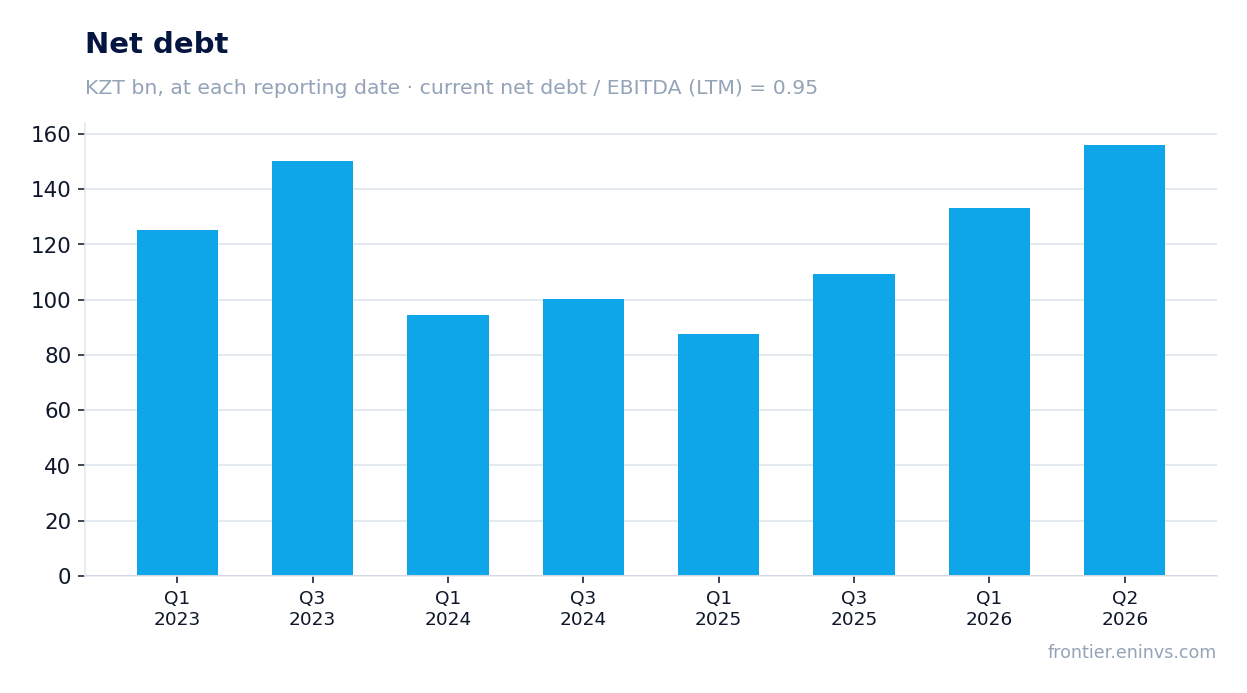
Net debt rose KZT 22.8bn in the quarter and KZT 34.3bn over the year, to KZT 104.5bn
As of end-June 2026, KEGC's net debt stood at KZT 104.5bn, up KZT 22.8bn from the previous reporting date and KZT 34.3bn over the last 12 months. The increase is related to financing the capital expenditure programme and dividend payments.
The net debt to LTM EBITDA ratio is 0.95, a moderate level for an infrastructure company. Finance costs for the half-year rose to KZT 11.0bn from KZT 10.2bn a year earlier, reflecting higher debt.
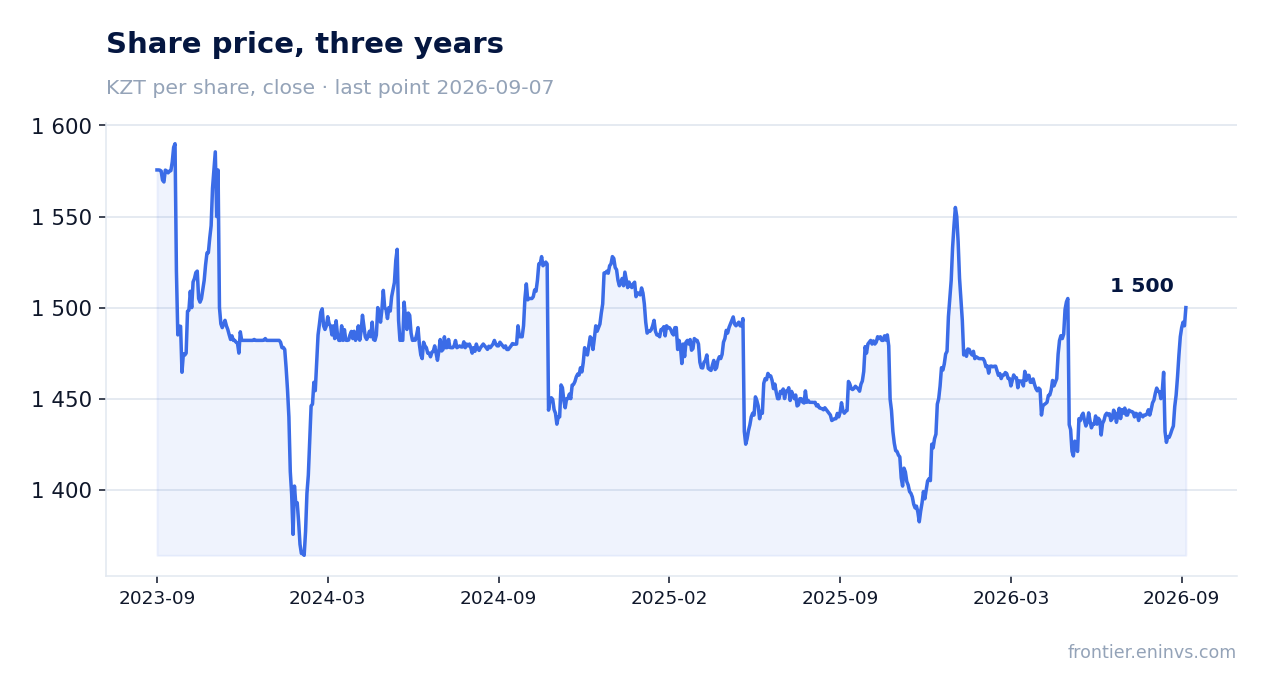
EV/EBITDA LTM is 4.8, below the three-year average, dividend yield at 10.9%
KEGC's current market capitalisation is KZT 419.6bn. The EV/EBITDA LTM multiple is 4.8, below the three-year average, which we estimate at around 5.5. P/E LTM is 7.3, also not high for a company with growing revenue and stable margins.
The trailing twelve-month dividend yield is 10.9%, well above the market average. This makes the share attractive for income-oriented investors.
Portal model implies 62% upside for the share
According to our value-creation model, which uses EBITDA growth and a target multiple, the fair value of KEGC's share is 62% above the current market price. This is a calculation based on the portal's model, not a market consensus or a target price.
The share is held in our strategies 'Frontier AI Selection' and 'KZ Fundamental potential (AI)'. This is a statement of fact: inclusion in the strategies is not a recommendation but reflects the share meeting certain screening criteria.
Valuation on the latest reported figures
| Metric | Value |
|---|---|
| Market cap | 420 bn KZT |
| P/E (LTM) | 7.3 |
| EV/EBITDA (LTM) | 4.8 |
| P/B | 0.53 |
| Net debt / EBITDA (LTM) | 0.95 |
| Operating cash flow (LTM) | 131 bn |
| ROE | 16.4% |
| Dividend yield (12m) | 10.9% |
Bottom line
The H1 2026 report shows strong revenue and EBITDA growth, supported by tariff dynamics and cost control. H1 net profit rose 59%, but Q2 growth nearly stalled due to one-off revaluation items and higher finance costs. Debt remains moderate at 0.95x EBITDA, and a dividend yield above 10% makes the share attractive for income investors. At the current price, the share looks attractive: multiples are below historical averages, and the portal model indicates significant upside potential. The key question for holders is whether the company can sustain revenue growth and margins amid rising investments and debt.
Open the company's financial profile KEGC →
See also: market overview · valuation map · stock screeners