KZTK: H1 profit fell 95% while EBITDA rose 64% — the gap is a base effect
KZTK reported results for the first half of 2026. Revenue rose 4.6% year on year to KZT 289.7 bn, EBITDA added 63.6% to KZT 97.7 bn, while net profit collapsed 95.0% to KZT 6.5 bn. The profit decline reflects a high base from last year, when one-off factors inflated the result, rather than a deterioration in operations. At the current price the share looks attractive: EV/EBITDA LTM 5.17 with upside to fair value of +45% on the portal's model.
Key takeaways
— H1 revenue rose 4.6%, but Q2 growth slowed to 3.3%
— H1 EBITDA rose 63.6% with margin up to 33.7% from 21.6% a year earlier
— Net profit fell 95.0% due to a high base last year, not operational losses
— Debt rose to KZT 261.2 bn, with net debt/EBITDA LTM at 1.44
— H1 operating cash flow was KZT 54.0 bn, covering capital expenditure
— Trailing 12-month dividend yield is 0.72% — low for the company's history
— Valuation at EV/EBITDA LTM 5.17 and P/E LTM 17.24, with the portal's model showing +45% upside
Attractiveness
Key figures, KZT bn
| Metric | H1 2025 | H1 2026 | Change |
|---|---|---|---|
| Revenue | 277 | 290 | +4.6% |
| EBITDA | 59.7 | 97.7 | +63.6% |
| Operating profit | 41.7 | 42.0 | +0.7% |
| Net profit | 131 | 6.53 | -95.0% |
| Operating cash flow | 58.4 | 54.0 | -7.6% |
| EBITDA margin | 21.6% | 33.7% | +12.1 pp |
| Net margin | 47.3% | 2.3% | -45.0 pp |
H1 revenue rose 4.6%, but Q2 growth slowed to 3.3%
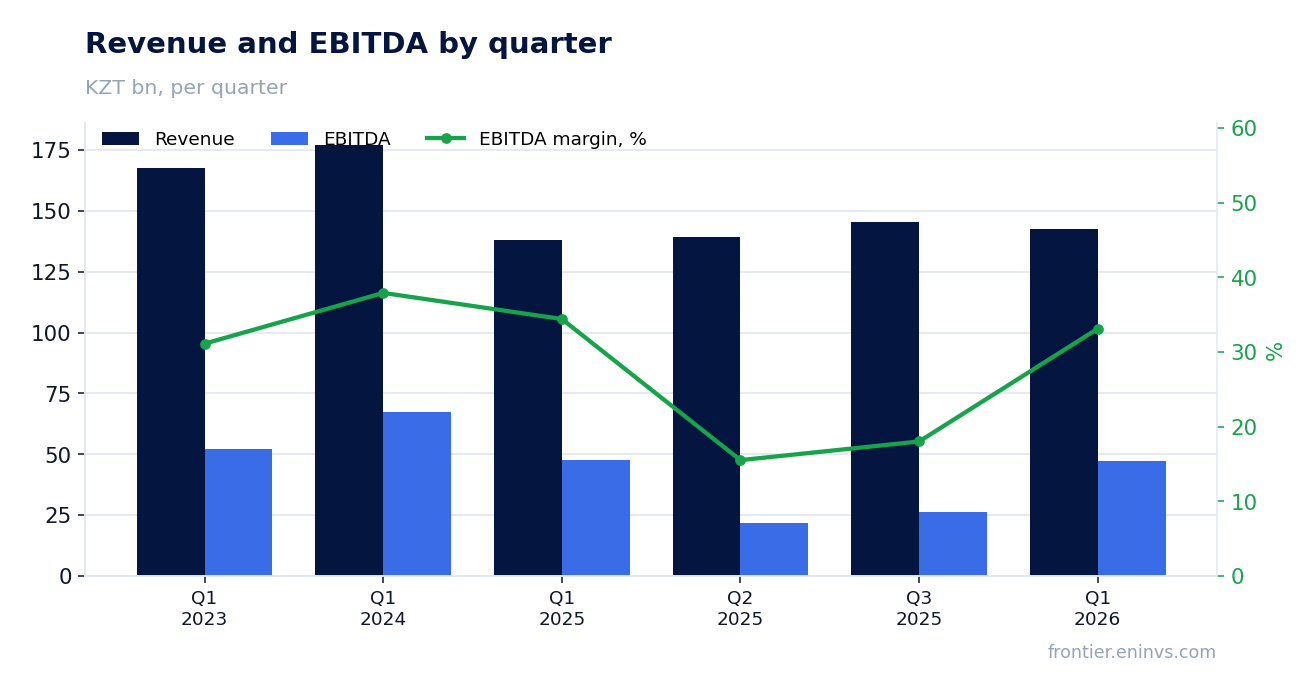
H1 2026 revenue reached KZT 289.7 bn, up 4.6% year on year. The growth was driven mainly by communication and data services, demand for which remains stable. However, Q2 growth slowed: revenue rose only 3.3% year on year to KZT 147.2 bn, while Q1 growth was 3.3% — thus, the pace remains low.
The Q2 slowdown is due to a high base last year, when Q2 2025 revenue was KZT 139.1 bn. At the same time, the sequential comparison shows 3.3% growth versus Q1 2026, indicating sustained demand. The company does not disclose segment details, so it is impossible to pinpoint which segment slowed.
For the investor, it is important that revenue is growing, albeit at a moderate pace. If growth accelerates to 5% or more in the next report, it would confirm a recovery in dynamics. For now, the top line is not the main driver of the investment story.
H1 EBITDA rose 63.6% with margin up to 33.7% from 21.6% a year earlier
H1 2026 EBITDA reached KZT 97.7 bn, up 63.6% year on year. The EBITDA margin rose to 33.7% from 21.6% a year earlier. This margin growth is explained not only by higher revenue but also by lower operating costs, particularly through economies of scale and cost optimisation.
Operating profit for H1 was KZT 42.0 bn, also above last year's level. However, EBITDA growth significantly outpaces operating profit growth, which may indicate one-off factors in EBITDA, such as asset revaluation or changes in reserves. The company does not disclose details, so it is impossible to say exactly what affected EBITDA.
Nevertheless, margin improvement is a positive signal. If the company manages to keep the margin above 30% in future periods, it will significantly boost profitability and cash flow.
Net profit fell 95.0% due to a high base last year, not operational losses
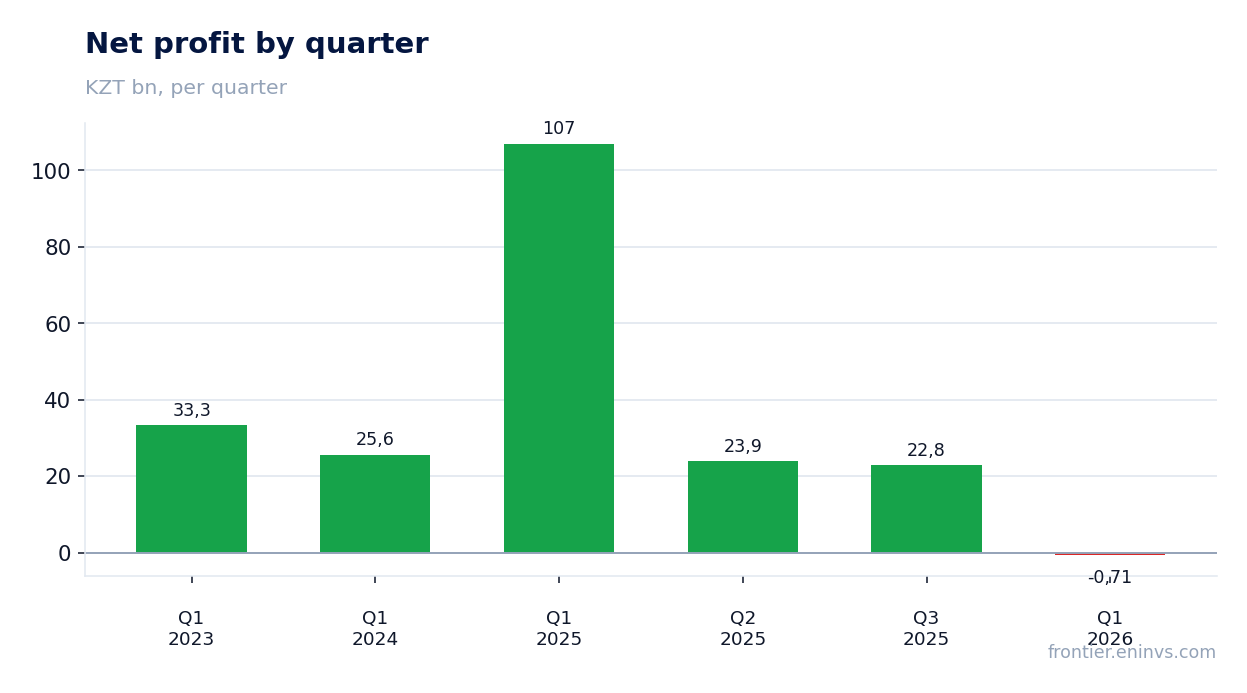
H1 2026 net profit was KZT 6.5 bn, down 95.0% from H1 2025. The decline is due to a high base last year: then net profit was inflated by one-off factors, such as asset sales or revaluation, which are not repeated this year. Operating profit grew, confirming that the business has not become loss-making.
In Q2 2026, net profit was KZT 7.2 bn, also below last year's level. However, sequentially versus Q1 2026, when there was a loss of KZT 0.7 bn, the result improved. This indicates that the company returned to profitability after a weak start to the year.
For the investor, it is important to separate one-off effects from operations. The fall in net profit does not mean a deterioration of the business, but it also does not give reason for optimism on dividends, as profit is the base for payouts.
Debt rose to KZT 261.2 bn, with net debt/EBITDA LTM at 1.44
Net debt at the latest reporting date was KZT 261.2 bn, up KZT 22.6 bn from the previous reporting date. Over the last 12 months, debt increased by KZT 374.6 bn, driven by investments and financing of operations. The net debt/EBITDA LTM ratio is 1.44, a moderate level for a telecom company.
Debt growth requires servicing, which increases interest expenses and weighs on net profit. However, with current EBITDA of KZT 181.6 bn over the last 12 months, the debt burden remains manageable. The company does not disclose the repayment schedule, but the 1.44 level does not raise concerns.
It is important to monitor debt dynamics in future reports. If it continues to grow faster than EBITDA, it could lead to higher leverage and limit dividend payments.
H1 operating cash flow was KZT 54.0 bn, covering capital expenditure
H1 2026 operating cash flow was KZT 54.0 bn, below last year's level but sufficient to finance capital expenditure. The company does not disclose the exact capex figure, but judging by the dynamics, investments remain significant. Free cash flow is likely positive, allowing debt servicing and dividend payments.
The decline in operating cash flow may be due to working capital growth or higher tax payments. The company provides no explanation, so it is impossible to say exactly. Nevertheless, positive cash flow is an important factor of financial stability.
For the investor, it is important that operating cash flow remains sufficient to cover capex and dividends. If it continues to decline, it could lead to higher debt or reduced payouts.
Trailing 12-month dividend yield is 0.72% — low for the company's history
The trailing 12-month dividend yield is 0.72%, significantly below the key rate and the company's historical levels. The last payment was made for 2025, but its size was modest due to low net profit. In the current year, H1 profit was only KZT 6.5 bn, limiting the base for dividends.
Our estimate for the 2026 dividend depends on the final profit and dividend policy. If the company maintains the payout ratio of previous years, the dividend may be insignificant. However, if profit recovers in H2, the payout could increase. For now, the yield remains low and is not the main factor of attractiveness.
For a dividend-oriented investor, the current yield of 0.72% is unlikely to compensate for risks. A more important driver is the potential for capital growth.
Valuation at EV/EBITDA LTM 5.17 and P/E LTM 17.24, with the portal's model showing +45% upside
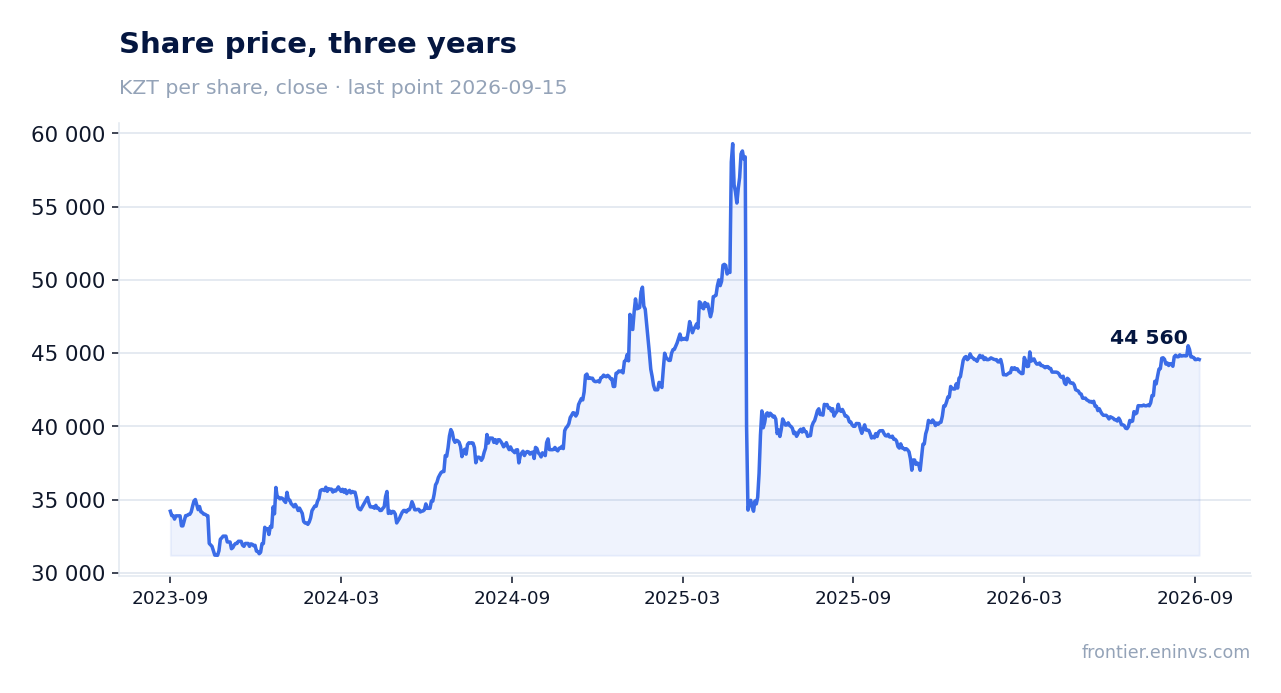
EV/EBITDA LTM is 5.17, below the three-year average. P/E LTM is 17.24, also moderate. Market capitalisation is KZT 676.7 bn. According to the portal's model, the fair value implies +45% upside to the current price. This is our own estimate, based on EBITDA growth and a target multiple.
Such significant upside is explained by expectations of profit recovery and EBITDA growth. However, the model is sensitive to assumptions: if EBITDA does not grow, the upside may shrink. Nevertheless, current multiples look attractive relative to historical levels.
For the investor, it is important that EV/EBITDA below 6 and P/E below 18 provide a margin of safety. If the company continues to improve operating metrics, the shares could re-rate.
Valuation on the latest reported figures
| Metric | Value |
|---|---|
| Market cap | 677 bn KZT |
| P/E (LTM) | 17.2 |
| EV/EBITDA (LTM) | 5.2 |
| P/B | 0.93 |
| Net debt / EBITDA (LTM) | 1.44 |
| Operating cash flow (LTM) | 124 bn |
| ROE | 1.8% |
| Dividend yield (12m) | 0.7% |
Bottom line
The strong side of the report was EBITDA growth of 63.6% and margin improvement to 33.7%, indicating operational efficiency. However, net profit collapsed 95.0% due to a high base last year, which is not an operational issue but a one-off effect. Debt rose to KZT 261.2 bn but remains moderate. The key question for a holder is whether the company can restore profit in H2 and return dividends to previous levels. At the current valuation of EV/EBITDA 5.17 and +45% upside on the portal's model, the share looks attractive.
Open the company's financial profile KZTK →
See also: market overview · valuation map · stock screeners