MX_ASUR: revenue up 9.9% but EBITDA down 7.6% as margin contracts 9.2 pp

On August 25, MX_ASUR reported results for the second quarter of 2026. Revenue rose 9.9% year-on-year to 9,578.964 million MXN, net profit added 1.2% to 2,296.406 million MXN, but EBITDA fell 7.6% to 4,642.551 million MXN, and the EBITDA margin dropped to 48.5% from 57.7% a year earlier. At the current price, the shares look neutral: revenue growth is not converting into profit due to margin compression, while leverage at 1.11 times LTM EBITDA and a 9.4% dividend yield do not provide a clear edge.
Key takeaways
— Revenue grew 9.9% year-on-year, but EBITDA fell 7.6% as margin contracted to 48.5% from 57.7%
— Net profit added just 1.2% year-on-year as revenue growth failed to offset the decline in operating profitability
— Leverage stands at 1.11 times LTM EBITDA, with net debt at 15,138.319 million MXN at quarter-end
— Dividend yield over the trailing 12 months is 9.4%, above the yield on most debt instruments
— EV/EBITDA LTM is 7.36, below the three-year average of 8.78 – the stock trades cheaper than its own history
— The portal's model values fair value 8% below the current market price
Attractiveness
Key figures, MXN bn
| Metric | Q2 2025 | Q2 2026 | Change |
|---|---|---|---|
| Revenue | 8.72 | 9.58 | +9.9% |
| EBITDA | 5.02 | 4.64 | -7.6% |
| Operating profit | 4.41 | 3.89 | -11.9% |
| Net profit | 2.27 | 2.30 | +1.2% |
| Operating cash flow | 2.66 | 3.61 | +35.8% |
| Capex | 1.39 | — | — |
| EBITDA margin | 57.7% | 48.5% | -9.2 pp |
| Net margin | 26.0% | 24.0% | -2.0 pp |
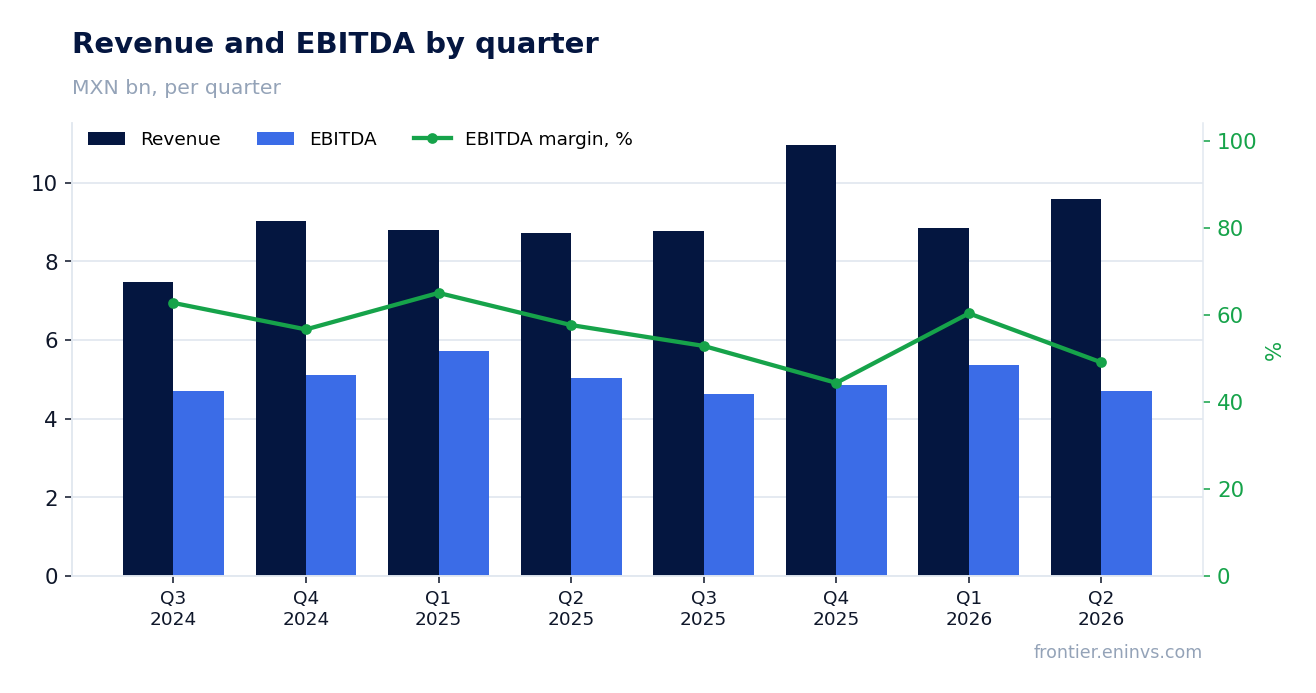
Revenue grew 9.9% year-on-year, but EBITDA fell 7.6% as margin contracted to 48.5% from 57.7%
In the second quarter of 2026, MX_ASUR's revenue reached 9,578.964 million MXN, up 9.9% year-on-year. This marks a notable acceleration from 0.8% growth in the first quarter of 2026, but is weaker than the 17.9% seen a year earlier. The growth appears to have been driven by operating segments, though detailed segment breakdown is not available in the provided data.
At the same time, EBITDA fell 7.6% year-on-year to 4,642.551 million MXN. The EBITDA margin dropped to 48.5% from 57.7% in the second quarter of 2025. This divergence between revenue growth and EBITDA decline points to faster growth in costs, which are not disclosed in the facts. This is the key negative of the report.
Net profit added just 1.2% year-on-year as revenue growth failed to offset the decline in operating profitability
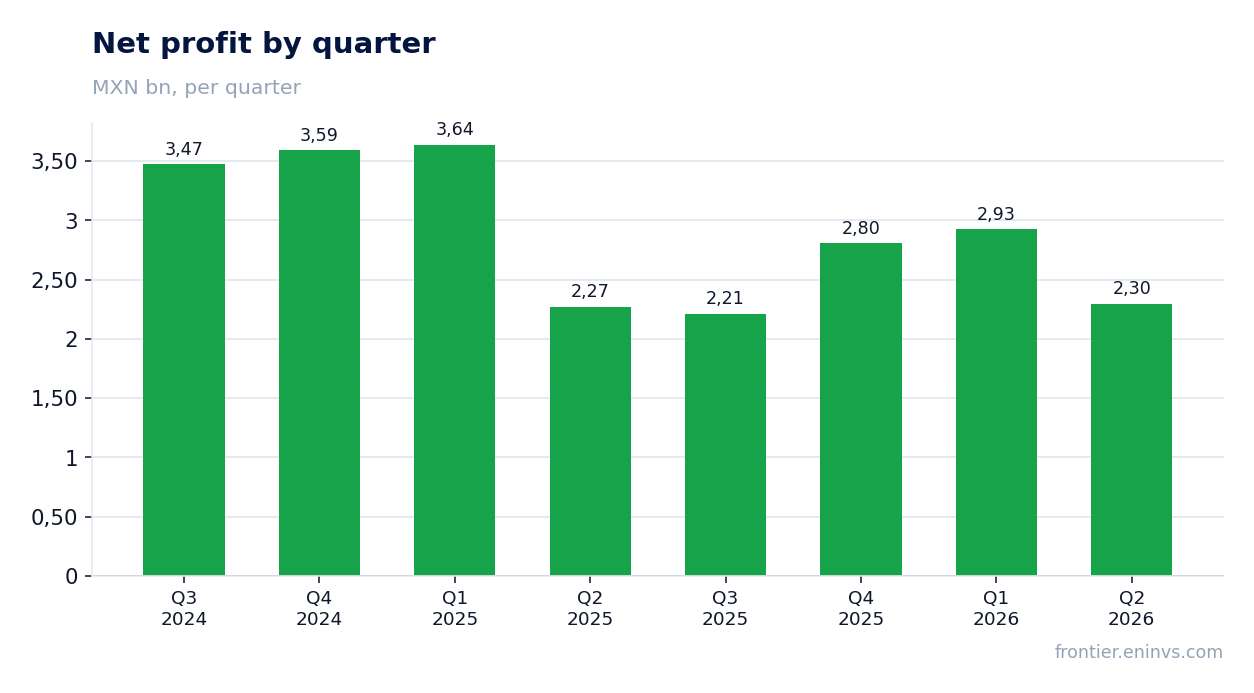
Net profit in the second quarter of 2026 was 2,296.406 million MXN, up 1.2% from 2,270.182 million MXN a year earlier. Profit growth was minimal despite near double-digit revenue growth. This is explained by operating profit falling to 3,890.078 million MXN from 4,414.008 million MXN a year earlier.
The net margin declined to 24.0% from 26.0% a year earlier. Thus, the company failed to maintain operating efficiency at last year's level, leading to stagnant net profit. The report does not disclose any one-off factors that could explain this change.
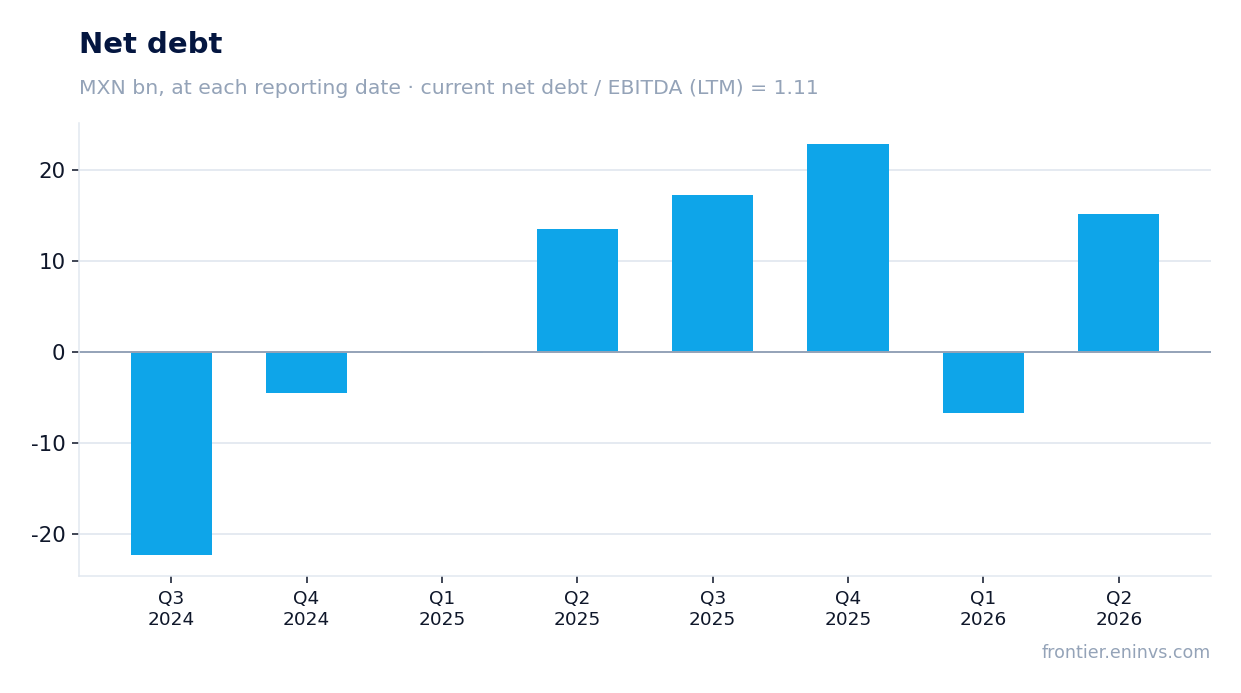
Leverage stands at 1.11 times LTM EBITDA, with net debt at 15,138.319 million MXN at quarter-end
Net debt at the end of the second quarter of 2026 was 15,138.319 million MXN, corresponding to a net debt to LTM EBITDA ratio of 1.11. This is a moderate leverage level that does not raise concerns. For comparison, at the end of the first quarter of 2026, net debt was negative at -6,776.799 million MXN, meaning the company moved from a net cash position to net debt.
Operating cash flow for the quarter was 3,614.694 million MXN, slightly above 2,661.640 million MXN a year earlier. This cash flow is sufficient to service debt, but it does not cover capital expenditures, which were significant in previous quarters. Overall, leverage remains manageable, but its increase during the quarter warrants attention.
Dividend yield over the trailing 12 months is 9.4%, above the yield on most debt instruments
MX_ASUR's dividend yield over the trailing 12 months is 9.4%. This is a high figure, making the stock attractive for income-oriented investors. However, the facts do not specify which dividend was paid and for which period, so the sustainability of payments cannot be assessed.
At the current share price and market capitalisation of 128,805.0 million MXN, dividend payments constitute a significant portion of shareholder returns. If the company maintains the current payout level, the yield will remain attractive. Nevertheless, the decline in EBITDA and uncertainty around profit could pose risks to future dividends.
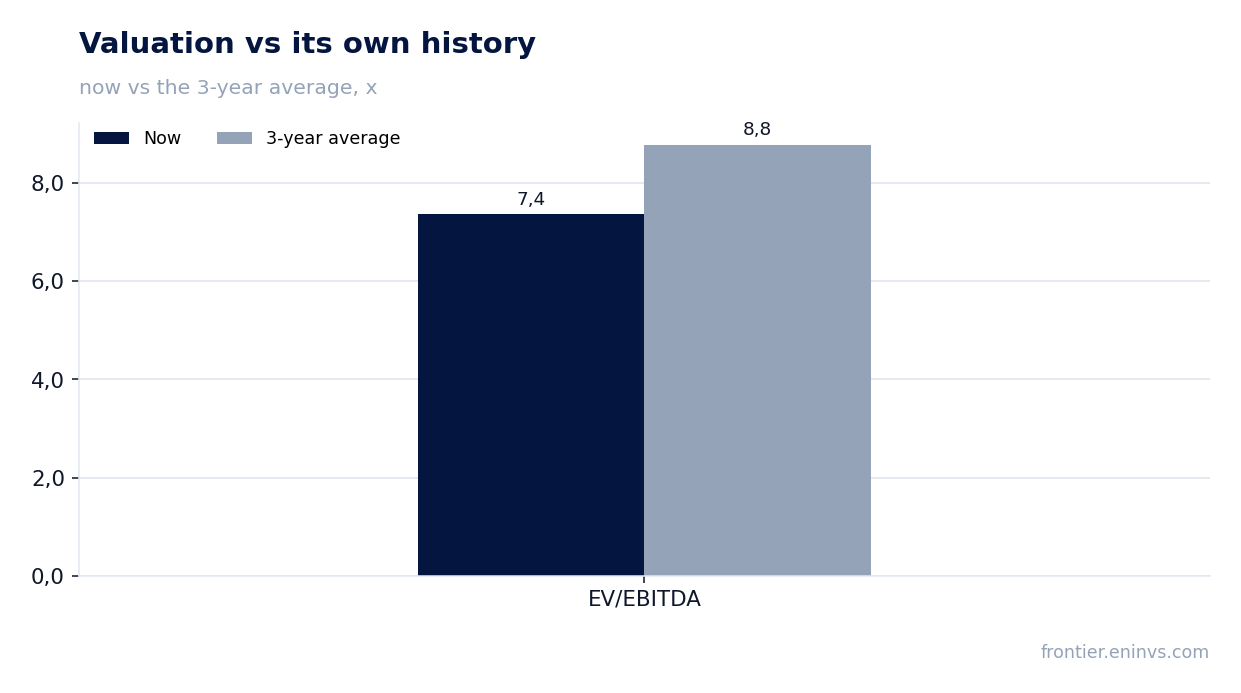
EV/EBITDA LTM is 7.36, below the three-year average of 8.78 – the stock trades cheaper than its own history
The current EV/EBITDA LTM multiple is 7.36, below the three-year average of 8.78. This indicates that the stock trades cheaper than its average over the past three years. The P/E LTM ratio is 12.58, which may also be considered low, although no historical comparison for this multiple is provided in the facts.
The decline in the multiple relative to its historical average could be due to both falling EBITDA and share price dynamics. Given that EBITDA over the trailing twelve months was 20,619.3 million MXN and market capitalisation is 128,805.0 million MXN, the current valuation appears moderate. However, if the margin continues to decline, the multiple could rise even if the price remains unchanged.
The portal's model values fair value 8% below the current market price
According to the portal's model, the fair value of MX_ASUR shares is 8% below the current market price. This means that, in our assessment, the stock trades at a slight premium to fair value. The model takes into account EBITDA growth, the target multiple, and current market capitalisation.
Thus, upside potential is limited, and the current price does not offer a significant margin of safety. This supports a neutral view on the stock, despite the attractive dividend yield and the low EV/EBITDA multiple relative to history.
Valuation on the latest reported figures
| Metric | Value |
|---|---|
| Market cap | 129 bn MXN |
| P/E (LTM) | 12.6 |
| EV/EBITDA (LTM) | 7.4 |
| P/B | 2.78 |
| Net debt / EBITDA (LTM) | 1.11 |
| Operating cash flow (LTM) | 23.4 bn |
| ROE | 21.9% |
| Dividend yield (12m) | 9.4% |
| EV/EBITDA, 3-year average | 8.8 |
Bottom line
In the second quarter of 2026, MX_ASUR showed revenue growth of 9.9%, but EBITDA fell 7.6% and net profit rose only 1.2%. The compression of the EBITDA margin to 48.5% from 57.7% is the main negative. Leverage at 1.11 times LTM EBITDA and a 9.4% dividend yield partially offset this, but the portal's model indicates 8% downside from the current price. Overall, the stock looks neutral: revenue growth is not converting into profit, and the valuation does not provide a clear edge.
Open the company's financial profile ASUR →
See also: market overview · valuation map · stock screeners