Grupo Carso: Q2 revenue rose 3.9%, but profit was carried by financial income, not operations

On August 25, Grupo Carso released its results for the second quarter of 2026. Revenue rose 3.9% year on year to MXN 48,194.4 mn, EBITDA fell 1.3% to MXN 6,213.8 mn, and net profit added 10.6% to MXN 2,964.0 mn. The profit gain came from financial income and a low base rather than from operations, so with EV/EBITDA at 16.6 against its own three-year average of 11.3 the share looks neutral.
Key takeaways
— Revenue rose 3.9% year on year, but this is a recovery after a 4.3% decline a quarter earlier
— EBITDA fell 1.3% and the margin compressed to 16.0% from 16.8% a year earlier
— Net profit rose 10.6%, but operating profit fell 19.8%
— Financial income grew tenfold to MXN 2,902.1 mn and is the main source of profit growth
— Operating cash flow for the quarter was MXN 3,898.1 mn, while capital expenditure was MXN 3,188.5 mn
— Net debt fell to MXN 16,901.0 mn, and net debt/EBITDA LTM stands at 0.79
— EV/EBITDA at 16.6 against its own three-year average of 11.3 — the stock trades above its history
Attractiveness
Key figures, MXN bn
| Metric | Q2 2025 | Q2 2026 | Change |
|---|---|---|---|
| Revenue | 46.4 | 48.2 | +3.9% |
| EBITDA | 7.79 | 7.69 | -1.3% |
| Operating profit | 4.46 | 4.47 | +0.3% |
| Net profit | 2.68 | 2.96 | +10.6% |
| Operating cash flow | 6.78 | 3.90 | -42.5% |
| EBITDA margin | 16.8% | 16.0% | -0.8 pp |
| Net margin | 5.8% | 6.2% | +0.4 pp |
Revenue rose 3.9% year on year, but this is a recovery after a 4.3% decline a quarter earlier
In the second quarter of 2026, Grupo Carso's revenue was MXN 48,194.4 mn, up 3.9% from a year earlier. This is the first quarterly growth after a 4.3% decline in Q1 2026 and a 7.1% drop in Q4 2025. Thus, the current growth is more a recovery after two quarters of decline than an acceleration.
For comparison: in Q1 2026 revenue was MXN 44,107.2 mn, and in Q2 2025 it was MXN 46,369.5 mn. Quarter-on-quarter growth was 9.3%, partly due to seasonality. Year-on-year growth is modest at 3.9% and does not offset the decline of previous quarters.
Revenue dynamics remain weak against the high base of 2024, when quarterly revenue reached MXN 59,075.8 mn in Q4. The current revenue level is 18.4% below the peak, indicating continued pressure on the business.
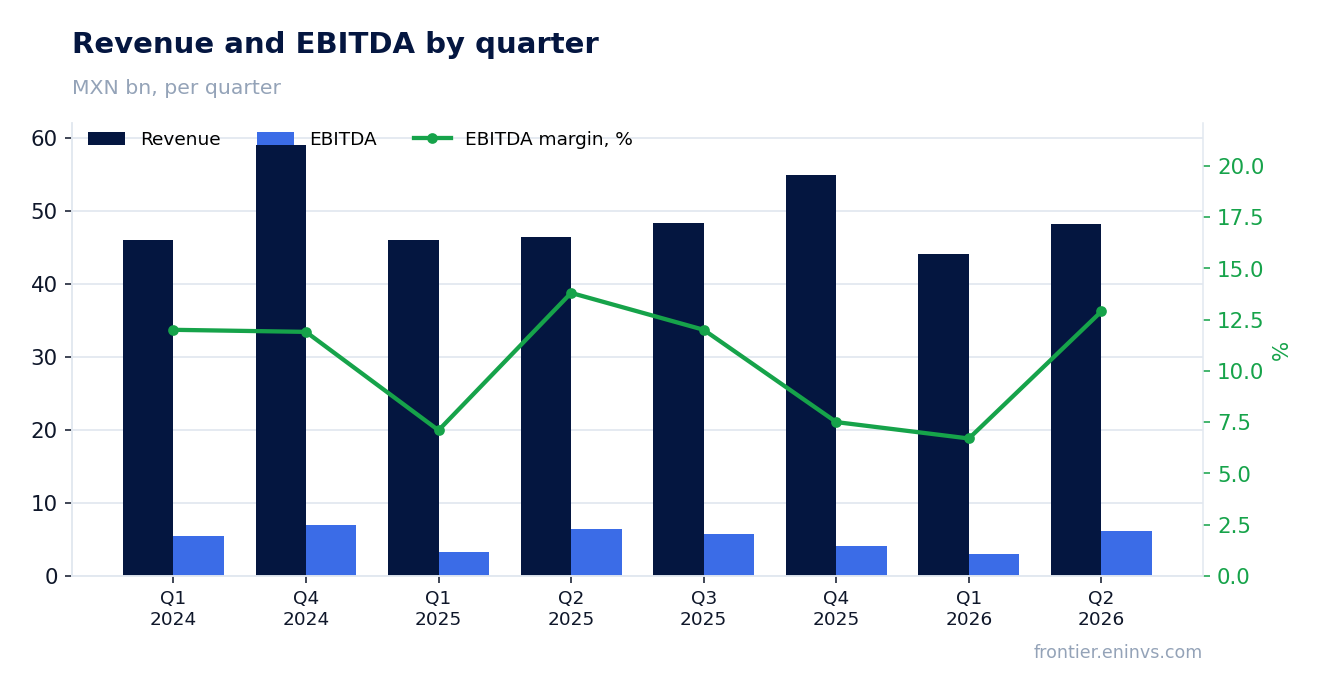
EBITDA fell 1.3% and the margin compressed to 16.0% from 16.8% a year earlier
EBITDA in Q2 2026 was MXN 6,213.8 mn, down 1.3% from a year earlier. The EBITDA margin fell to 16.0% from 16.8% in the same period last year. A margin decline alongside revenue growth means costs are rising faster than income.
Operating profit fell more significantly — by 19.8% to MXN 4,469.8 mn, compared with MXN 5,578.0 mn a year earlier. The gap between EBITDA and operating profit dynamics is explained by higher depreciation and other operating expenses. The Q1 2026 report shows administrative expenses rose to MXN 2,191.9 mn from MXN 1,895.8 mn a year earlier, indicating pressure on operating efficiency.
Margin compression is a key negative in the report. While in Q1 2026 the EBITDA margin was 6.7%, in Q2 it recovered to 12.9%, but still below last year's levels. The company has not yet demonstrated a sustainable improvement in profitability.
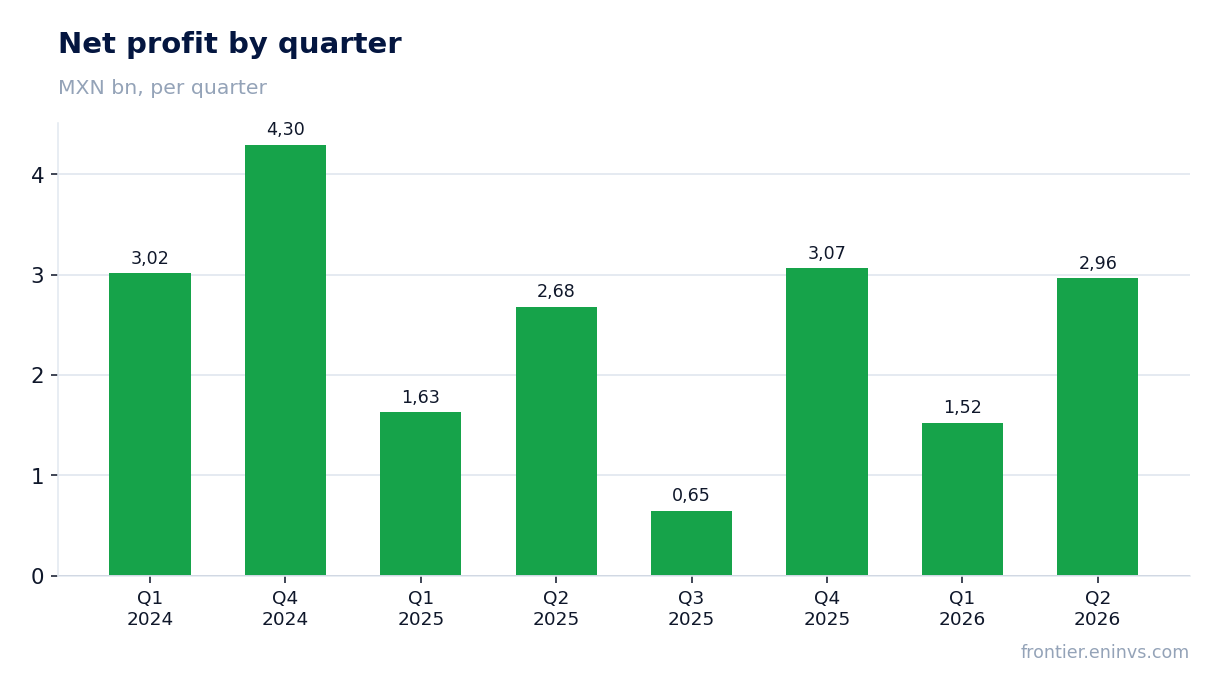
Net profit rose 10.6%, but operating profit fell 19.8%
Net profit in Q2 2026 was MXN 2,964.0 mn, up 10.6% from a year earlier. However, this growth was not driven by operations: operating profit fell 19.8% to MXN 4,469.8 mn. The gap is explained by financial income and one-off tax savings.
In Q1 2026 net profit was MXN 1,523.7 mn, and in Q2 2025 it was MXN 2,679.0 mn. Year-on-year growth looks positive, but it is not supported by an improvement in operating metrics. Earnings per share in Q1 2026 was MXN 0.68 versus MXN 0.72 a year earlier, reflecting pressure on profitability.
Thus, net profit growth is more a result of financial engineering and a low base than business improvement. For sustainable profit growth, the company needs to restore operating efficiency.
Financial income grew tenfold to MXN 2,902.1 mn and is the main source of profit growth
Financial income in Q1 2026 was MXN 2,902.1 mn versus MXN 278.0 mn a year earlier — more than a tenfold increase. This is the key factor behind net profit growth despite the fall in operating profit. Financial expenses also rose to MXN 3,698.7 mn from MXN 1,065.6 mn, but the net financial result remained positive.
Such growth in financial income may be related to foreign exchange differences or investment income. The Q1 2026 report states that financial income includes interest income and other financial receipts. However, the sustainability of this source is questionable — it may be one-off.
For the investor, it is important that profit growth is not supported by operations. If financial income declines, net profit may return to a decline. This makes the quality of earnings low.
Operating cash flow for the quarter was MXN 3,898.1 mn, while capital expenditure was MXN 3,188.5 mn
Operating cash flow in Q2 2026 was MXN 3,898.1 mn, significantly better than the negative value in Q1 (-MXN 357.6 mn). However, this is not enough to cover capital expenditure, which in Q1 2026 was MXN 3,188.5 mn. As a result, free cash flow remains under pressure.
Over the last 12 months, operating cash flow was MXN 31,100.0 mn, which covers capital expenditure, but its volume is growing. In Q1 2026, capital expenditure rose to MXN 3,188.5 mn from MXN 1,732.2 mn a year earlier — almost double. This may be related to business development investments.
The growth in capital expenditure amid weak operating cash flow limits the company's ability to pay dividends and reduce debt. In Q1 2026, dividends amounted to MXN 48.8 mn, which is insignificant relative to the scale of the business.
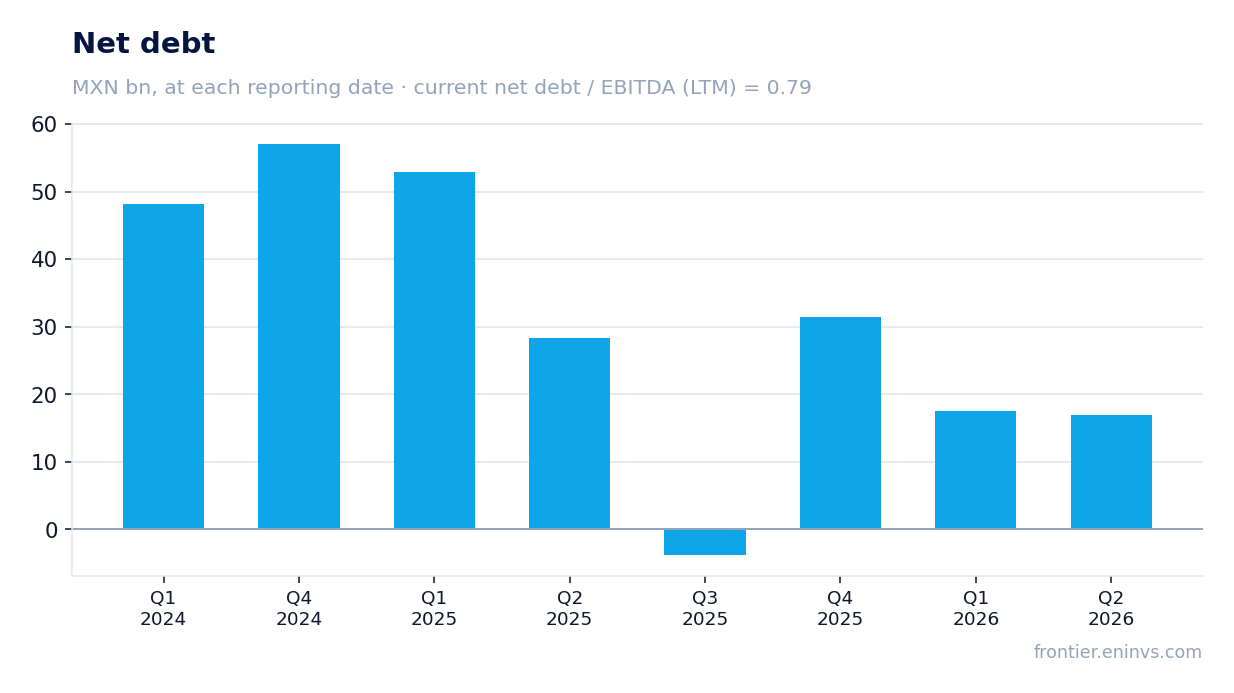
Net debt fell to MXN 16,901.0 mn, and net debt/EBITDA LTM stands at 0.79
Net debt at the end of Q2 2026 was MXN 16,901.0 mn, down from MXN 17,543.5 mn in Q1 2026. The net debt/EBITDA LTM ratio is 0.79 — a moderate level of leverage. The decline in debt for the quarter was MXN 0.6 bn, and over 12 months — MXN 11.4 bn.
The debt reduction occurs amid rising capital expenditure, which may indicate asset sales or improved working capital management. In Q1 2026, the company raised borrowings of MXN 13,185.6 mn and repaid MXN 9,975.2 mn, resulting in a net inflow from financing activities of MXN 2,065.0 mn.
The debt level is not a concern, but its reduction is not a consequence of improved operations. To further reduce debt, the company needs to increase operating profit and cash flow.
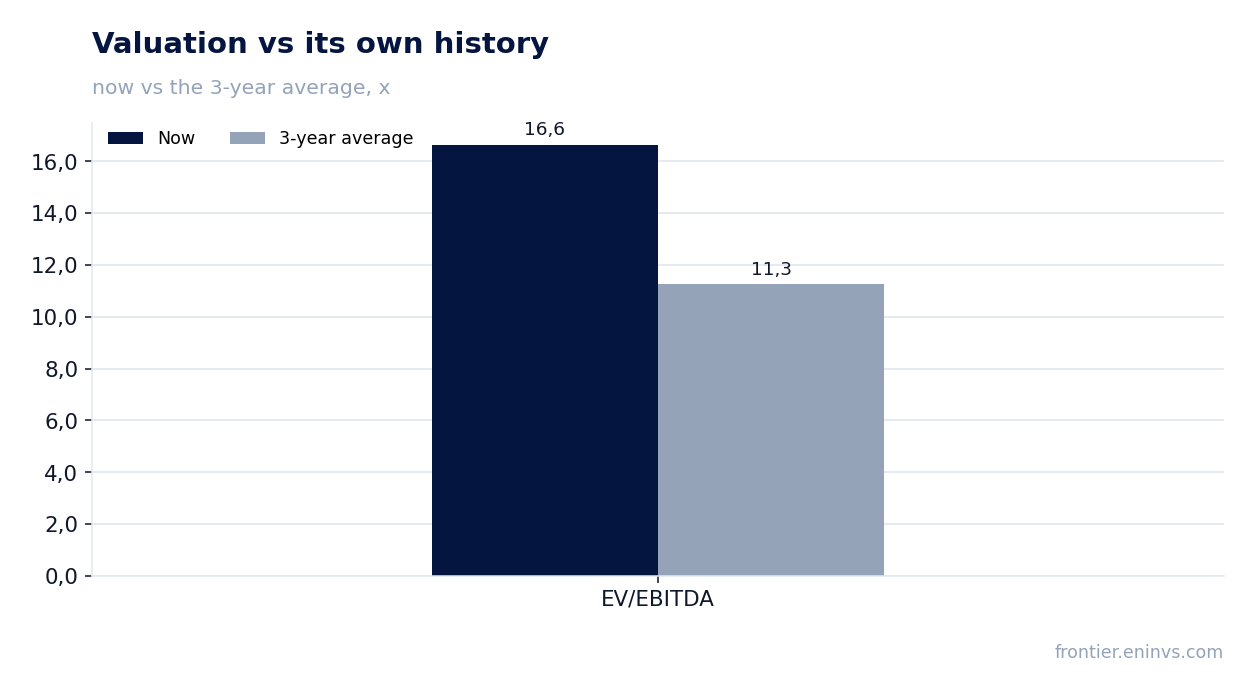
EV/EBITDA at 16.6 against its own three-year average of 11.3 — the stock trades above its history
The current EV/EBITDA LTM multiple is 16.6, significantly above its own three-year average of 11.3. This means the stock trades at a premium to its historical valuation. At the same time, P/E LTM is 36.6, also indicating a high valuation relative to earnings.
The company's market capitalisation is MXN 300,180.5 mn. With EBITDA LTM of MXN 18,943.3 mn and net debt of MXN 16,901.0 mn, EV/EBITDA is indeed 16.6. For comparison: at the three-year average multiple of 11.3, the fair value of the share would be significantly lower.
According to the portal's model, the fundamental value of the share implies an upside of +9% to the current price. This is a moderate upside that does not compensate for the risks associated with earnings quality and weak operating metrics. The dividend yield over the last 12 months is 1.15%, which is below the key rate and does not make the stock attractive for income investors.
Valuation on the latest reported figures
| Metric | Value |
|---|---|
| Market cap | 300 bn MXN |
| P/E (LTM) | 36.6 |
| EV/EBITDA (LTM) | 16.6 |
| P/B | 2.07 |
| Net debt / EBITDA (LTM) | 0.79 |
| Operating cash flow (LTM) | 31.1 bn |
| ROE | 8.8% |
| Dividend yield (12m) | 1.1% |
| EV/EBITDA, 3-year average | 11.3 |
Bottom line
The strengths of the report are revenue growth of 3.9% and a reduction in net debt to MXN 16,901.0 mn with a net debt/EBITDA ratio of 0.79. However, profit growth of 10.6% was driven by financial income, not operations: operating profit fell 19.8%, and the EBITDA margin compressed to 16.0%. Earnings quality is low, and the EV/EBITDA multiple of 16.6 against its own three-year average of 11.3 indicates overvaluation. With a portal-model upside of only +9% and a dividend yield of 1.15%, the share looks neutral. For the valuation to improve, the company needs to restore operating efficiency and sustainable profit growth.
Open the company's financial profile CARSO →
See also: market overview · valuation map · stock screeners