Cemex: Q2 revenue up 12.2%, but EBITDA margin compressed to 19.6%
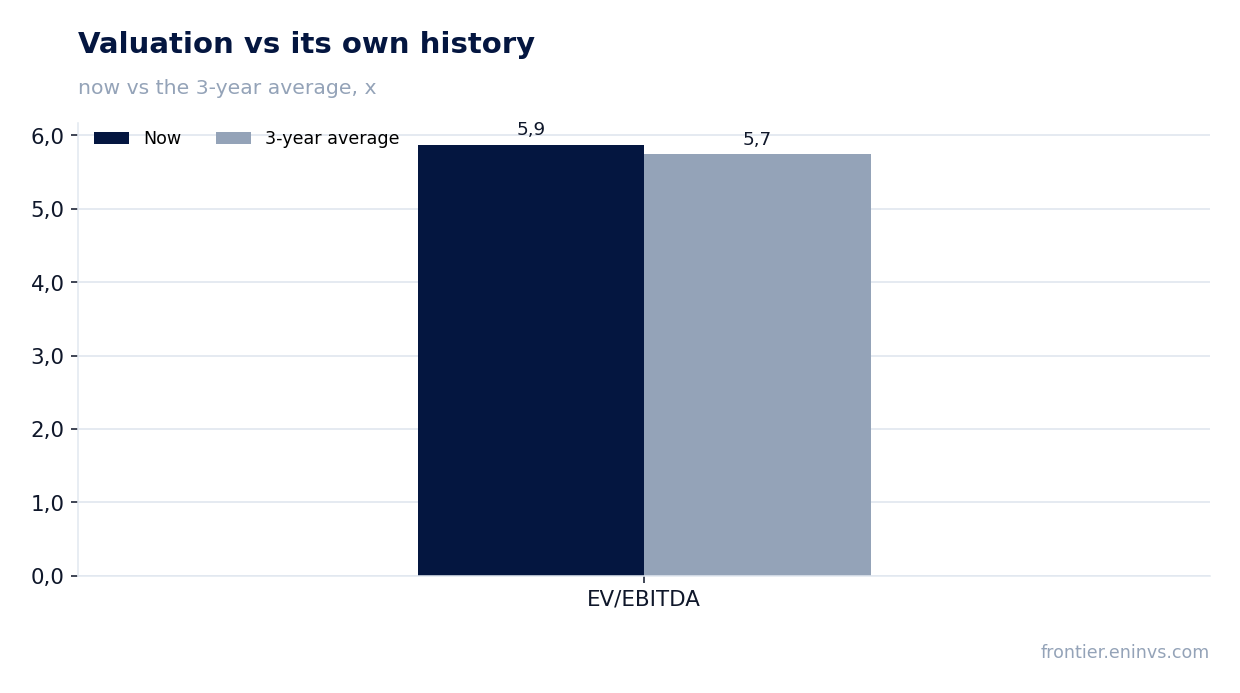
Cemex reported Q2 2026 results. Revenue rose 12.2% year-on-year to $4,593.4 million, EBITDA grew 6.6% to $1,018.3 million, and net profit increased 9.0% to $346.6 million. However, EBITDA margin declined to 19.6% from 20.6% a year earlier. At the current price, the stock looks neutral: EV/EBITDA of 5.87x is slightly above its own three-year average of 5.74x, and revenue growth is not accompanied by margin improvement.
Key takeaways
— Q2 revenue rose 12.2% year-on-year to $4,593.4 million, but EBITDA margin fell to 19.6% from 20.6%
— Q2 EBITDA grew 6.6% year-on-year to $1,018.3 million, lagging revenue growth
— Q2 net profit increased 9.0% year-on-year to $346.6 million, with a net margin of 7.5%
— Leverage remains moderate: net debt/EBITDA for the trailing twelve months is 0.87x
— Operating cash flow for the trailing twelve months was $2,000.0 million, supporting dividend payments
— Dividend yield for the trailing twelve months is 1.3%, below the yield on alternative investments
— EV/EBITDA of 5.87x is slightly above its own three-year average of 5.74x, offering no clear advantage
Attractiveness
Key figures, USD bn
| Metric | Q2 2025 | Q2 2026 | Change |
|---|---|---|---|
| Revenue | 4.09 | 4.59 | +12.2% |
| EBITDA | 0.84 | 0.90 | +6.6% |
| Operating profit | 0.49 | 0.68 | +37.6% |
| Net profit | 0.32 | 0.35 | +9.0% |
| Operating cash flow | 0.36 | 0.75 | +107.5% |
| EBITDA margin | 20.6% | 19.6% | -1.0 pp |
| Net margin | 7.8% | 7.5% | -0.3 pp |
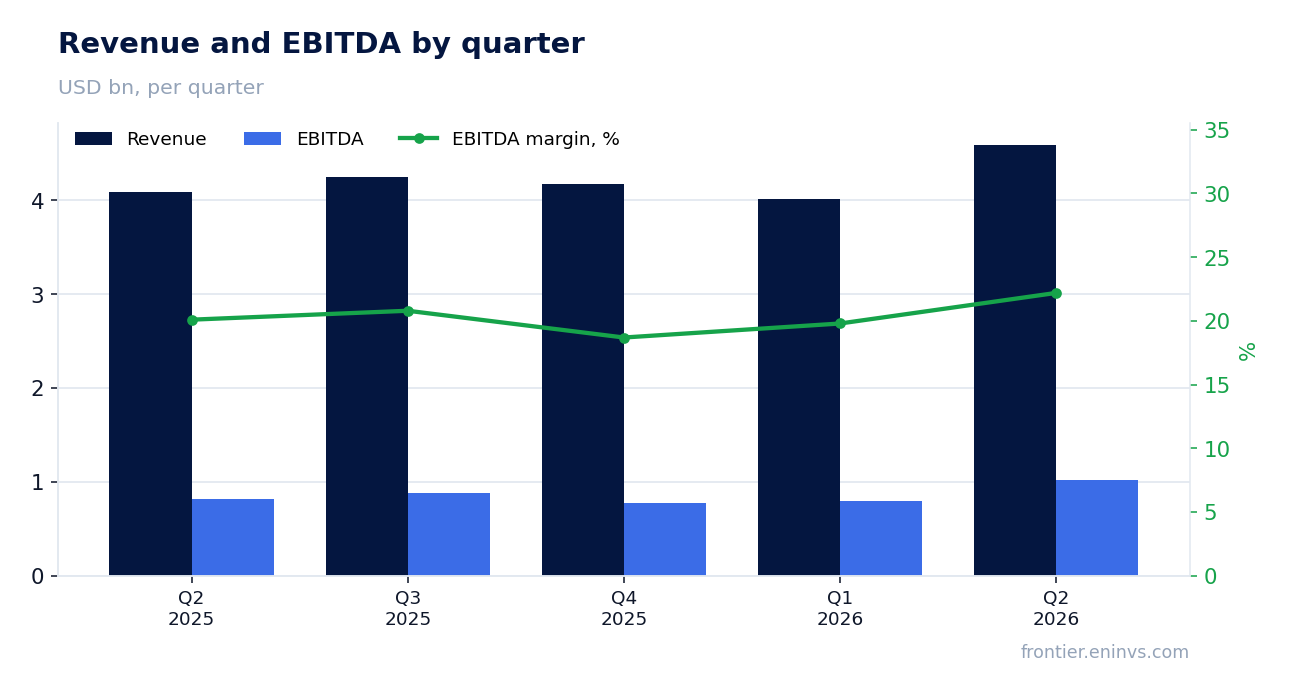
Q2 revenue rose 12.2% year-on-year to $4,593.4 million, but EBITDA margin fell to 19.6% from 20.6%
Cemex's Q2 2026 revenue reached $4,593.4 million, up 12.2% year-on-year. This is a notable acceleration from previous quarters: Q1 2026 revenue was $4,019.0 million, Q4 2025 was $4,179.8 million. The growth is likely driven by higher sales volumes or cement prices, but the exact cause is not disclosed in the provided data.
However, EBITDA margin fell to 19.6% from 20.6% in Q2 2025. This means costs grew faster than revenue. EBITDA increased only 6.6% year-on-year to $1,018.3 million, while revenue rose 12.2%. This gap points to cost pressure, possibly from energy or logistics, but specific factors are not detailed in the report.
The margin decline alongside revenue growth is the key takeaway. If the company cannot restore profitability, revenue growth will translate less into profit. In the next quarter, watch cost dynamics and the ability to pass cost increases on to customers.
Q2 EBITDA grew 6.6% year-on-year to $1,018.3 million, lagging revenue growth
Q2 2026 EBITDA was $1,018.3 million, up 6.6% from Q2 2025. For comparison, Q1 2026 EBITDA was $794.0 million, Q4 2025 was $781.0 million. There is growth, but it significantly lags the 12.2% revenue increase.
This lag is explained by faster growth in operating expenses. Q2 operating profit was $680.6 million versus $494.5 million a year earlier, up 37.6%. This is higher than EBITDA growth, which may indicate lower depreciation or a change in cost structure. However, without a detailed breakdown, the exact cause cannot be identified.
EBITDA for the trailing twelve months was $3,040.8 million. This metric is important for assessing debt burden and dividend sustainability. If the margin continues to decline, annual EBITDA could come under pressure, affecting the ability to service debt and pay dividends.
Q2 net profit increased 9.0% year-on-year to $346.6 million, with a net margin of 7.5%
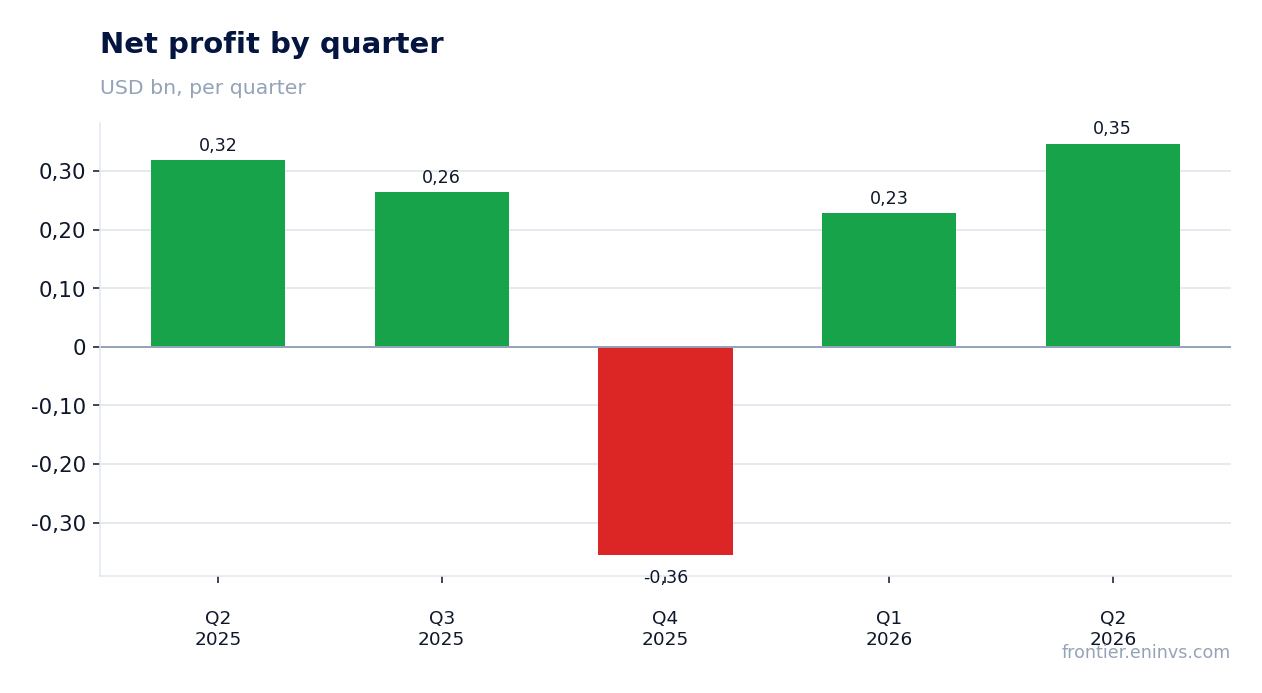
Cemex's Q2 2026 net profit was $346.6 million, up 9.0% year-on-year. Net margin declined to 7.5% from 7.8% in Q2 2025. This decline is smaller than the EBITDA margin drop, which may be due to one-off factors or changes in tax burden.
Net profit for the trailing twelve months was $482.7 million. This includes a Q4 2025 loss of $355.7 million, likely due to one-off write-offs or impairments. Without this loss, annual profit would be significantly higher. It is important to understand that one-off factors can distort the assessment of profit sustainability.
Net profit growth of 9.0% despite a lower EBITDA margin suggests the company partially offset operational pressure through other items, possibly lower interest expenses or tax optimization. However, the sustainability of this trend is questionable.
Leverage remains moderate: net debt/EBITDA for the trailing twelve months is 0.87x
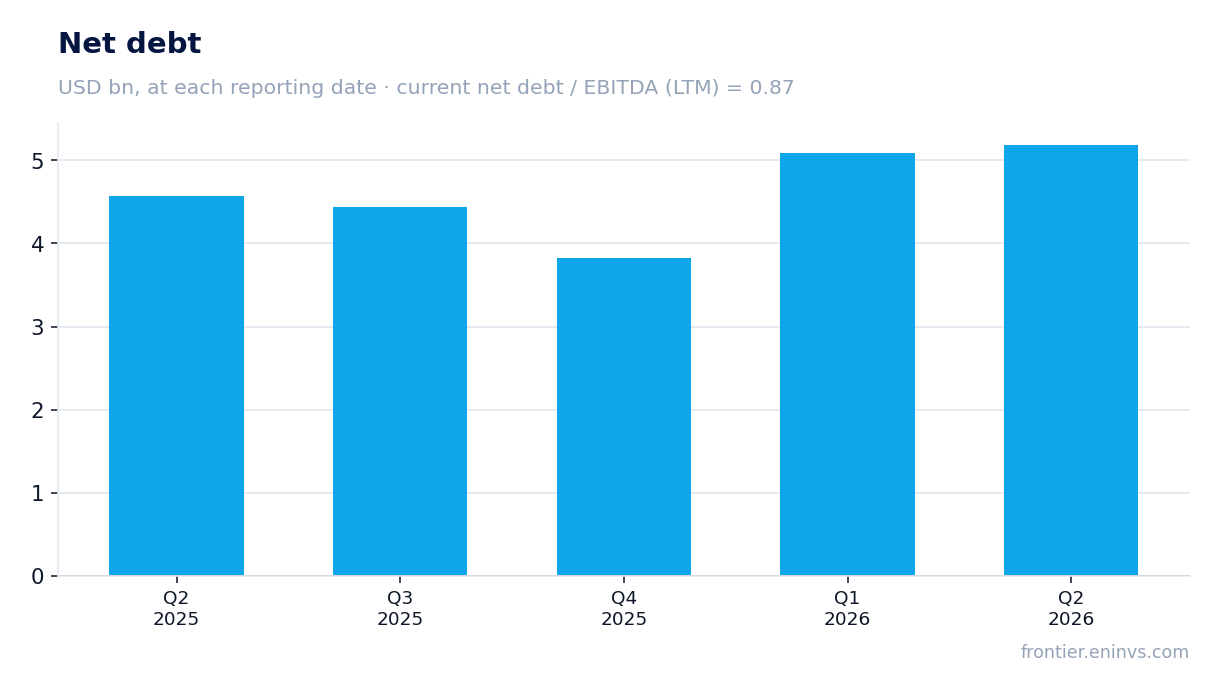
Cemex's net debt at the latest reporting date was $2,635.0 million. The net debt/EBITDA ratio for the trailing twelve months is 0.87x. This is a moderate level that does not raise concerns. However, the facts do not provide the previous value of this ratio, so it cannot be stated whether leverage has decreased or increased.
Absolute net debt increased by 0.6 billion rubles over 12 months (the currency in the facts is USD, but the change is given in rubles, which may be a technical detail). Rising debt with stable EBITDA could lead to a higher ratio if EBITDA does not grow. For now, the 0.87x level remains comfortable.
Interest expenses are not disclosed in the facts, but at this leverage level they are likely not critical. In the next report, watch the dynamics of net debt and EBITDA to see if the current leverage level is maintained.
Operating cash flow for the trailing twelve months was $2,000.0 million, supporting dividend payments
Cemex's operating cash flow for the trailing twelve months was $2,000.0 million. This is a substantial amount that covers capital expenditures and dividends. In Q2 2026, operating cash flow was $749.3 million, significantly higher than in Q1 (141.0 million) and Q2 2025 (361.1 million).
Capital expenditures are only given for Q1 2026 in the facts – $145.0 million. If this level is extrapolated for the year, capex could be around $580 million, well below operating cash flow. This leaves room for dividends and debt reduction. However, without data for other quarters, the exact annual figure is unknown.
Dividend yield for the trailing twelve months is 1.3%. At the current share price, this is a low level that may not attract income-oriented investors. However, stable operating cash flow allows the company to maintain payments.
Dividend yield for the trailing twelve months is 1.3%, below the yield on alternative investments
Cemex's dividend yield for the trailing twelve months is 1.3%. This is lower than the yield on many debt instruments and is unlikely to attract income-oriented investors. The company is not a high-yield dividend story.
The facts do not provide the dividend per share or payout ratio, so it is impossible to assess what share of profit the company allocates to dividends. However, with net profit for the trailing twelve months of $482.7 million and a market capitalisation of $15,225.9 million, a 1.3% dividend yield corresponds to annual payments of about $198 million. This is roughly 41% of net profit, a moderate level.
If profit remains under pressure due to margin decline, the company may maintain or increase the dividend, but growth in payments is unlikely. For income-oriented investors, this stock is not attractive.
EV/EBITDA of 5.87x is slightly above its own three-year average of 5.74x, offering no clear advantage
Cemex's EV/EBITDA multiple currently stands at 5.87x. This is slightly above its own three-year average of 5.74x. Thus, the stock is valued a bit more expensively than its average over the past three years. This offers no clear advantage for buying.
For comparison, the P/E for the trailing twelve months is 31.5x, which is a high level. However, this may be distorted by the one-off loss in Q4 2025. Without it, profit would be higher and P/E lower. EV/EBITDA is more stable as it does not account for one-off write-offs.
According to the portal's model, the upside to fair value is +4%. This is a very modest potential that does not justify aggressive buying. Given the current valuation and margin pressure, the stock looks neutral.
Valuation on the latest reported figures
| Metric | Value |
|---|---|
| Market cap | 15.2 bn USD |
| P/E (LTM) | 31.5 |
| EV/EBITDA (LTM) | 5.9 |
| P/B | 1.18 |
| Net debt / EBITDA (LTM) | 0.87 |
| Operating cash flow (LTM) | 2.00 bn |
| ROE | 10.8% |
| Dividend yield (12m) | 1.3% |
| EV/EBITDA, 3-year average | 5.7 |
Bottom line
Cemex showed 12.2% revenue growth in Q2, but EBITDA margin fell to 19.6%, indicating cost pressure. Net profit rose 9.0%, but the annual figure is distorted by a one-off loss in Q4. Leverage remains moderate, and operating cash flow is sufficient to cover capex and dividends. However, dividend yield is only 1.3%, and EV/EBITDA is slightly above its own three-year average. The stock looks neutral: revenue growth is not accompanied by improved efficiency, and the portal model's upside is only +4%.
Open the company's financial profile CEMEX →
See also: market overview · valuation map · stock screeners