MX_GAP: double-digit profit growth, but quarterly cash flow nearly dried up
MX_GAP reported second-quarter 2026 results. Revenue grew 3.7% year-on-year, EBITDA rose 8.4%, net profit increased 9.0%, and the EBITDA margin reached 52.8%. However, operating cash flow for the quarter was only MXN 2,637.0 million versus MXN 4,379.7 million a year earlier, while net debt rose to MXN 45,893.6 million. With an EV/EBITDA of 9.9 against its own three-year average of 12.7 and the portal model indicating –3% upside, the stock looks neutral: profitability is strong, but cash flow and leverage are concerning.
Key takeaways
— Revenue grew 3.7% year-on-year, but quarterly operating cash flow fell more than 40%
— EBITDA margin rose to 52.8% as EBITDA grew faster than revenue
— Net profit increased 9.0% year-on-year, but the quarterly result was lower than the previous quarter
— Net debt rose to MXN 45,893.6 million, with net debt/EBITDA LTM at 1.61 – a moderate level
— EV/EBITDA of 9.9 is below its own three-year average of 12.7, indicating undervaluation on this multiple
— The portal model estimates –3% upside to fair value, implying no significant growth
Attractiveness
Key figures, MXN bn
| Metric | Q2 2025 | Q2 2026 | Change |
|---|---|---|---|
| Revenue | 10.9 | 11.3 | +3.7% |
| EBITDA | 5.50 | 5.97 | +8.4% |
| Operating profit | 4.58 | 4.99 | +8.9% |
| Net profit | 2.66 | 2.89 | +9.0% |
| Operating cash flow | 4.38 | 2.64 | -39.8% |
| EBITDA margin | 50.6% | 52.8% | +2.2 pp |
| Net margin | 24.4% | 25.6% | +1.2 pp |
Revenue grew 3.7% year-on-year, but quarterly operating cash flow fell more than 40%
In the second quarter of 2026, MX_GAP's revenue reached MXN 11,289.7 million, up 3.7% year-on-year. This continues the growth trend, but the pace remains modest. For comparison, in the first quarter of 2026 revenue was MXN 11,369.6 million, so sequentially it even declined slightly.
Operating cash flow for the quarter was MXN 2,637.0 million, down 40% from MXN 4,379.7 million in the second quarter of 2025. This is a sharp divergence from profit growth. Over the trailing twelve months, operating cash flow is MXN 18,200.0 million, but the quarterly dynamics raise questions.
The decline in cash flow despite revenue and profit growth may indicate deteriorating earnings quality or an increase in working capital. Without additional details from the report, the exact cause is unclear, but this is a key risk for investors.
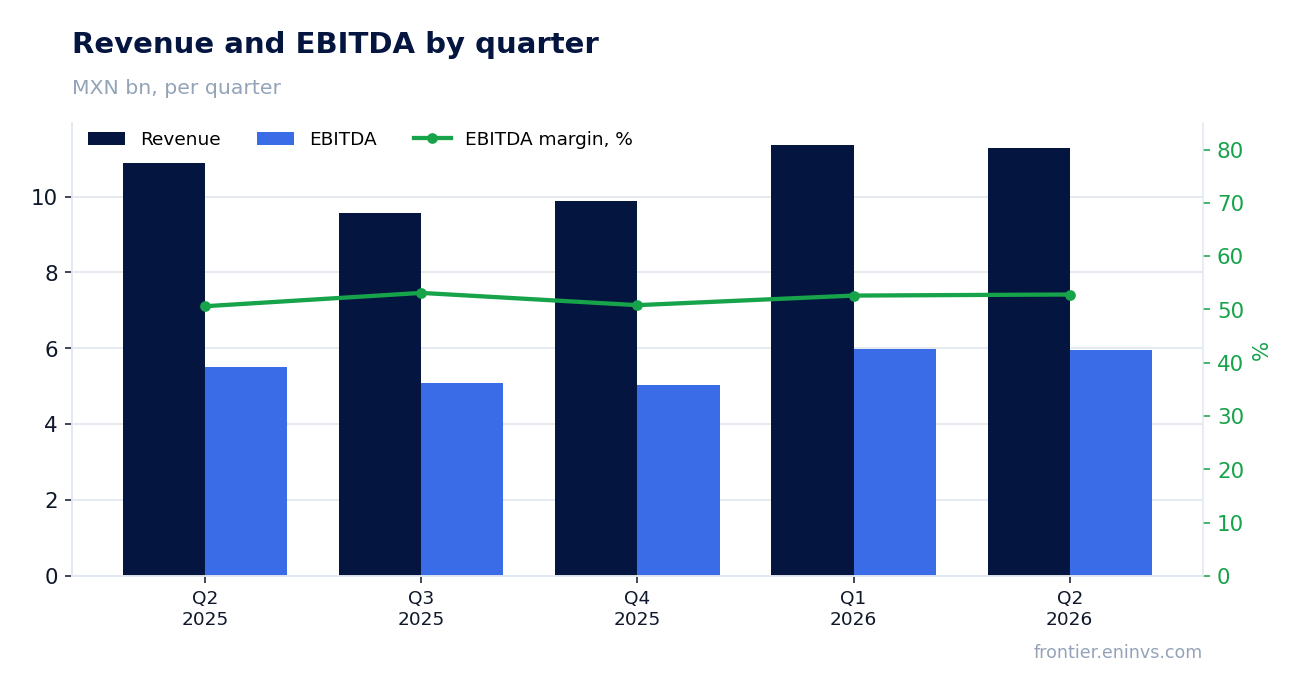
EBITDA margin rose to 52.8% as EBITDA grew faster than revenue
EBITDA in the second quarter of 2026 was MXN 5,965.3 million, up 8.4% year-on-year. EBITDA growth outpaced revenue growth (3.7%), leading to an expansion in the EBITDA margin to 52.8% from 50.6% a year earlier.
The net profit margin also improved: 25.6% versus 24.4% a year earlier. Net profit for the quarter was MXN 2,893.5 million, up 9.0% year-on-year.
Margin improvement is a strong point of the report. However, the sustainability of this trend depends on keeping costs under control. In the next report, it is worth monitoring the dynamics of operating expenses.
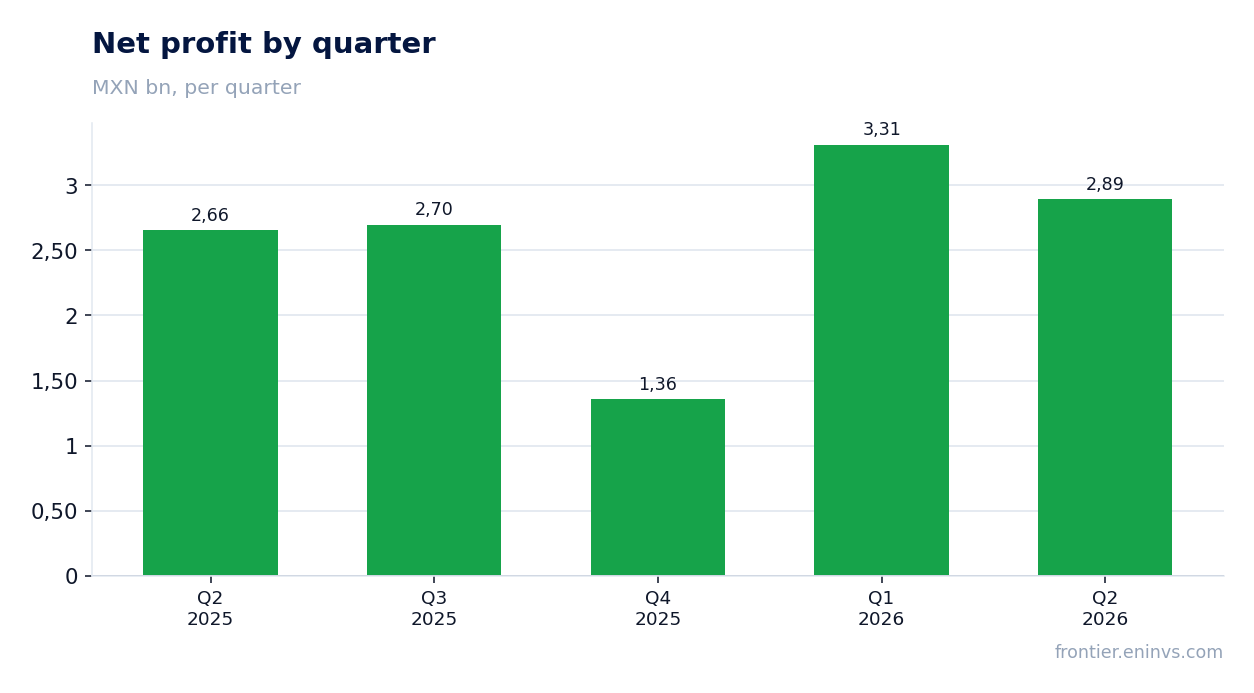
Net profit increased 9.0% year-on-year, but the quarterly result was lower than the previous quarter
Net profit in the second quarter of 2026 was MXN 2,893.5 million, up 9.0% from the second quarter of 2025. However, compared to the first quarter of 2026 (MXN 3,312.0 million), profit declined by 12.6%.
This dynamics may be due to seasonal factors or one-off effects, but without details from the report, the exact cause is unclear. Over the trailing twelve months, net profit amounted to MXN 10,257.4 million.
The net profit margin remains high at 25.6%. This supports the valuation of the business, but the quarterly decline in profit may concern investors.
Net debt rose to MXN 45,893.6 million, with net debt/EBITDA LTM at 1.61 – a moderate level
Net debt at the end of the second quarter of 2026 was MXN 45,893.6 million, an increase of MXN 3.3 billion compared to the previous reporting date. The net debt/EBITDA LTM ratio is 1.61, which is a moderate level for a company with high profitability.
The increase in debt may be related to financing investments or to deteriorating cash flow. It is important to note that operating cash flow for the quarter was low, which could have forced the company to raise borrowed funds.
The debt level does not cause immediate concern, but its further growth amid weak cash flow could become a problem. In the next report, it is worth monitoring the dynamics of debt and interest expenses.
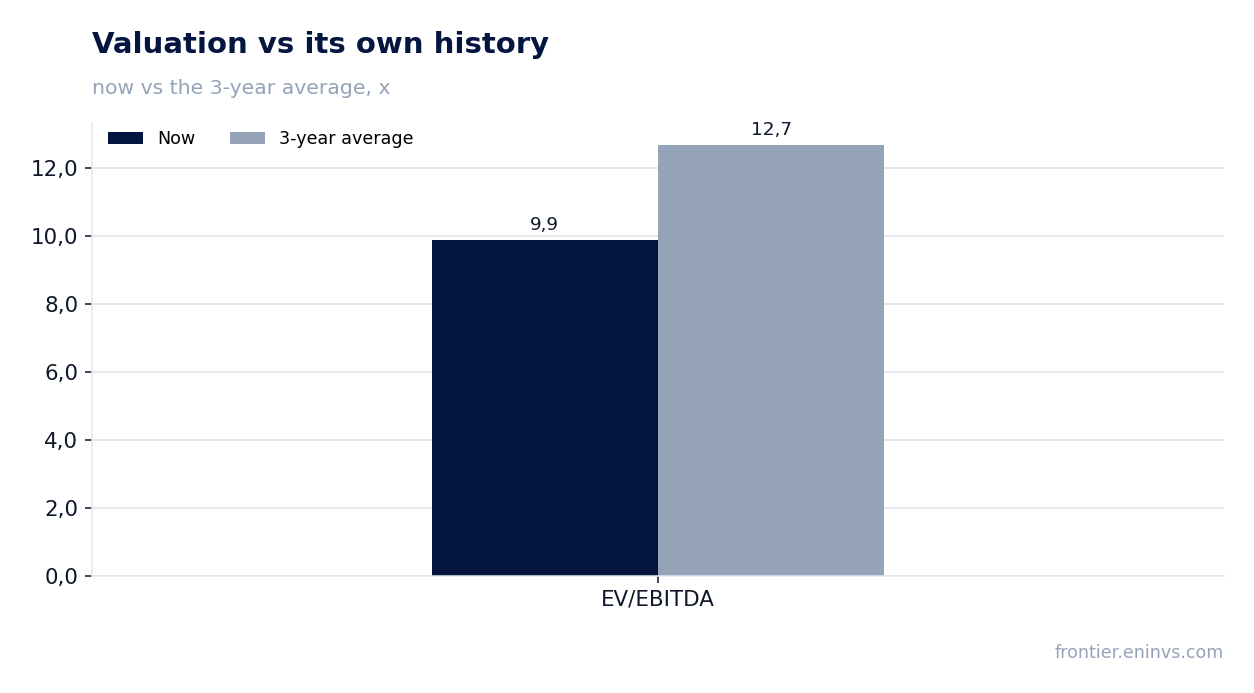
EV/EBITDA of 9.9 is below its own three-year average of 12.7, indicating undervaluation on this multiple
The current EV/EBITDA LTM multiple is 9.9, below its own three-year average of 12.7. This may indicate that the stock is trading at a discount to its historical valuation.
However, the P/E LTM is 16.8, which may also be an attractive level. Return on equity (ROE) is 29.5%, confirming the high efficiency of the business.
Comparison with history shows that the market values the company more modestly than on average over the past three years. This creates potential for re-rating if financial performance continues to improve.
The portal model estimates –3% upside to fair value, implying no significant growth
According to the portal model, the fair value of MX_GAP shares is 3% below the current market price. This means the stock is valued close to its fair value, and upside potential is limited.
The model takes into account EBITDA growth and a target multiple. At current profit growth rates and moderate debt levels, the stock is unlikely to show significant growth in the short term.
Nevertheless, if the company can improve cash flow and reduce debt, this could lead to a revaluation. For now, the model indicates a neutral assessment.
Valuation on the latest reported figures
| Metric | Value |
|---|---|
| Market cap | 172 bn MXN |
| P/E (LTM) | 16.8 |
| EV/EBITDA (LTM) | 9.9 |
| P/B | 7.67 |
| Net debt / EBITDA (LTM) | 1.61 |
| Operating cash flow (LTM) | 18.2 bn |
| ROE | 29.5% |
| EV/EBITDA, 3-year average | 12.7 |
Bottom line
MX_GAP delivered strong profit and margin results: EBITDA grew 8.4%, net profit rose 9.0%, and the EBITDA margin reached 52.8%. However, operating cash flow for the quarter fell sharply, and net debt increased to MXN 45,893.6 million. The EV/EBITDA multiple of 9.9 is below its own three-year average of 12.7, which may indicate undervaluation, but the portal model does not imply significant growth. The stock looks neutral: strong profitability is offset by weak cash flow and moderate debt.
Open the company's financial profile GAP →
See also: market overview · valuation map · stock screeners