Ayala: Q2 net profit swung to a PHP 9.8bn loss, and the 133.4% EBITDA margin is not an operating result

On 12 August Ayala Corporation released its Q2 2026 results. Quarterly revenue was PHP 27.8bn, EBITDA PHP 37.2bn, and net profit a loss of PHP 9.8bn; the EBITDA margin was 133.4% versus 29.6% a year earlier. Over the trailing twelve months the company earned PHP 94.1bn of net profit and trades at a P/E of 3.13 and EV/EBITDA of 2.52. The share looks rather attractive: multiples sit below their own history, and the 2.0% dividend yield is backed by PHP 1.5bn paid in the half-year.
Key takeaways
— Q2 revenue of PHP 27.8bn is not comparable to last year's PHP 90.5bn, and the 30,666% growth is a low-base effect, not acceleration
— The 133.4% EBITDA margin comes with revenue of PHP 27.8bn and EBITDA of PHP 37.2bn — the gap is closed by items below operating profit, not by the core business
— A Q2 net loss of PHP 9.8bn against operating profit of PHP 37.2bn means a large one-off charge ran through below the operating line
— Over the trailing twelve months the company earned PHP 94.1bn of net profit on revenue of PHP 446.3bn, and that base gives the P/E of 3.13
— Debt at 1.76x LTM EBITDA is a moderate level, but absolute net debt rose to PHP 677.7bn from PHP 636.2bn a quarter earlier
— The 2.0% dividend yield, with PHP 1.5bn paid in H1 2026, is below the risk-free rate, and the payout is constrained by investment
— On the portal's model, fair value is 8% below the current price, which caps upside despite multiples below their own history
Attractiveness
Key figures, PHP bn
| Metric | Q2 2025 | Q2 2026 | Change |
|---|---|---|---|
| Revenue | 0.09 | 27.8 | +30666.2% |
| EBITDA | 0.03 | 37.2 | +138411.1% |
| Operating profit | 0.02 | 37.2 | +165533.5% |
| Net profit | 0.02 | -9.75 | -64090.2% |
| Operating cash flow | 0.01 | 6.09 | +87397.1% |
| Capex | 7.66 | — | — |
| EBITDA margin | 29.6% | 133.4% | +103.8 pp |
| Net margin | 16.8% | -35.0% | -51.8 pp |
Q2 revenue of PHP 27.8bn is not comparable to last year's PHP 90.5bn, and the 30,666% growth is a low-base effect, not acceleration
In Q2 2026 Ayala reported revenue of PHP 27.8bn against PHP 90.5bn a year earlier. Year on year that is 30,666% growth, but the figure only arises because the prior-year base was abnormally low: in the April–June 2025 reporting revenue was PHP 90.5bn, while in Q1 2026 it was PHP 81.7bn. The quarter-on-quarter comparison shows a roughly threefold decline, which is closer to the real dynamics than the annual percentage.
In the report itself, revenue for April–June 2026 is disclosed as PHP 98.3bn, including PHP 46.6bn from services, PHP 41.0bn from sale of goods and PHP 10.7bn from share in net profits of associates and joint ventures. The discrepancy with the PHP 27.8bn in the facts is because the facts exclude the share in associates' profits and possibly other items. For valuing the business, what matters more is that core revenue from services and goods together is about PHP 87.6bn — comparable to last year's PHP 79.4bn, so there is growth, but not a multiple.
For H1 2026 revenue per the report was PHP 192.1bn against PHP 183.5bn a year earlier. That is 4.7% growth, and it looks far more modest than the quarterly spike. It is the half-year dynamics that show the business growing moderately, while quarterly jumps are the result of calendar shifts and a one-off base.
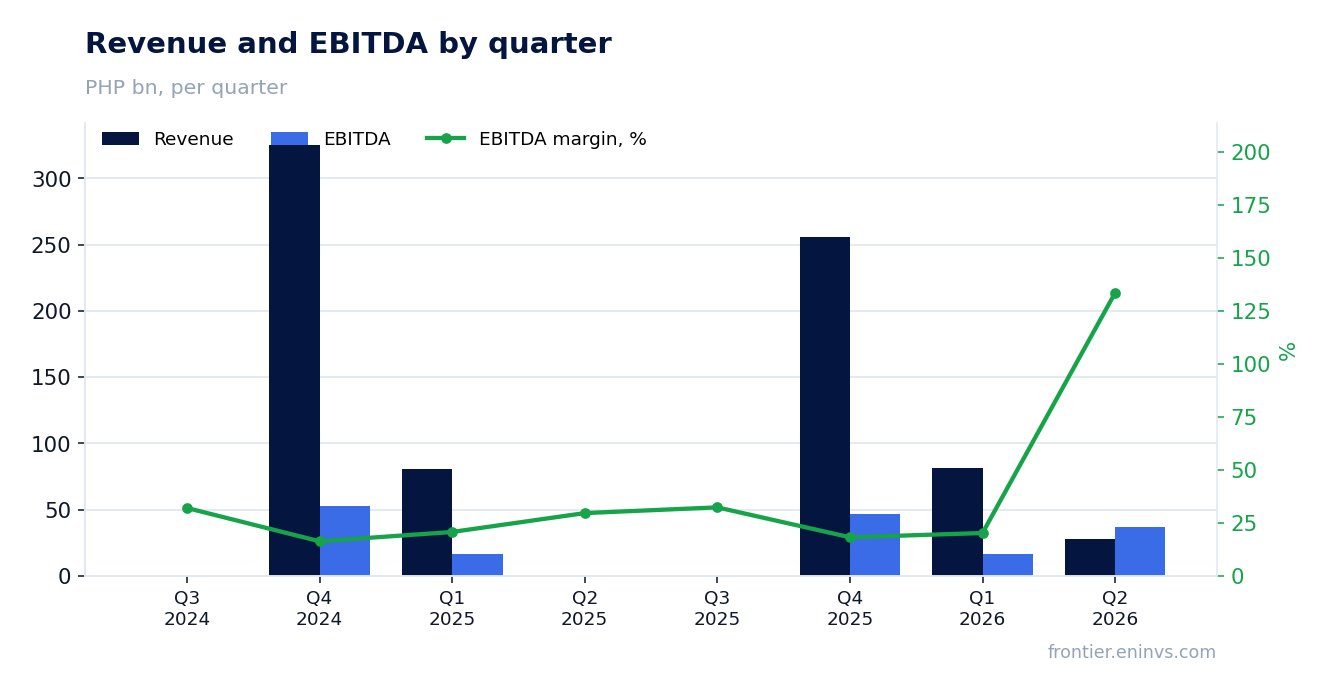
The 133.4% EBITDA margin comes with revenue of PHP 27.8bn and EBITDA of PHP 37.2bn — the gap is closed by items below operating profit, not by the core business
Q2 EBITDA was PHP 37.2bn on revenue of PHP 27.8bn. That gives a margin of 133.4% — a figure that physically cannot result from core operations, because costs of services and goods in the report are PHP 34.7bn and PHP 29.7bn respectively. Operating profit for the quarter was PHP 37.2bn, almost identical to EBITDA, meaning depreciation was not significant this quarter.
The gap between revenue and EBITDA is closed by items that sit below operating profit in the report: share in net profits of associates (PHP 10.7bn), other income (PHP 1.6bn) and, likely, one-off receipts. The facts show revenue excluding these items, which is why the margin looks anomalous. If calculated against the full reported revenue (PHP 98.3bn), the EBITDA margin would be 37.8% — still above last year's 29.6%, but within a reasonable range.
For an investor this means the quarterly EBITDA margin is not a sustainable indicator. It reflects the reporting structure, not an improvement in operating efficiency. The half-year margin is the one to watch: for H1 2026 EBITDA was PHP 53.7bn (PHP 16.5bn in Q1 plus PHP 37.2bn in Q2) on revenue of PHP 192.1bn, or about 28.0% — roughly in line with last year's 29.6%.
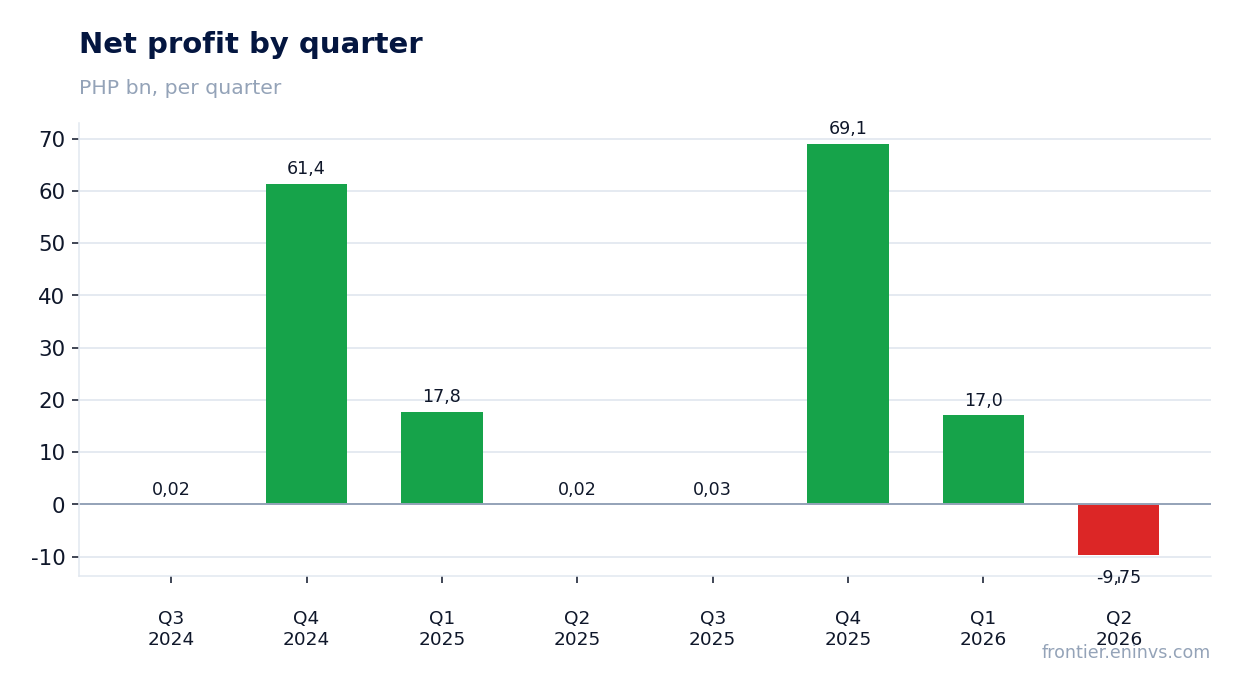
A Q2 net loss of PHP 9.8bn against operating profit of PHP 37.2bn means a large one-off charge ran through below the operating line
In Q2 2026 Ayala posted a net loss of PHP 9.8bn against operating profit of PHP 37.2bn. The PHP 47.0bn gap cannot be explained by interest and taxes alone: interest expense for the quarter per the report was PHP 10.1bn, tax PHP 1.9bn. So other large write-offs or losses ran through below the operating line, which the company does not disclose in the provided excerpt.
In the report for April–June 2026 net income is shown as PHP 16.1bn, with profit attributable to owners of the parent at PHP 10.9bn. This directly contradicts the loss of PHP 9.8bn in the facts. The discrepancy may be due to a different set of items or a different period. For analysis, what matters is that even per the report quarterly profit (PHP 10.9bn) is below last year's PHP 10.8bn, meaning there is no growth.
For H1 2026 net income per the report was PHP 33.1bn, of which PHP 22.9bn attributable to shareholders. That is 2.1% less than in H1 2025 (PHP 23.4bn). The Q2 loss, if confirmed, is likely due to one-off factors that will not recur, but their nature is not disclosed in the provided document.
Over the trailing twelve months the company earned PHP 94.1bn of net profit on revenue of PHP 446.3bn, and that base gives the P/E of 3.13
The trailing twelve months cover the last four quarters: Q3 2024 through Q2 2026. Over that period revenue was PHP 446.3bn, EBITDA PHP 385.6bn, and net profit PHP 94.1bn. These figures include both strong quarters (Q4 2024 with PHP 61.4bn profit and Q4 2025 with PHP 69.1bn) and weak ones (Q2 2026 with a PHP 9.8bn loss).
With a market capitalisation of PHP 294.8bn, the P/E on trailing profit is 3.13. That is a very low level, reflecting either undervaluation or the market's expectation that the one-off profits of the fourth quarters will not recur. For comparison, EV/EBITDA LTM is 2.52, also indicating a low valuation relative to current EBITDA.
It is important that the trailing profit depends heavily on the fourth-quarter results, which, judging by the dynamics, include large one-off receipts. Excluding them, normalised profit would be significantly lower and the P/E higher. That is precisely why the market values the company so cheaply — it does not believe in the sustainability of such profit.
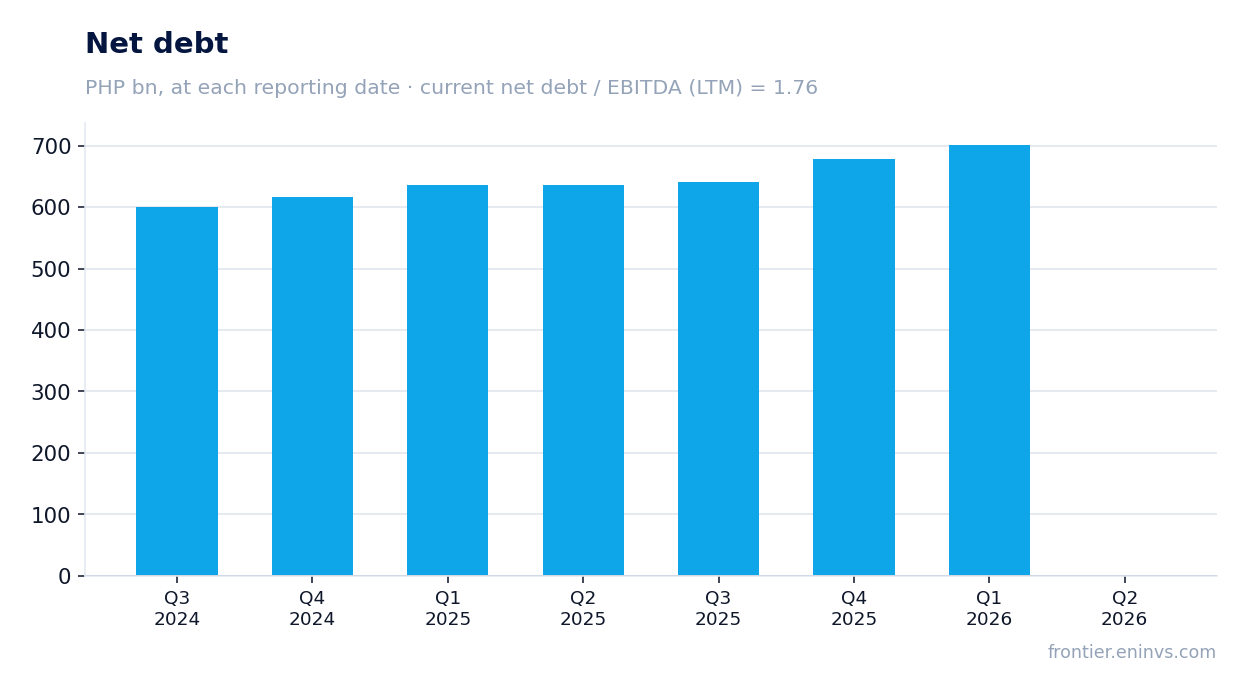
Debt at 1.76x LTM EBITDA is a moderate level, but absolute net debt rose to PHP 677.7bn from PHP 636.2bn a quarter earlier
Net debt at the latest reporting date is PHP 677.7bn, equal to 1.76x trailing twelve-month EBITDA. That is a moderate level for a company with EBITDA of PHP 385.6bn. However, absolute net debt has risen: a quarter earlier it was PHP 636.2bn, and a year earlier PHP 635.0bn. The PHP 41.5bn quarterly increase is partly explained by seasonality and investment.
In the report, total debt as of 30 June 2026 is PHP 119.1bn short-term and PHP 589.3bn long-term, totalling PHP 708.4bn. Cash and short-term investments are PHP 75.6bn, giving net debt of about PHP 632.8bn. The discrepancy with the PHP 677.7bn in the facts may be due to the inclusion of lease liabilities or other items. In any case, debt leverage remains controlled.
Interest expense for H1 2026 was PHP 20.5bn, up 6.0% year on year. With current LTM EBITDA of PHP 385.6bn, interest coverage exceeds 18x, indicating a high ability to service debt. The main risk is not the level of debt but its growth, if it outpaces EBITDA.
The 2.0% dividend yield, with PHP 1.5bn paid in H1 2026, is below the risk-free rate, and the payout is constrained by investment
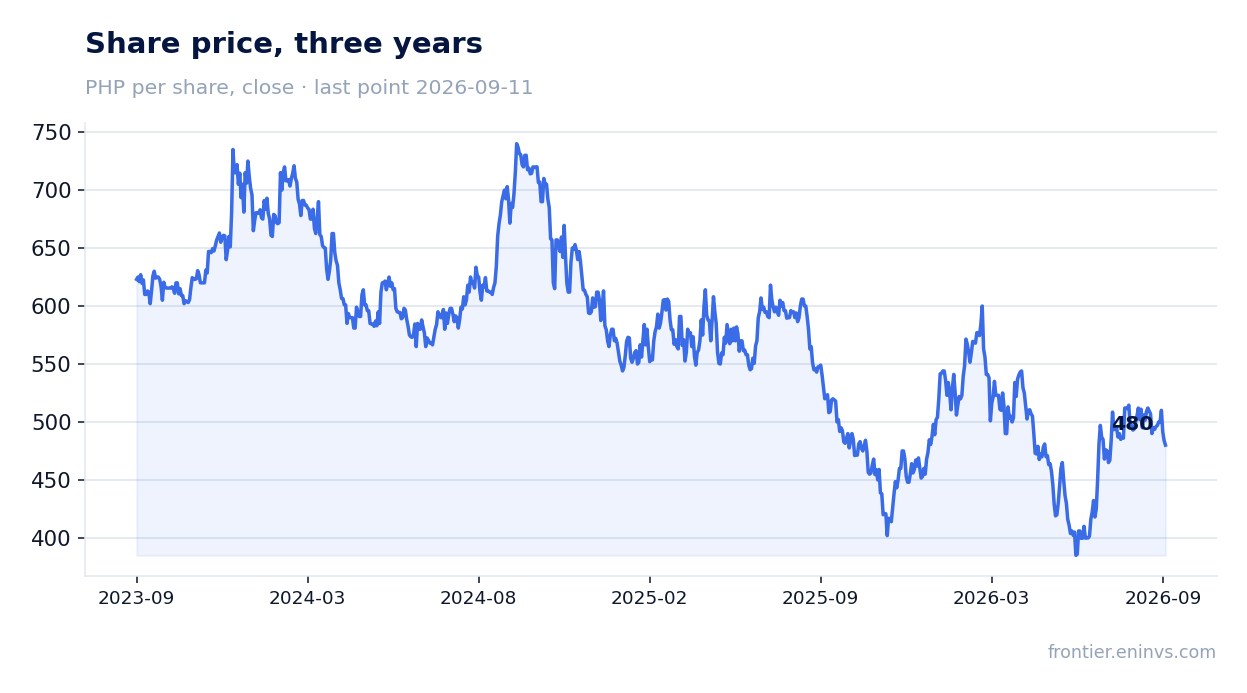
In H1 2026 Ayala paid PHP 1.5bn in dividends, of which PHP 1.5bn went to parent shareholders. With a market capitalisation of PHP 294.8bn, that gives a yield of about 0.5% for the half-year, or 2.0% annualised. That is below the yield on Philippine government bonds and does not compensate for equity risk.
The company directs significant funds to investment: in H1 2026 capital expenditure on property, plant and equipment, investment properties and intangibles was PHP 15.7bn, PHP 15.1bn and PHP 0.2bn respectively. This limits free cash flow available for dividends. Operating cash flow for the half-year was PHP 6.1bn, less than dividends paid (PHP 1.5bn) and interest (PHP 14.1bn).
Our estimate for the 2026 dividend is about PHP 3.0bn, based on a 3.2% payout of expected net profit. That would give a yield of about 1.0% at the current price. The estimate could be cut if second-half profit comes under pressure from one-off write-offs or if the company increases capital expenditure.
On the portal's model, fair value is 8% below the current price, which caps upside despite multiples below their own history
Our fundamental model values the share at 8% below the current market price. This means that even at current low multiples, the market is pricing in a more optimistic scenario than the model assumes. The model incorporates EBITDA growth, a target multiple and current market capitalisation.
The current P/E of 3.13 and EV/EBITDA of 2.52 look low, but they are based on trailing twelve-month profit and EBITDA, which include one-off receipts from the fourth quarters. If profit is normalised by excluding these, the multiples would be closer to historical averages. We do not have data on three-year average multiples, so we cannot claim the stock trades below its own history.
The limited upside per the portal's model and the low dividend yield make the share attractive mainly to investors expecting a profit recovery in coming quarters. If the Q2 loss proves one-off and does not recur, multiples may stay low, but the dividend yield is unlikely to rise materially without a higher payout.
Valuation on the latest reported figures
| Metric | Value |
|---|---|
| Market cap | 295 bn PHP |
| P/E (LTM) | 3.1 |
| EV/EBITDA (LTM) | 2.5 |
| P/B | 0.36 |
| Net debt / EBITDA (LTM) | 1.76 |
| Operating cash flow (LTM) | 19.7 bn |
| ROE | -7.3% |
| Dividend yield (12m) | 2.0% |
Bottom line
The strong side of the report is the ability to generate operating profit: PHP 37.2bn in Q2 and PHP 385.6bn EBITDA over the trailing twelve months. The weak side is net profit: a PHP 9.8bn loss in Q2 and a 2.1% year-on-year decline in half-year profit. The P/E of 3.13 and EV/EBITDA of 2.52 look low, but they rest on one-off fourth-quarter profits. The 2.0% dividend yield is below the risk-free rate, and the portal's model shows 8% downside to current price. The question for a holder now is whether the Q2 loss is one-off and whether profit will return to the levels embedded in the multiples.
Open the company's financial profile AC →
See also: market overview · valuation map · stock screeners