ICTSI: profit up a third, but depreciation and lease interest ate half the EBITDA gain
On 25 August ICTSI released its Q2 2026 results. Revenue grew 25.3% year on year, net profit – by 33.7%, to USD 326.7 million, and the net margin rose to 34.1% from 31.9%. At the same time, quarterly EBITDA declined versus the previous quarter, while leverage remains at 0.81x LTM EBITDA. In our view, the share looks neutral: the business continues to grow, but this is already priced in – EV/EBITDA of 14.7 against a portal-model upside of just +6%.
Key takeaways
— Revenue grows at double-digit rates but is decelerating: from 28.9% in Q1 to 25.3% in Q2
— Quarterly EBITDA fell to USD 509.4 million – the first decline in five quarters
— Net profit rose 33.7%, but was supported by one-off income rather than operating efficiency
— Leverage at 0.81x LTM EBITDA is comfortable, but absolute debt rose by RUB 1.3 bn in the quarter
— Trailing dividend yield of 1.81% is low for the market, but the payout ratio remains high
— EV/EBITDA of 14.7 is above the historical average, and the portal-model upside is just +6%
Attractiveness
Key figures, USD bn
| Metric | Q2 2025 | Q2 2026 | Change |
|---|---|---|---|
| Revenue | 0.77 | 0.96 | +25.3% |
| EBITDA | 0.50 | — | — |
| Operating profit | 0.41 | 0.51 | +22.8% |
| Net profit | 0.24 | 0.33 | +33.7% |
| Operating cash flow | 0.36 | — | — |
| Capex | 0.07 | — | — |
| EBITDA margin | 64.8% | — | — |
| Net margin | 31.9% | 34.1% | +2.2 pp |
Revenue grows at double-digit rates but is decelerating: from 28.9% in Q1 to 25.3% in Q2
In Q2 2026, ICTSI revenue reached USD 958.7 million, up 25.3% year on year. This is the second consecutive quarter with growth above 25%, but the pace slowed: in Q1 growth was 28.9%. The deceleration is due to a high base: in Q2 2025 revenue had already grown 11.9%.
The main contribution comes from the Americas segment: in Q1 2026 revenue there rose to USD 373.0 million from 282.2 million a year earlier, or 32%. The EMEA segment grew 48% to USD 212.2 million, helped by the start of operations in Durban (South Africa) on 1 January 2026. The Asia segment grew 17.5% to USD 375.9 million.
The consolidation of Durban Gateway Terminal (DGT) added USD 68.0 million of revenue in Q1 2026 but contributed only USD 1.5 million of net income attributable to equity holders. This means the new asset is still operating at low profitability, putting pressure on the overall margin.
Revenue dynamics remain strong, but the market already prices in these growth rates. Further growth requires either an acceleration in organic growth or improved profitability of new assets.
Quarterly EBITDA fell to USD 509.4 million – the first decline in five quarters
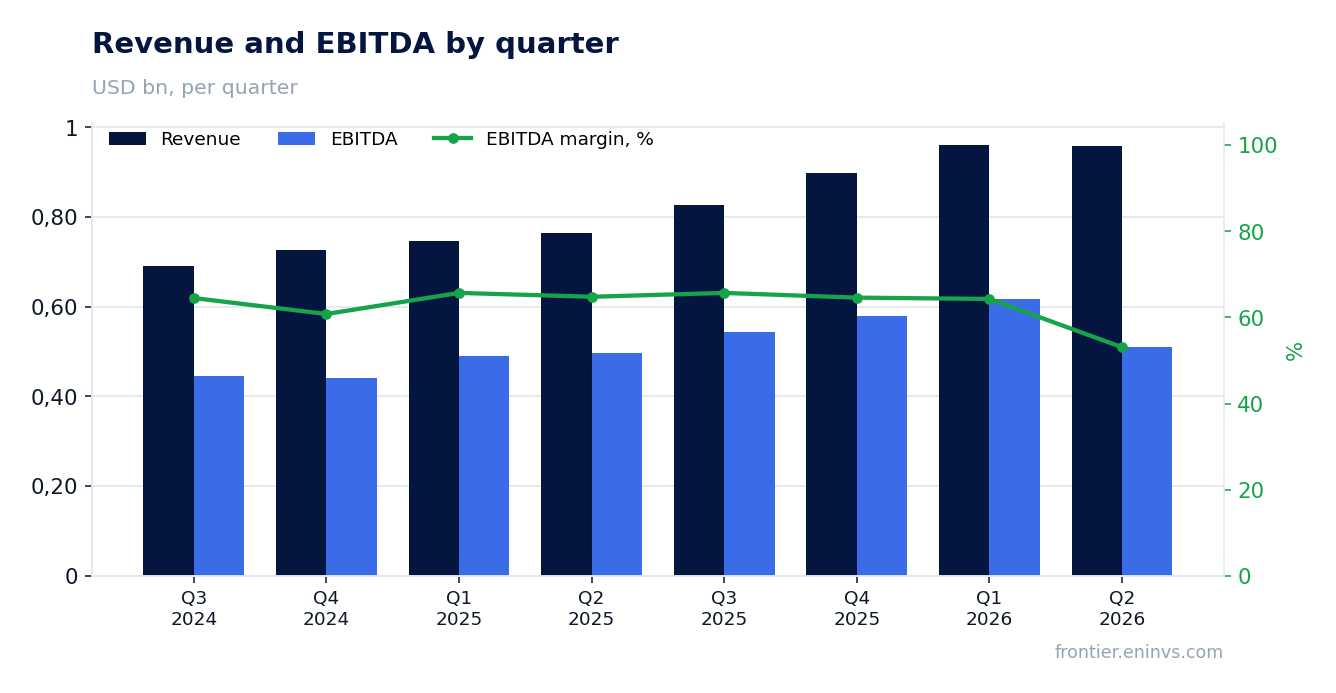
EBITDA in Q2 2026 was USD 509.4 million, down 6.7% from Q1 (USD 617.8 million). This is the first quarterly decline in EBITDA since Q1 2025. Year on year, EBITDA is still higher: in Q2 2025 it was USD 495.7 million, implying growth of 2.8%.
The quarter-on-quarter decline is explained by higher operating expenses. In Q1 2026, manpower costs rose to USD 144.6 million from 94.8 million a year earlier, driven by the DGT consolidation and inflation. Equipment and facilities-related expenses rose to USD 61.0 million from 47.0 million.
The EBITDA margin in Q2 2026 was 53.1% (509.4 / 958.7), down from 64.3% in Q1 but also down from 64.8% in Q2 2025 (495.7 / 765.1). This is a significant year-on-year deterioration that requires explanation.
The main reason is the rise in depreciation and interest expenses, which are not included in EBITDA but affect net profit. However, the quarter-on-quarter decline in EBITDA is a warning sign that may indicate pressure on operating efficiency.
Net profit rose 33.7%, but was supported by one-off income rather than operating efficiency
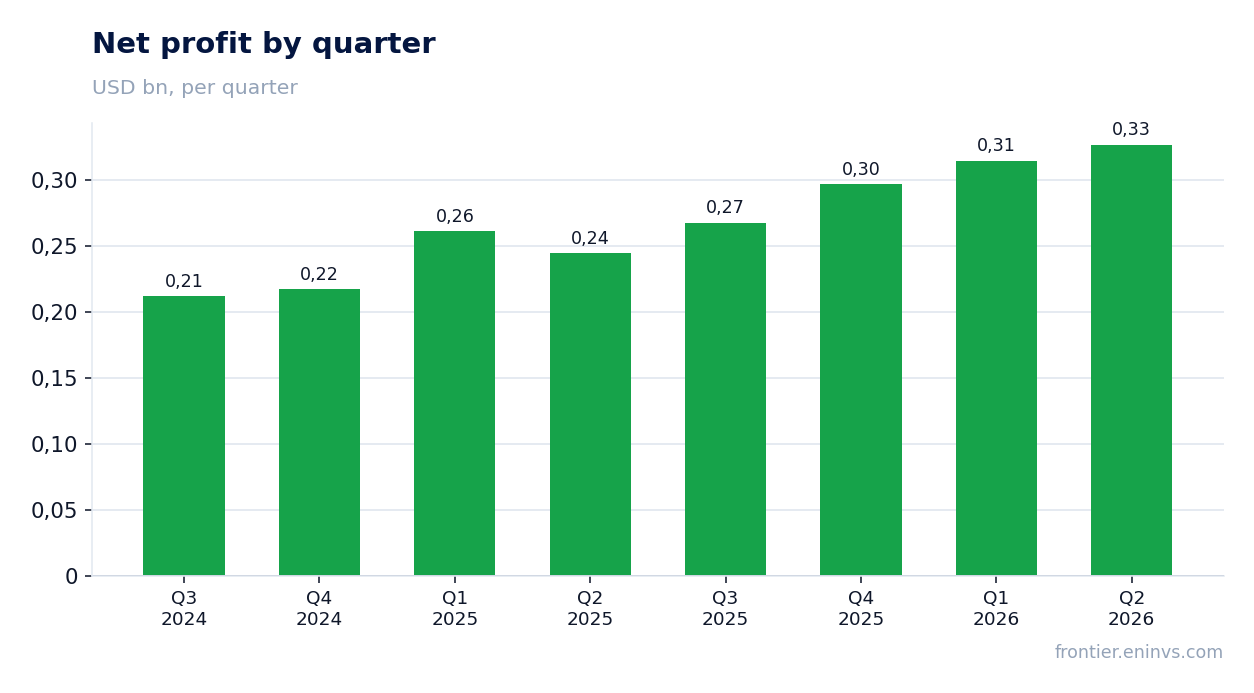
Net profit in Q2 2026 was USD 326.7 million, up 33.7% year on year (USD 244.3 million). The net margin rose to 34.1% from 31.9%. However, this growth was not driven by operating performance: EBITDA grew only 2.8% year on year, while net profit grew 33.7%.
The difference is explained by one-off factors. In Q1 2026, the company sold its 51% stake in Yantai International Container Terminal, recording a loss of USD 14.7 million, but also received income from revaluation and other items. In addition, the report notes that in Q1 2026 the company received a USD 5.0 million government grant, which also supported profit.
It is also important to note that net profit includes the share of non-controlling interests. Profit attributable to equity holders of the parent was USD 293.6 million in Q1 2026, up 22.6% year on year. In Q2 2026, total net profit was USD 326.7 million, but the profit attributable to parent shareholders may be lower.
Thus, the 33.7% growth in net profit looks impressive, but it does not reflect sustainable operating dynamics. Without one-off income, growth would have been more modest.
Leverage at 0.81x LTM EBITDA is comfortable, but absolute debt rose by RUB 1.3 bn in the quarter
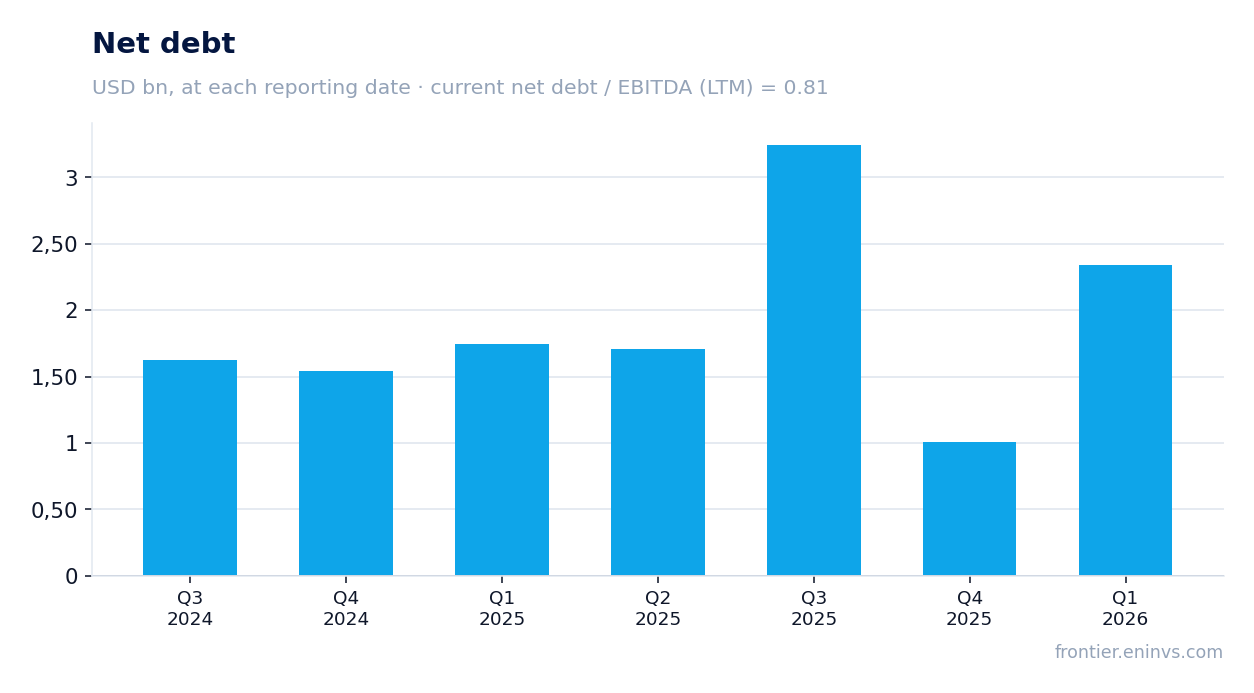
Net debt at the latest reporting date was USD 1,791.7 million, and the net debt / LTM EBITDA ratio was 0.81. This is a comfortable level for an infrastructure company, leaving room for manoeuvre. However, absolute net debt rose by RUB 1.3 bn compared to the previous reporting date and by RUB 0.6 bn over the last 12 months.
The increase is linked to the acquisition of Durban Gateway Terminal for USD 618.0 million and the consolidation of FII Inhaúma. These deals increased assets but also added debt. The report notes that the company raised long-term borrowings of USD 13.3 million in Q1 2026 and repaid USD 10.1 million.
Interest expenses remain significant: in Q1 2026, interest on borrowings was USD 39.1 million, on leases – USD 42.4 million, on concession rights – USD 16.3 million. Total interest expenses exceed USD 97 million per quarter, eating a substantial part of operating profit.
The debt level is not a concern, but its growth and high interest expenses limit the scope for dividend increases or share buybacks.
Trailing dividend yield of 1.81% is low for the market, but the payout ratio remains high
The trailing 12-month dividend yield is 1.81%. This is lower than many emerging-market companies and below the key rate. However, this reflects not low payouts but a high valuation: market capitalisation is USD 30,763.7 million, and dividends over the last 12 months were about USD 557 million.
In Q1 2026, the company paid dividends of USD 615.8 million (of which USD 54.5 million to non-controlling interests). This is a significant amount exceeding quarterly net profit. The high payout is explained by the distribution of prior-period profits.
Our estimate for the 2026 dividend: assuming a payout ratio of about 50% of net profit and expected annual net profit of around USD 1.3 billion, the dividend could be about USD 650 million, or roughly USD 0.32 per share. At the current price, this implies a yield of about 2.1%. However, this estimate depends on profit, which may be reduced by one-off factors.
The risk of a dividend cut is linked to rising capital expenditures and debt. If the company continues to actively acquire assets, as with DGT, free cash flow may come under pressure, limiting payouts.
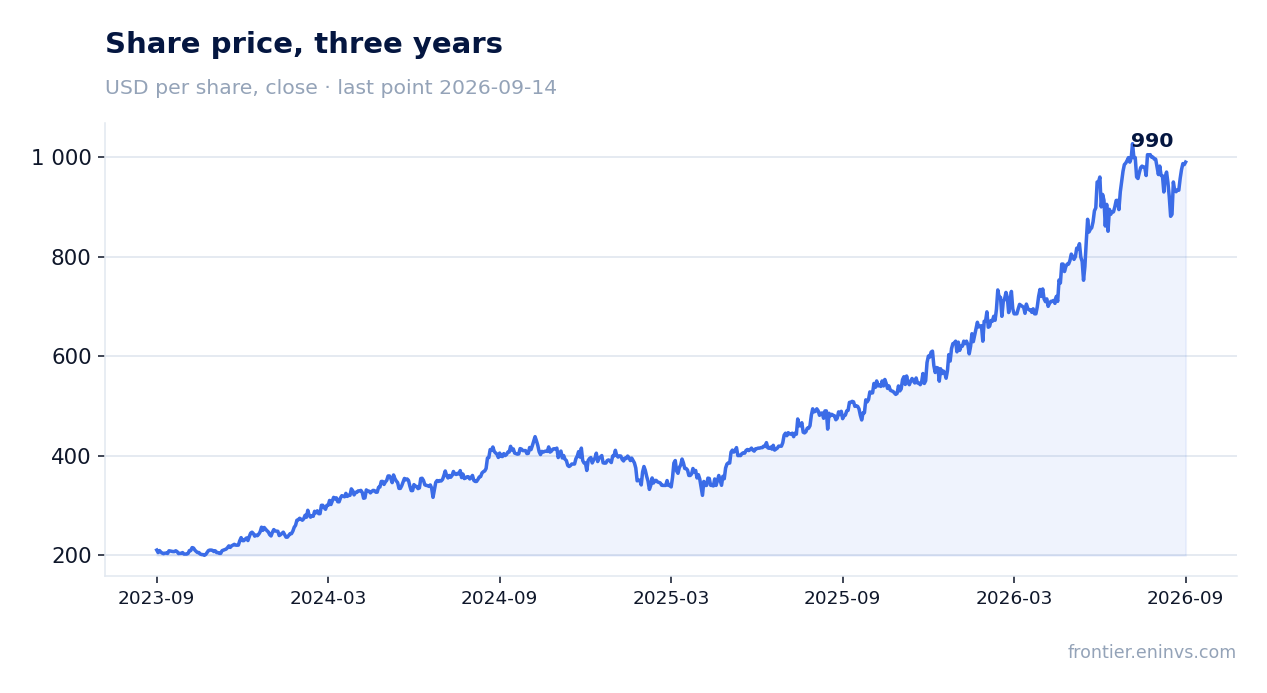
EV/EBITDA of 14.7 is above the historical average, and the portal-model upside is just +6%
LTM EV/EBITDA is 14.7, P/E – 25.5. This is above the historical average for a company that typically traded at an EV/EBITDA of around 10–12. The current valuation implies that the market expects high growth rates to continue and profitability to improve.
Our valuation model (portal model) gives an upside to fair value of just +6%. This means the share is trading close to its fair value, and further growth is possible only if earnings exceed expectations or operating efficiency improves.
For comparison: ROE is 53.8%, which is very high and indicates efficient use of capital. However, the high ROE is partly explained by the effect of financial leverage and one-off income.
Thus, the valuation looks fair but leaves little room for growth. To become more attractive, either earnings growth must exceed expectations or risks must decline.
Valuation on the latest reported figures
| Metric | Value |
|---|---|
| Market cap | 30.8 bn USD |
| P/E (LTM) | 25.5 |
| EV/EBITDA (LTM) | 14.7 |
| P/B | 12.40 |
| Net debt / EBITDA (LTM) | 0.81 |
| Operating cash flow (LTM) | 0.49 bn |
| ROE | 53.8% |
| Dividend yield (12m) | 1.8% |
Bottom line
Bottom line: ICTSI showed strong revenue and net profit growth, but the quality of this growth is questionable. Quarterly EBITDA declined, while net profit grew mainly due to one-off factors. Leverage is comfortable but rising, and the dividend yield is low. EV/EBITDA of 14.7 leaves little upside. In our view, the share looks neutral: the current price already reflects market expectations, and a sustained improvement in operating efficiency is needed to justify a higher valuation.
Open the company's financial profile ICT →
See also: market overview · valuation map · stock screeners