Meralco: revenue up a quarter, but purchased power and 2.08x EBITDA leverage absorbed it all
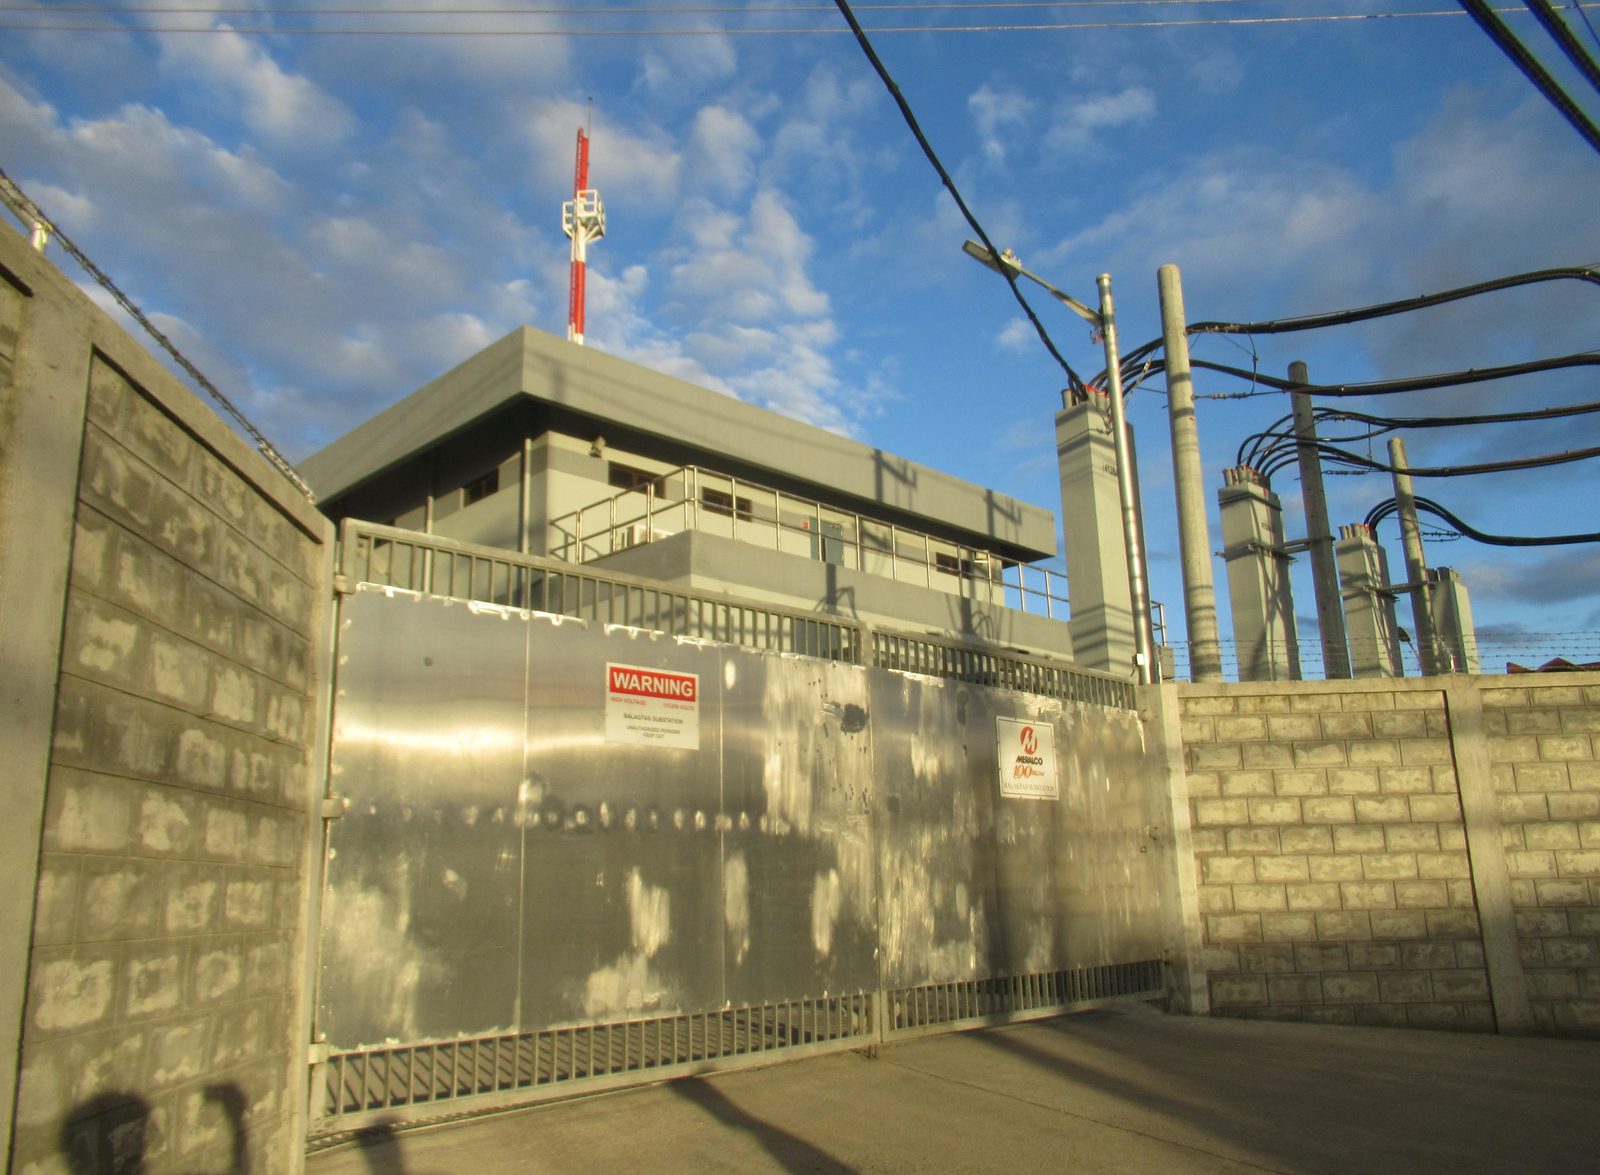
On August 25, Manila Electric Company released its first-half 2026 results. Revenue for the six months rose 16% to PHP 283,710 million, net income added 13% to PHP 27,536 million, and in the second quarter alone revenue jumped 24.7% year on year to PHP 162,931 million. Yet quarterly profit of PHP 16,371 million grew only 24.1%, and the net margin stayed at 10.0% versus 10.1% a year earlier. The stock trades at a P/E of 12.4 and EV/EBITDA of 11.2 with a dividend yield of 5.9%, but leverage at 2.08x EBITDA and rising capex leave little confidence in the sustainability of cash flow. Our assessment is neutral: revenue growth is real, but it does not translate proportionally into profit, and the debt burden remains high.
Key takeaways
— Q2 revenue rose 24.7%, but the entire gain went into purchased power
— Net margin stayed at 10.0% – revenue growth did not improve profitability
— Half-year net income added 13%, but Q2 growth slowed to 24.1%
— Leverage at 2.08x EBITDA and rising capex pressure free cash flow
— Dividend yield of 5.9% with a payout ratio that may decline due to rising debt
— Valuation: P/E 12.4 and EV/EBITDA 11.2 – neutral versus historical levels
Attractiveness
Key figures, PHP bn
| Metric | Q2 2025 | Q2 2026 | Change |
|---|---|---|---|
| Revenue | 131 | 163 | +24.7% |
| EBITDA | 17.1 | — | — |
| Operating profit | 14.1 | 16.0 | +13.4% |
| Net profit | 13.2 | 16.4 | +24.1% |
| Operating cash flow | 11.3 | — | — |
| Capex | 22.2 | — | — |
| EBITDA margin | 13.1% | — | — |
| Net margin | 10.1% | 10.0% | -0.1 pp |
Q2 revenue rose 24.7%, but the entire gain went into purchased power
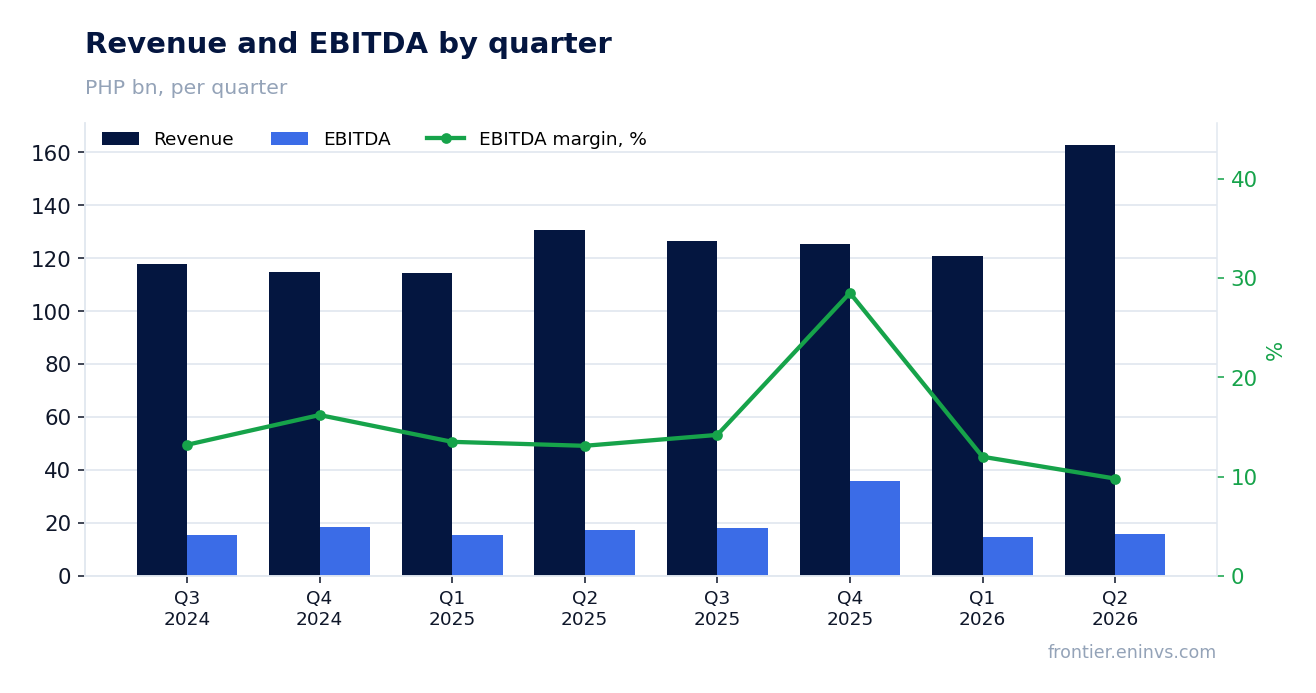
First-half 2026 revenue reached PHP 283,710 million, up 16% from the same period last year. In the second quarter alone, revenue hit PHP 162,931 million, up 24.7% year on year. The jump is primarily explained by higher pass-through generation and transmission charges, as well as stronger revenue contributions from the power generation business of MGen.
The average retail rate rose 15% to PHP 13.09 per kWh. The generation component, accounting for 63% of the tariff, increased 14% due to higher fixed charges from the extended PPA, fuel cost adjustments, and peso depreciation. The transmission component rose 47% on higher reserve market ancillary service charges and NGCP's recovery of under-recoveries.
However, this entire tariff increase is mostly pass-through costs that the company recovers from consumers. They boost revenue but have little impact on profit. Confirmation comes from purchased power costs, which rose 19% to PHP 220,452 million for the half-year, almost entirely absorbing the revenue gain.
Net margin stayed at 10.0% – revenue growth did not improve profitability
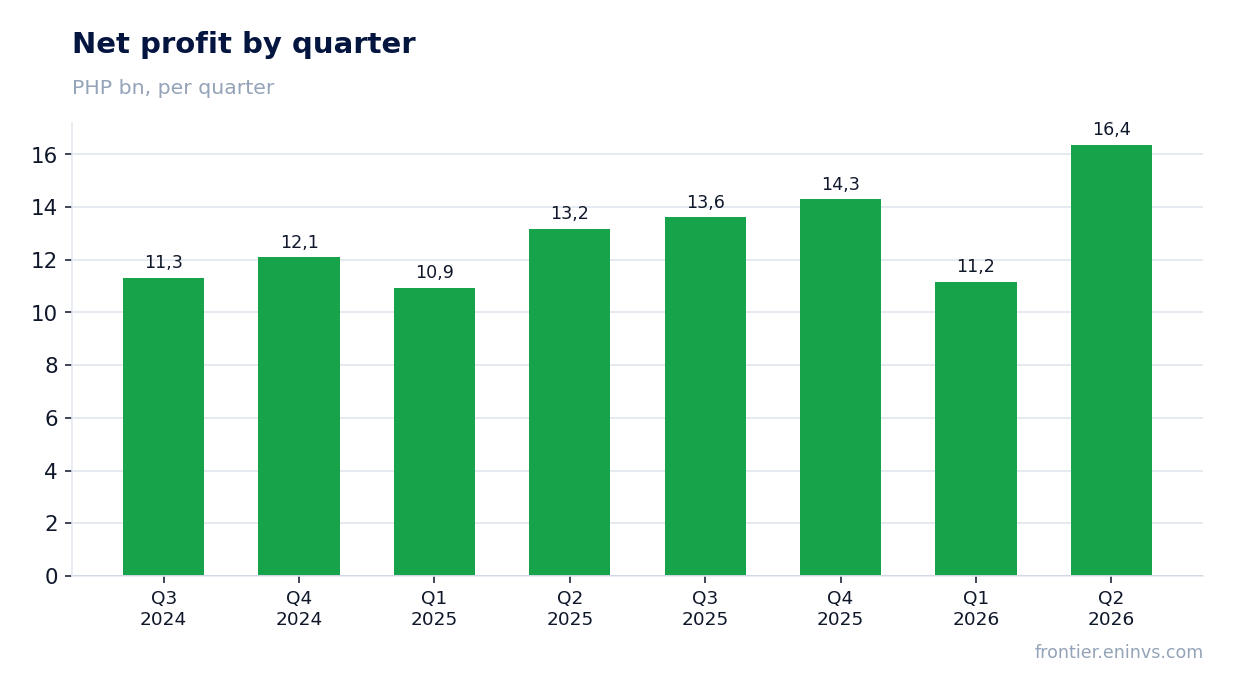
First-half 2026 net income reached PHP 27,536 million, up 13% year on year. However, in the second quarter alone, net income grew only 24.1% to PHP 16,371 million, while revenue added 24.7%. The net profit margin in Q2 remained at 10.0% versus 10.1% a year earlier.
The reason is that revenue growth was driven by pass-through costs that do not generate margin. In addition, the company recognized a foreign exchange loss of PHP 328 million for the half-year versus a gain of PHP 125 million a year earlier. This also pressured the bottom line.
Additionally, profit was supported by an increase in the share of net earnings from associates and joint ventures to PHP 9,313 million, which partially offset higher costs. However, this was not enough to improve profitability.
Half-year net income added 13%, but Q2 growth slowed to 24.1%
For the first half of 2026, net income rose 13% to PHP 27,536 million. However, in the second quarter, growth was 24.1% year on year, below the 24.7% revenue growth. This indicates that the company could not improve operational efficiency.
The main contribution to profit came from the power segment, where net income increased 11% to PHP 26,667 million. This was partially offset by higher costs and negative foreign exchange differences. The other services segment showed a 94% increase in profit to PHP 869 million, but its share in the overall result is small.
It is important to note that profit growth was largely supported by one-off factors, such as the increased share in associates. Without this, growth would have been even more modest.
Leverage at 2.08x EBITDA and rising capex pressure free cash flow
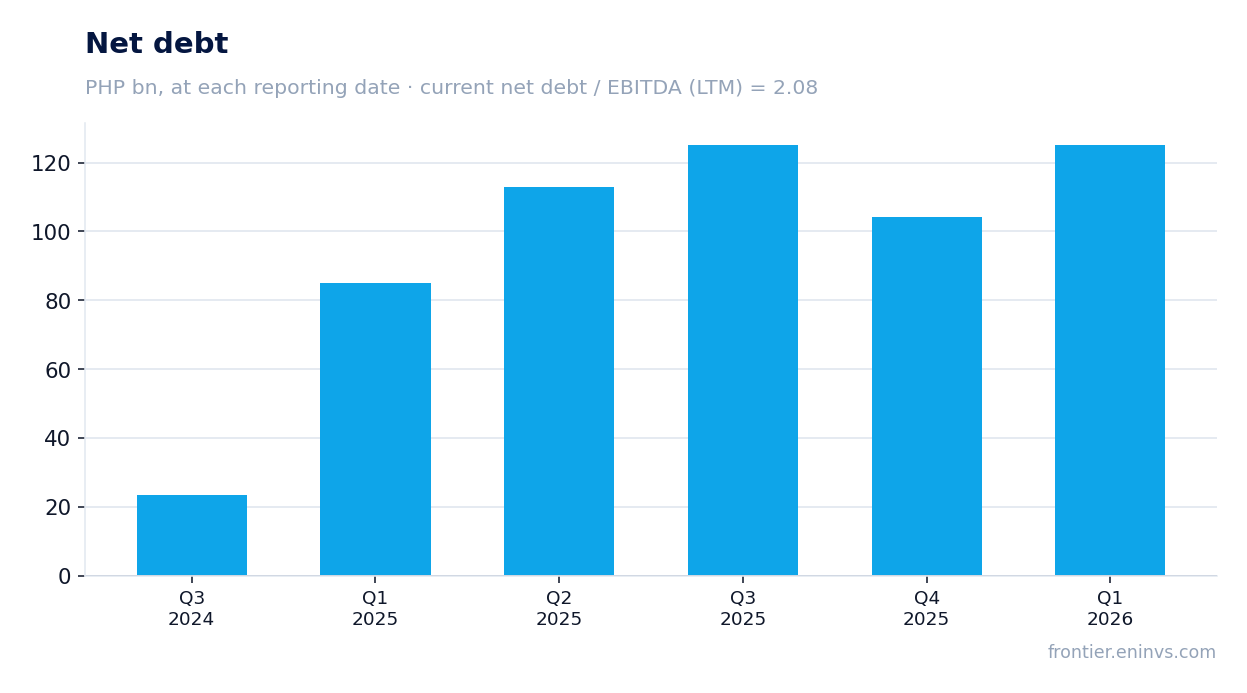
Net debt at the end of the first half of 2026 stood at PHP 125,210 million, corresponding to a net debt/EBITDA LTM ratio of 2.08x. This is a relatively high burden, especially given rising capital expenditures. For the half-year, capex was PHP 19,424 million in Q1 and PHP 22,228 million in Q2 2025, but Q2 2026 data is missing.
Operating cash flow for the first half of 2026 was PHP 9,971 million, down 53% from the same period last year. This is due to working capital growth and higher pass-through costs. Free cash flow is likely negative due to high capex.
Total debt rose 8% to PHP 247,316 million compared to the end of 2025. The company increased borrowings to finance investments and strategic initiatives. This creates risks for future dividend payments.
Dividend yield of 5.9% with a payout ratio that may decline due to rising debt
The dividend yield over the trailing 12 months is 5.9%. This is above the current key rate, making the stock attractive for income investors. However, the sustainability of payments is questionable due to rising debt and capital expenditures.
The dividend payout ratio can be estimated based on earnings per share. For the first half of 2026, EPS was PHP 23.33, up 11% from a year earlier. If the company maintains its payout ratio, the dividend could grow, but rising debt may force management to reconsider the policy.
The main risks to the dividend are further growth in capital expenditures and the need to service debt. If free cash flow remains negative, the company may cut payments or increase debt to finance them.
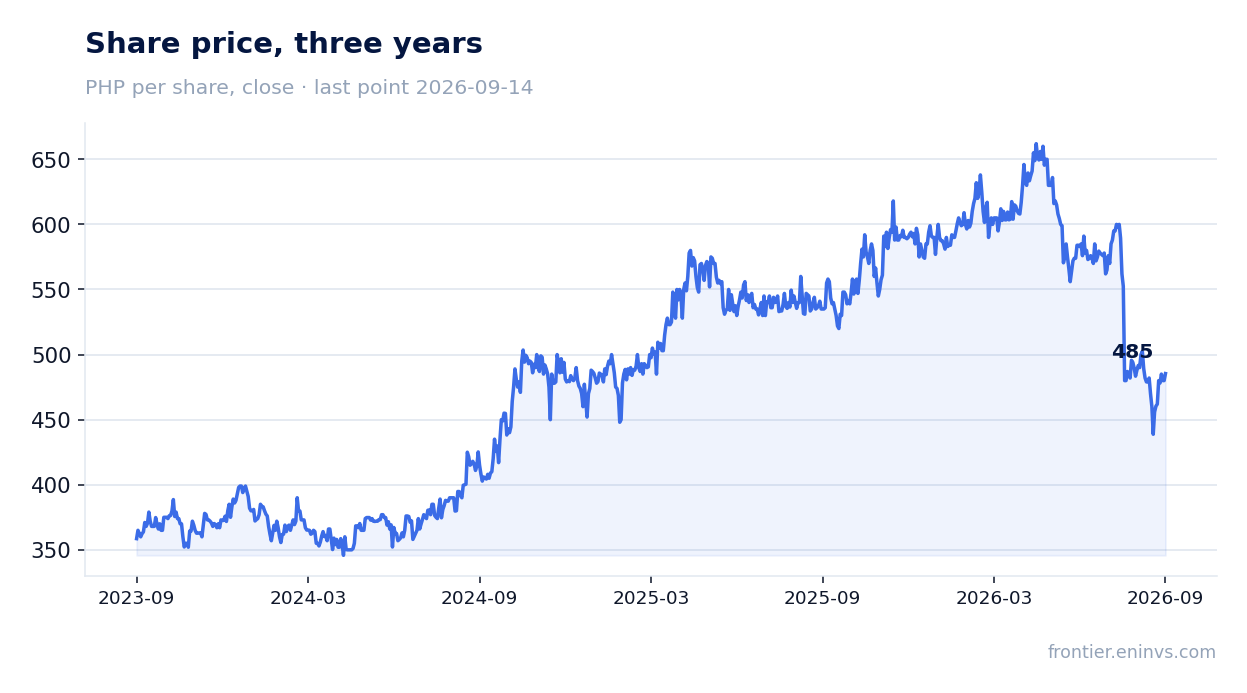
Valuation: P/E 12.4 and EV/EBITDA 11.2 – neutral versus historical levels
The stock trades at a P/E LTM of 12.4 and EV/EBITDA LTM of 11.2. For comparison, historical averages over the past three years are not available in the provided data, so it is impossible to say definitively whether the company is expensive or cheap relative to its own history.
Return on equity (ROE) is 29.3%, which is a high figure. However, it is achieved with high leverage, which increases risks. The dividend yield of 5.9% provides some support to the valuation.
Given the uncertainty around cash flow and high debt, the current valuation appears fair but offers no significant upside. A re-rating would require sustainable profit growth and a reduction in debt.
Valuation on the latest reported figures
| Metric | Value |
|---|---|
| Market cap | 548 bn PHP |
| P/E (LTM) | 12.4 |
| EV/EBITDA (LTM) | 11.2 |
| P/B | 2.45 |
| Net debt / EBITDA (LTM) | 2.08 |
| Operating cash flow (LTM) | 72.1 bn |
| ROE | 29.3% |
| Dividend yield (12m) | 5.9% |
Bottom line
Meralco delivered strong revenue growth in Q2 – up 24.7% year on year – but this growth was entirely driven by pass-through costs and did not improve profitability. Net income rose 24.1%, but the margin remained at 10.0%. Leverage at 2.08x EBITDA and rising capex pressure free cash flow, which is likely negative. The dividend yield of 5.9% looks attractive, but its sustainability is questionable. Our assessment is neutral: current multiples offer no clear advantage, and risks related to debt and regulation limit upside potential.
Open the company's financial profile MER →
See also: market overview · valuation map · stock screeners