PH_SM: revenue accelerated to +7.5%, but profit lags — margin slightly compressed

On 25 August, PH_SM released its Q2 2026 results. Revenue came in at 179,781 mn PHP, operating profit at 42,168 mn PHP, and net profit at 33,170 mn PHP. Revenue growth accelerated to +7.5% year-on-year from +4.9% in the prior quarter, yet net profit rose only +6.4%, and the net margin slipped to 18.5% from 18.7%. With a P/E LTM of 4.84 and a dividend yield of 3.33%, the share looks rather attractive, but margin compression and the absence of quarterly cash flow data temper the view.
Key takeaways
— Revenue accelerated to +7.5% year-on-year, but profit lags: net margin narrowed to 18.5%
— Operating profit rose to 42,168 mn PHP, but its growth trails revenue
— Net profit for the quarter was 33,170 mn PHP, up only 6.4% year-on-year
— Debt load at 3.07x EBITDA LTM is moderate, but quarterly cash flow data is missing
— Dividend yield of 3.33% with P/E LTM of 4.84 — the market values the company cheaply
— The portal's model implies +21% upside to fair value
Attractiveness
Key figures, PHP bn
| Metric | Q2 2025 | Q2 2026 | Change |
|---|---|---|---|
| Revenue | 167 | 180 | +7.5% |
| EBITDA | 0.05 | — | — |
| Operating profit | 0.04 | 42.2 | +106650.7% |
| Net profit | 31.2 | 33.2 | +6.4% |
| Operating cash flow | 0.03 | — | — |
| Capex | 2.37 | — | — |
| EBITDA margin | 0.0% | — | — |
| Net margin | 18.7% | 18.5% | -0.2 pp |
Revenue accelerated to +7.5% year-on-year, but profit lags: net margin narrowed to 18.5%
Revenue in Q2 2026 was 179,781 mn PHP, up 7.5% year-on-year. This marks an acceleration from +4.9% in Q1 2026. The company is growing faster than at the start of the year.
However, net profit rose only 6.4% to 33,170 mn PHP. The net margin declined to 18.5% from 18.7% a year earlier. Profit is growing slower than revenue, indicating cost pressure or expenses outpacing income.
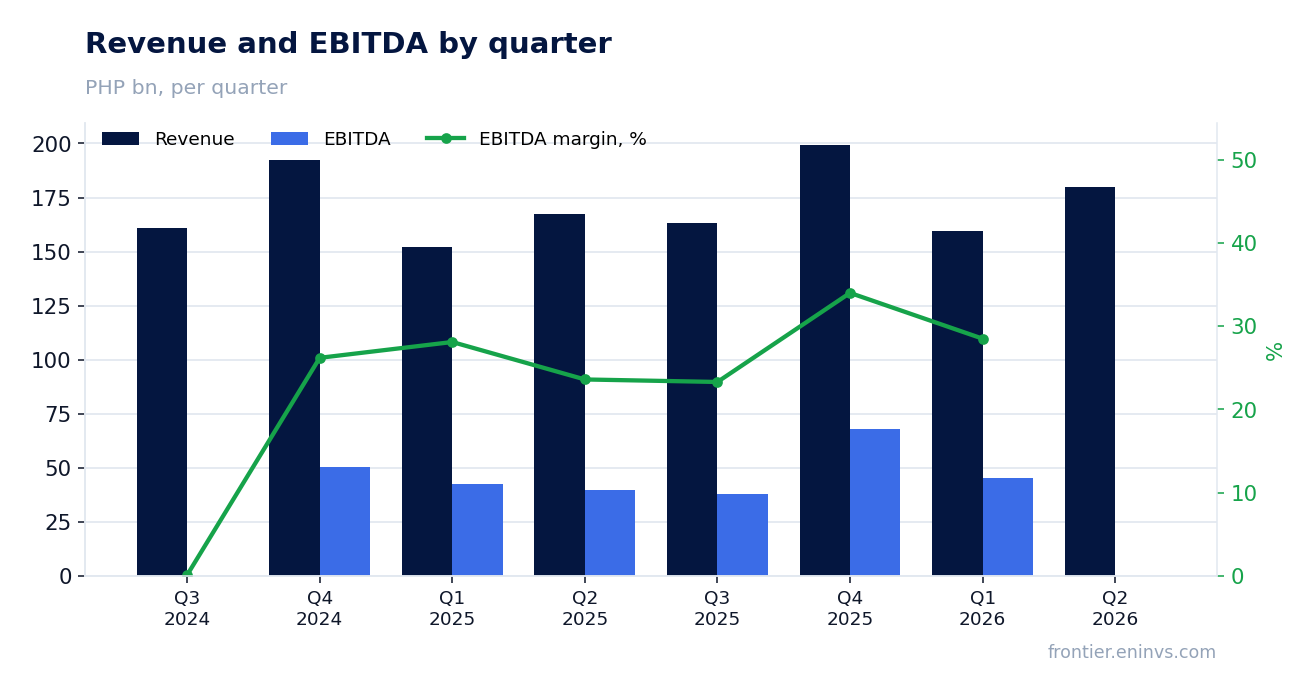
Operating profit rose to 42,168 mn PHP, but its growth trails revenue
Operating profit for Q2 2026 was 42,168 mn PHP. This is 6.8% higher than 39,501 mn PHP a year earlier. Operating profit growth trails revenue growth, confirming pressure on operating expenses.
The operating margin slipped to 23.5% from 23.6% a year earlier. The company maintains high operating profitability, but the slight decline suggests that revenue growth is accompanied by faster cost increases.
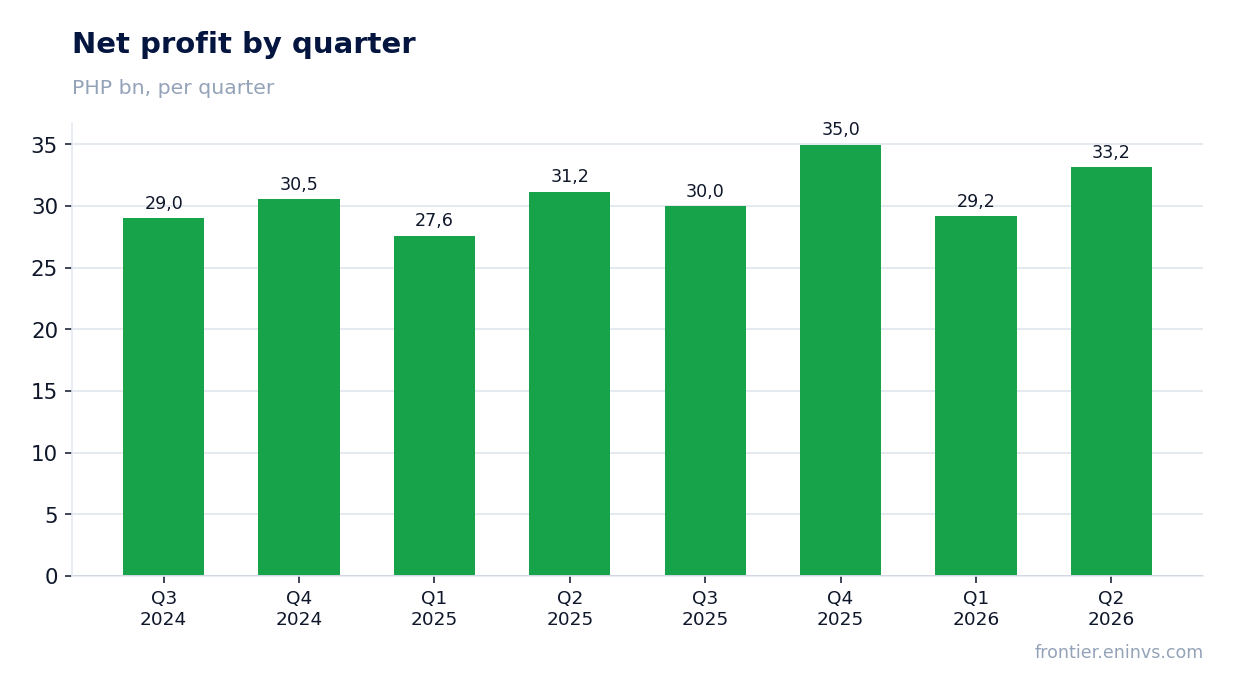
Net profit for the quarter was 33,170 mn PHP, up only 6.4% year-on-year
Net profit in Q2 2026 reached 33,170 mn PHP, up 6.4% from 31,182 mn PHP a year earlier. Profit growth was slower than revenue growth, leading to a decline in net margin.
The net margin was 18.5% versus 18.7% a year earlier. This is a small but noticeable decline. The main reason is faster growth in expenses, which partially offset the revenue increase.
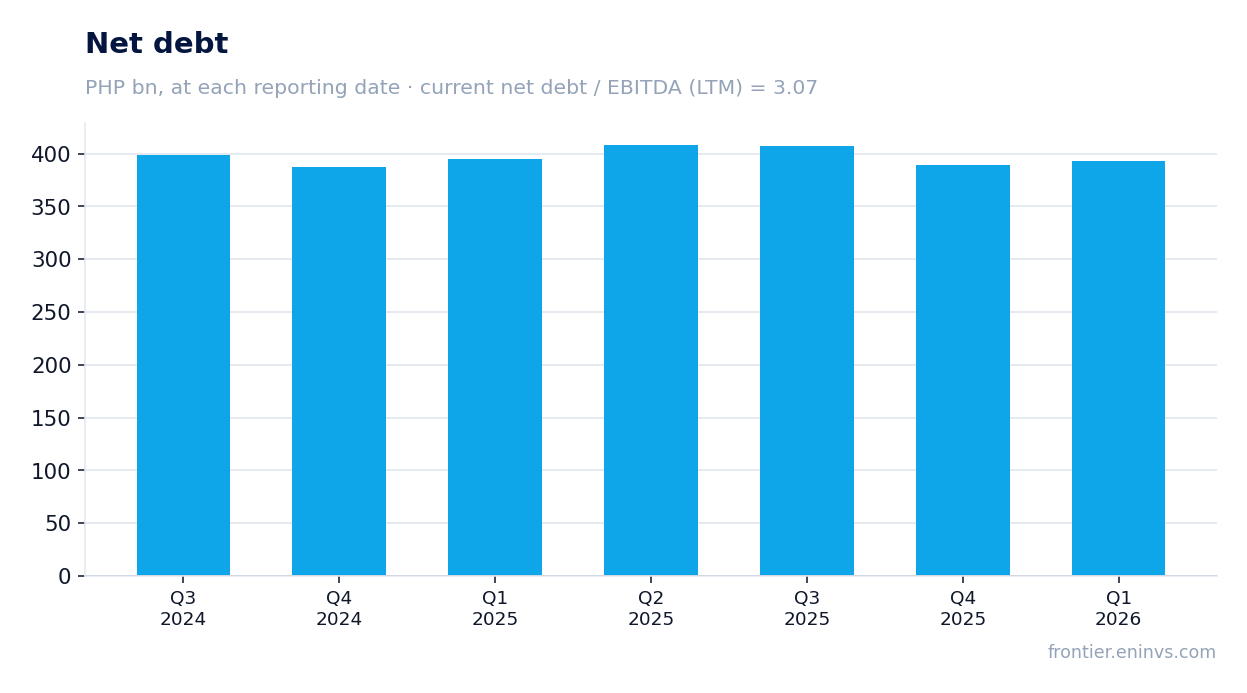
Debt load at 3.07x EBITDA LTM is moderate, but quarterly cash flow data is missing
Net debt at the latest balance sheet date was 389,389 mn PHP. The net debt to EBITDA ratio for the trailing twelve months is 3.07. This is a moderate level that does not raise immediate concerns, but it also does not inspire optimism.
Operating cash flow and capital expenditure data for Q2 2026 are not disclosed. This limits the analysis of the company's ability to service debt and fund investments. In the prior quarter, operating cash flow was positive, but its sustainability is difficult to assess.
Dividend yield of 3.33% with P/E LTM of 4.84 — the market values the company cheaply
The dividend yield over the trailing twelve months is 3.33%. At the current share price and a P/E LTM of 4.84, this suggests the market values the company quite low. The price-to-earnings ratio is lower than one might expect for a company with growing revenue.
EV/EBITDA LTM stands at 7.92. This is also a low level, though higher than P/E. The market appears to be pricing in risks related to slowing profit growth or uncertainty about cash flows.
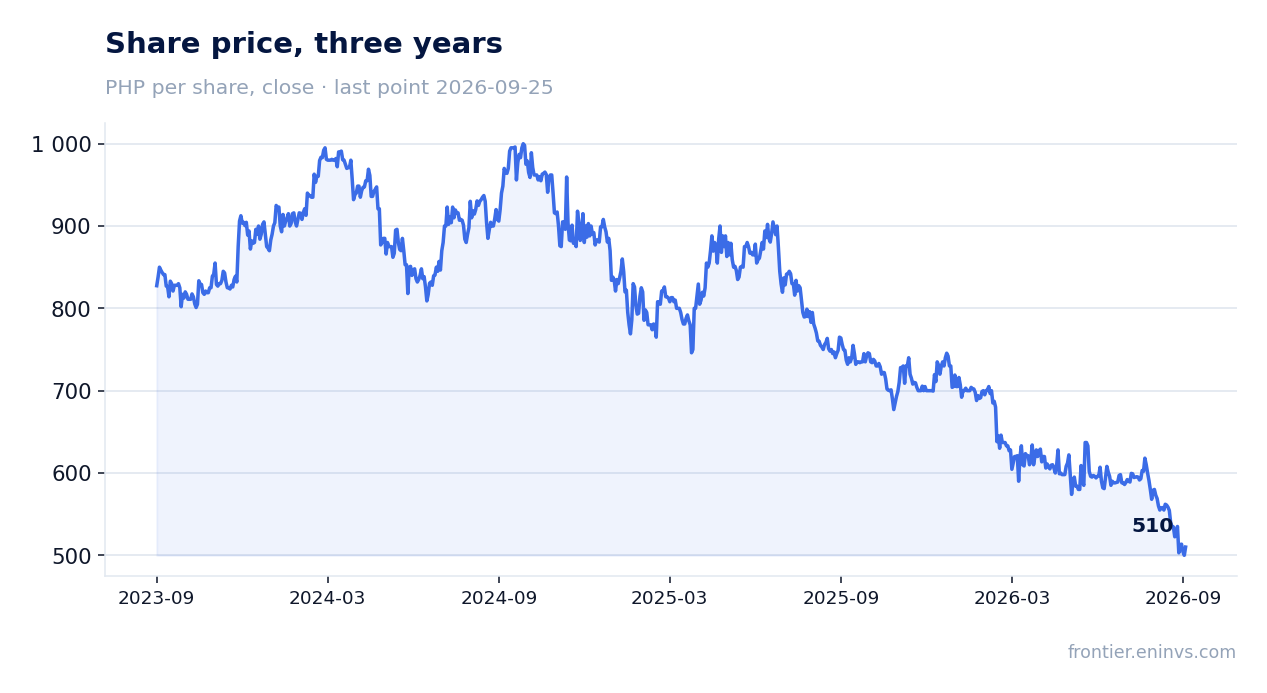
The portal's model implies +21% upside to fair value
According to the portal's model, which compares EBITDA growth with a target multiple and market capitalisation, the fair value of the share is 21% above the current price. This is our own estimate, not a market consensus.
The model incorporates current multiples and expected growth. If the company can accelerate profit growth or improve cash flow, the upside may materialise. However, if margin pressure persists, the estimate may be revised.
Valuation on the latest reported figures
| Metric | Value |
|---|---|
| Market cap | 616 bn PHP |
| P/E (LTM) | 4.8 |
| EV/EBITDA (LTM) | 7.9 |
| P/B | 0.64 |
| Net debt / EBITDA (LTM) | 3.07 |
| ROE | 13.6% |
| Dividend yield (12m) | 3.3% |
Bottom line
Revenue accelerated to +7.5% year-on-year, which is a strong point of the report. However, net profit rose only 6.4%, and the margin declined to 18.5%, indicating cost pressure. The debt load at 3.07x EBITDA LTM is moderate, but the lack of quarterly cash flow data makes it difficult to assess debt servicing. With a P/E LTM of 4.84 and a dividend yield of 3.33%, the share looks undervalued, and the portal's model implies +21% upside. The key question for a holder is whether the company can reverse the negative margin trend and confirm its ability to generate cash flow.
Open the company's financial profile SM →
See also: market overview · valuation map · stock screeners