Polyus: revenue up 13.8% but profit down 64.5% – the gap between the gold price and what reaches the shareholder

On 28 September Polyus reported results for the second quarter of 2026. Revenue rose 13.8% year on year to RUB 176.3 bn, while net profit fell 64.5% to RUB 30.6 bn, with the net margin compressing from 55.7% to 17.4%. At the same time the stock trades at a P/E LTM of 2.9 and EV/EBITDA LTM of 3.4 against its own three-year average of 5.2, while the trailing twelve-month dividend yield stands at 19.7%. Given the discount to its own history and the high dividend yield, the share looks attractive, but the key question is whether the profit decline is one-off.
Key takeaways
— Revenue rose 13.8% year on year, but the quarterly acceleration after the Q4 2025 slump looks like a recovery rather than a sustainable trend
— Net profit fell 64.5% year on year, and the net margin compressed from 55.7% to 17.4% – profit is not following revenue
— Dividend payments over the last 12 months amounted to RUB 192.7 per share, giving a yield of 19.7% – nearly double the 10.5% yield we consider fair for the name
— Leverage at 1.4x EBITDA LTM and cash flow covering dividends leave room for payouts
— Valuation at EV/EBITDA LTM of 3.4 versus the three-year average of 5.2 points to a substantial discount to its own history
— The portal's model estimates upside to fair value of +56% at current commodity prices
Attractiveness
Key figures, RUB bn
| Metric | Q2 2025 | Q2 2026 | Change |
|---|---|---|---|
| Revenue | 155 | 176 | +13.8% |
| EBITDA | 102 | — | — |
| Operating profit | 92.2 | — | — |
| Net profit | 86.2 | 30.6 | -64.5% |
| Operating cash flow | 142 | — | — |
| EBITDA margin | 66.2% | — | — |
| Net margin | 55.7% | 17.4% | -38.3 pp |
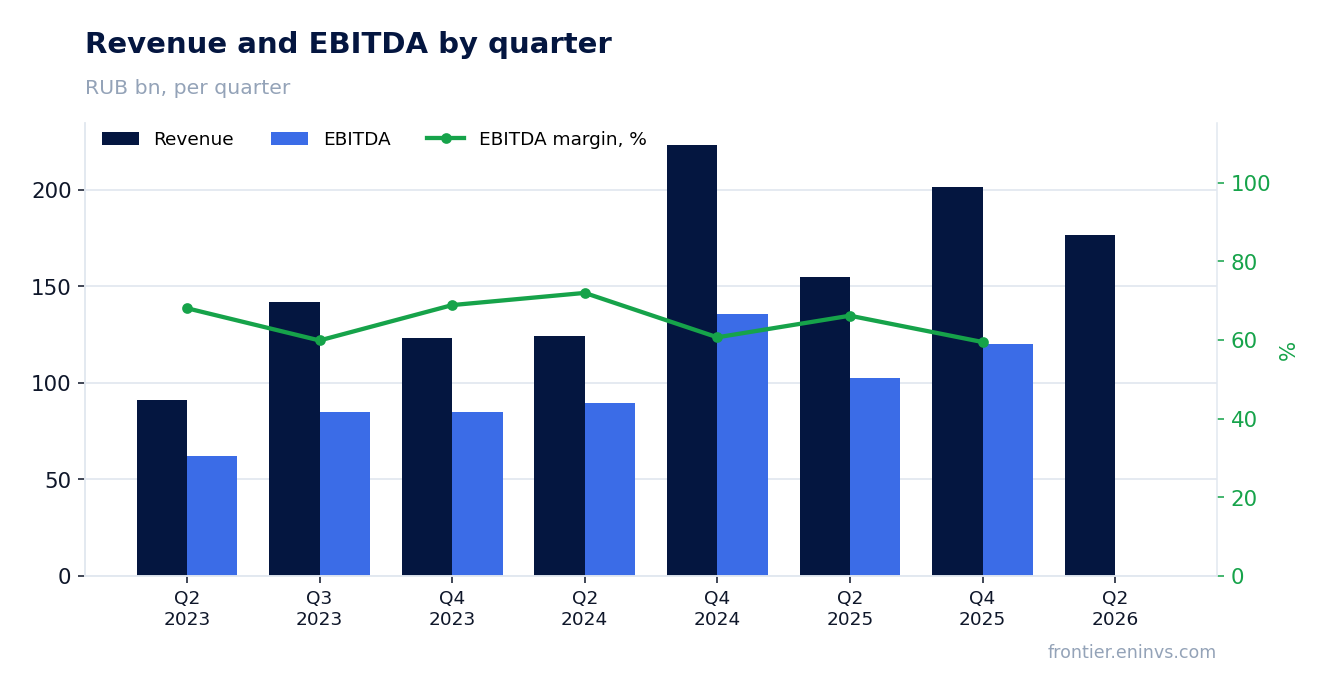
Revenue rose 13.8% year on year, but the quarterly acceleration after the Q4 2025 slump looks like a recovery rather than a sustainable trend
In the second quarter of 2026 Polyus revenue amounted to RUB 176.3 bn, up 13.8% year on year. This is noticeably faster than in the fourth quarter of 2025, when revenue declined 9.8% year on year. The acceleration after the slump is explained primarily by the low base of Q4 2025, not by sustainable growth in demand or prices.
A comparison with previous quarters shows that revenue remains volatile: RUB 124.1 bn in Q2 2024, RUB 223.3 bn in Q4 2024, RUB 154.9 bn in Q2 2025 and RUB 201.5 bn in Q4 2025. Such fluctuations are linked to gold price dynamics and sales volumes, which the company does not disclose in the provided data.
For an investor, what matters more than quarterly acceleration is the ability to sustain revenue at the achieved level. If the 13.8% growth turns out to be a one-off recovery after a weak quarter, the current valuation may not reflect a sustainable trajectory.
Net profit fell 64.5% year on year, and the net margin compressed from 55.7% to 17.4% – profit is not following revenue
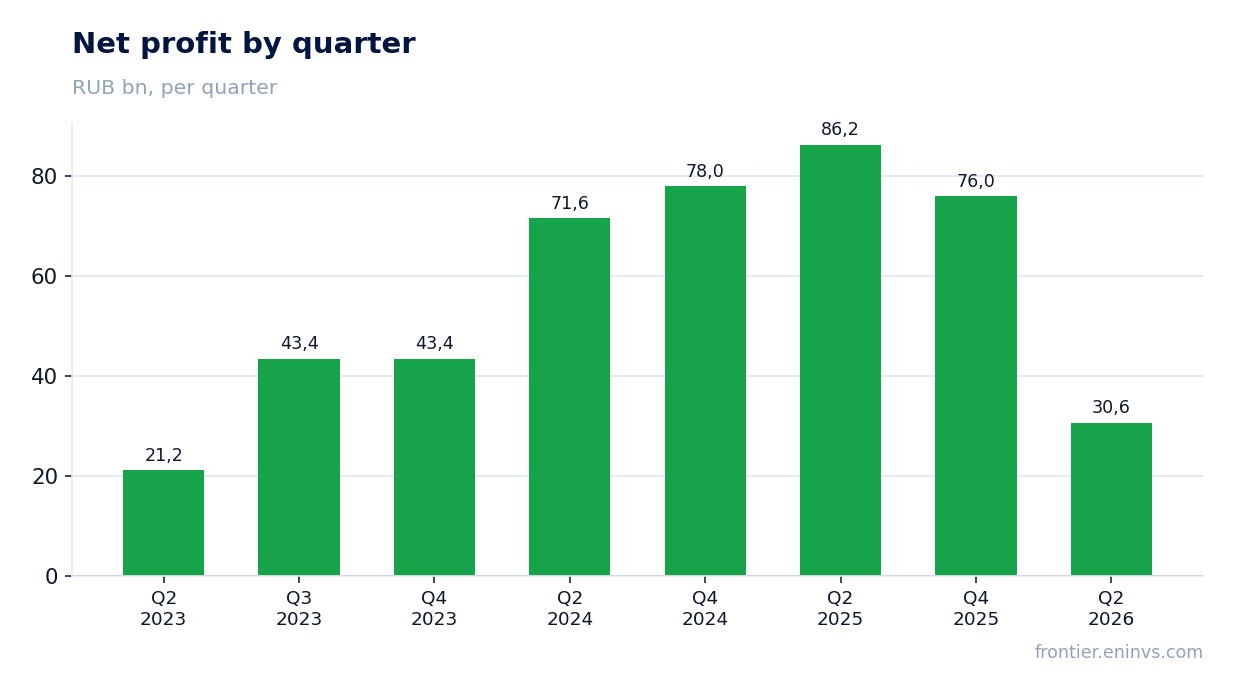
Net profit in the second quarter of 2026 amounted to RUB 30.6 bn, down 64.5% from the same period a year earlier. The net margin fell to 17.4% from 55.7% a year earlier. Such a gap between revenue and profit dynamics points to a sharp rise in costs or one-off write-offs, which the company does not detail in the provided data.
For comparison, in Q4 2025 net profit was RUB 76.0 bn, and in Q2 2025 it was RUB 86.2 bn. The drop to RUB 30.6 bn is not just a seasonal factor but also a serious deterioration in operating efficiency or a rise in non-operating expenses.
If the profit decline is due to one-off factors, it could be offset in subsequent quarters. If it reflects a sustained increase in costs, the current P/E LTM of 2.9 may prove deceptively low, as LTM profit includes stronger previous quarters.
Dividend payments over the last 12 months amounted to RUB 192.7 per share, giving a yield of 19.7% – nearly double the 10.5% yield we consider fair for the name
Over the last 12 months Polyus paid RUB 192.7 per share. At the current price of RUB 1045, this gives a dividend yield of 19.7%. For comparison, the yield we consider fair for this name is 10.5%. Thus, the current yield is nearly double the fair level, which may indicate undervaluation or a risk of dividend cuts.
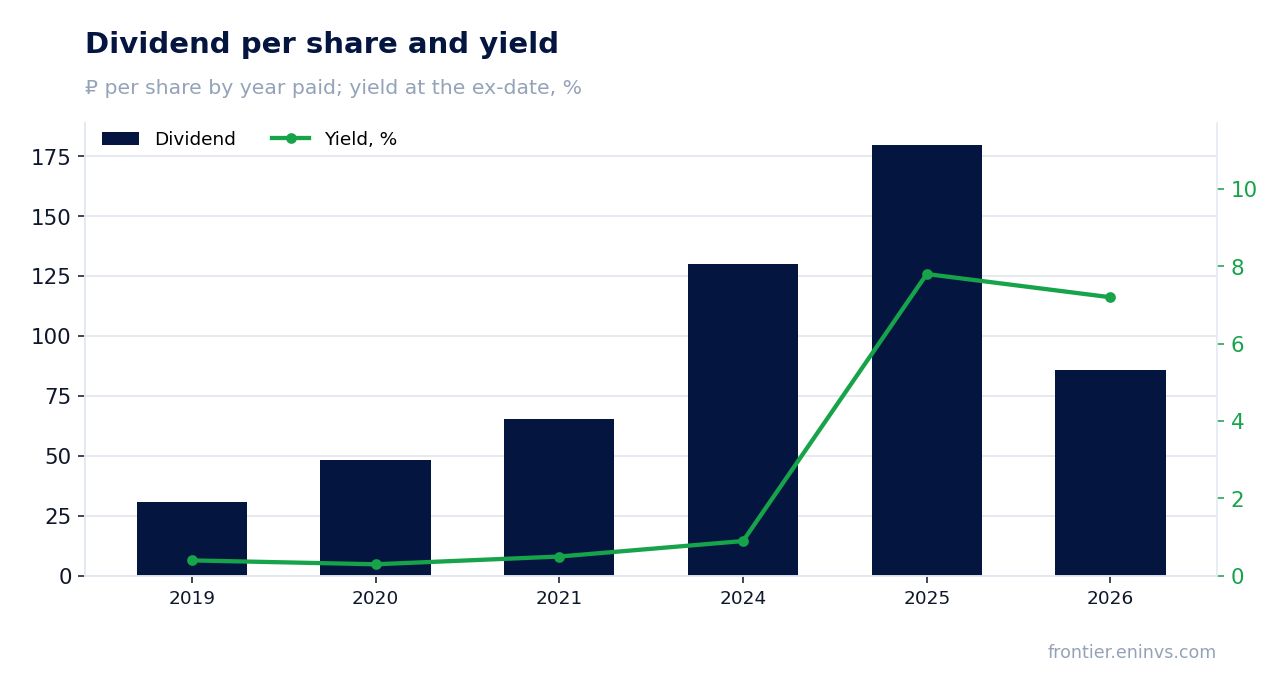
The dividend history shows growth in payouts: RUB 30.66 per share in 2019, RUB 48.493 in 2020, RUB 65.463 in 2021, RUB 130.175 in 2024, RUB 179.85 in 2025. In 2026, RUB 85.85 per share has already been paid. However, our model estimates the next payout at RUB 0.0 per share, implying a pause or cancellation of the dividend in the near term.
The payout ratio according to our calculations is 0.42 of profit. With the key rate at 14.0%, a dividend yield of 19.7% looks attractive, but the sustainability of payouts depends on the company's ability to generate profit. The 64.5% year-on-year drop in net profit creates a risk of a dividend cut in the future.
Leverage at 1.4x EBITDA LTM and cash flow covering dividends leave room for payouts
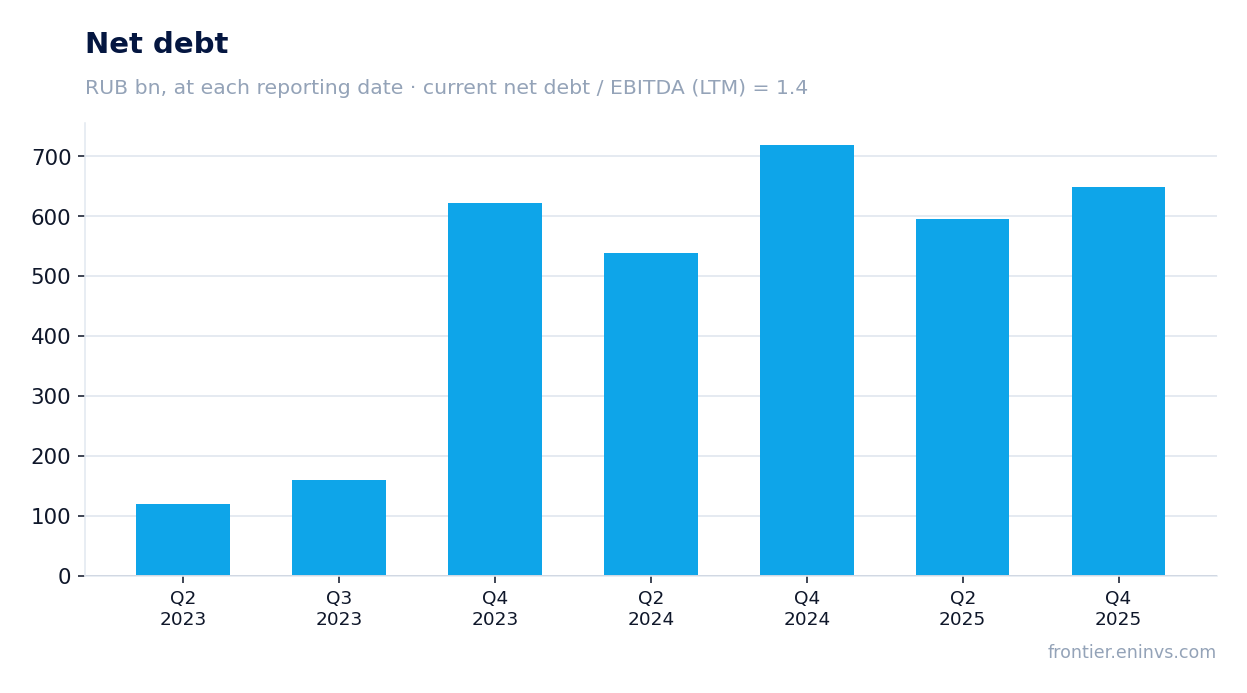
Net debt at the latest reporting date amounts to RUB 649.2 bn. The net debt to EBITDA LTM ratio is 1.4. This is a moderate level that does not create immediate risks to financial stability. However, we do not have data on the previous value of this ratio, so we cannot judge the direction of its change.
Operating cash flow in Q2 2025 was RUB 142.1 bn, and in Q4 2025 it was RUB 125.2 bn. There is no data for Q2 2026. At the same time, EBITDA LTM is RUB 462.4 bn, which comfortably covers interest expenses and dividends.
A debt level of 1.4x EBITDA LTM leaves room for shareholder payouts even if profit declines. However, if the profit decline continues, leverage could rise, limiting dividend capacity.
Valuation at EV/EBITDA LTM of 3.4 versus the three-year average of 5.2 points to a substantial discount to its own history
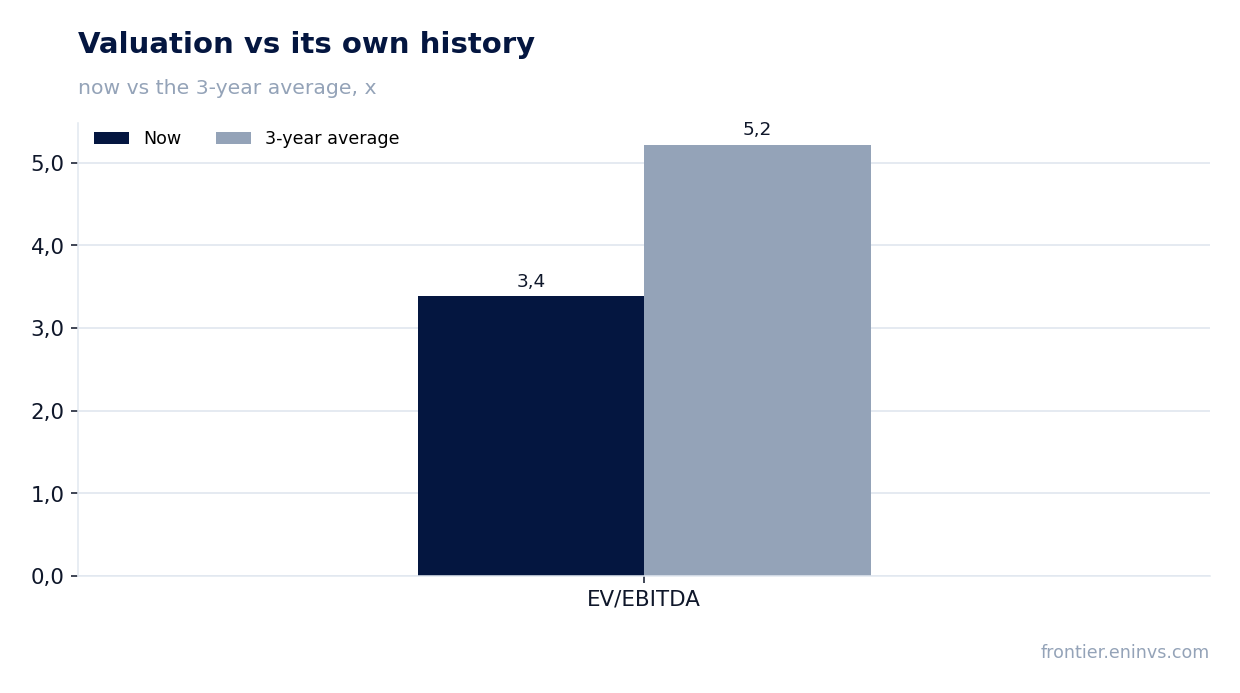
EV/EBITDA LTM is 3.4. The three-year average of this multiple is 5.2. The current level is 35% below its own three-year average, indicating a significant discount. P/E LTM is 2.9, which also looks low, but LTM profit includes stronger previous quarters.
The company's market capitalisation is RUB 916.0 bn. With EBITDA LTM of RUB 462.4 bn and net debt of RUB 649.2 bn, EV/EBITDA LTM indeed stands at 3.4. If profit recovers to previous quarters' levels, the current valuation could prove an attractive entry point.
However, the low multiple may reflect market expectations of further deterioration. Comparison with its own history shows that the market values the company cheaper than the average over the last three years. This creates potential for re-rating if operating results stabilise.
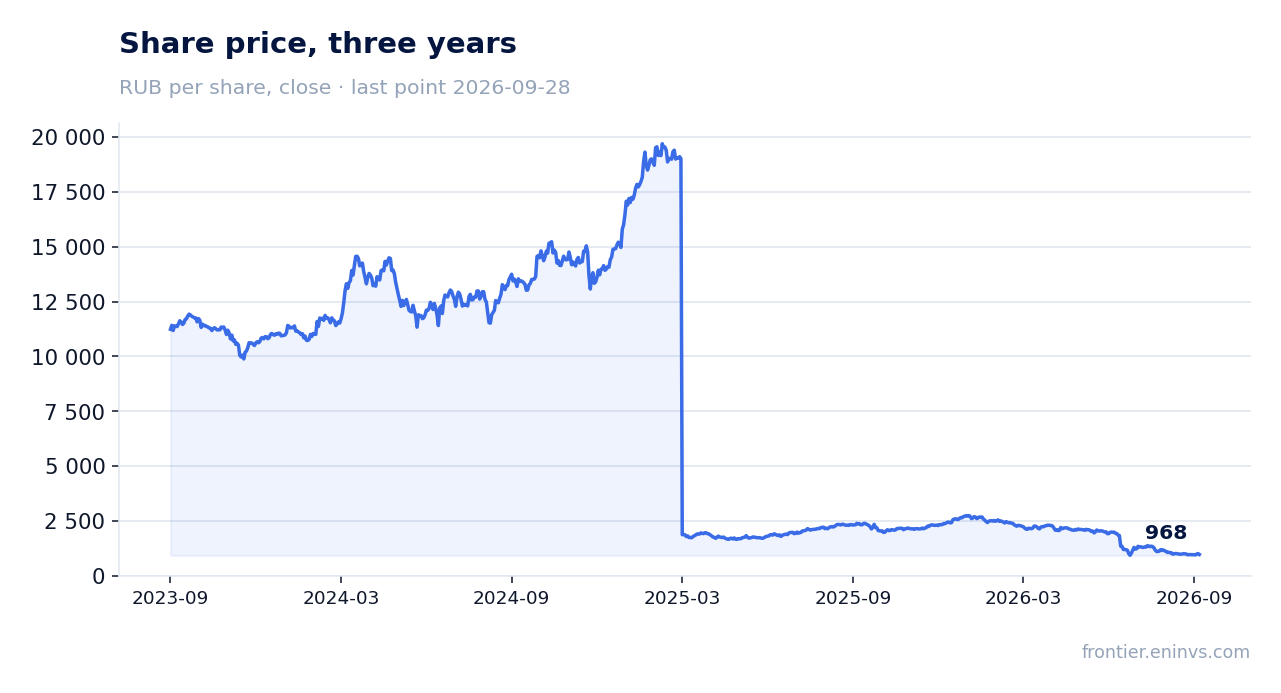
The portal's model estimates upside to fair value of +56% at current commodity prices
According to the portal's model, which re-prices EBITDA at current commodity prices and applies a target EV/EBITDA, the fair value of the share is 56% above the current market price. This is our own estimate, not a market consensus. It assumes that current gold prices persist and that operating performance does not deteriorate further.
The stock is held in our live model strategies on the portal, specifically in RU Commodity-Upside. This is a fact, not an argument for the verdict. Inclusion in the strategy reflects compliance with selection criteria, not a buy recommendation.
The 56% upside looks significant, but it depends entirely on the model's assumptions. If profit continues to fall, fair value could be revised downwards. Nevertheless, even with conservative assumptions, the current valuation offers a margin of safety.
Valuation on the latest reported figures
| Metric | Value |
|---|---|
| Market cap | 916 bn ₽ |
| P/E (LTM) | 2.9 |
| EV/EBITDA (LTM) | 3.4 |
| P/B | 3.37 |
| Net debt / EBITDA (LTM) | 1.40 |
| ROE | 48.4% |
| Dividend yield (12m) | 19.7% |
| EV/EBITDA, 3-year average | 5.2 |
Dividend per share, ₽, and yield at the ex-date
| Year paid | Dividend | Yield |
|---|---|---|
| 2019 | 30.66 | 0.4% |
| 2020 | 48.49 | 0.3% |
| 2021 | 65.46 | 0.5% |
| 2024 | 130.18 | 0.9% |
| 2025 | 179.85 | 7.8% |
| 2026 | 85.85 | 7.2% |
Bottom line
Bottom line: Polyus revenue rose 13.8% year on year, but net profit fell 64.5% and the margin compressed from 55.7% to 17.4%. This is the key question for a holder – whether it is a one-off factor or a sustained deterioration. A dividend yield of 19.7% and EV/EBITDA LTM of 3.4 versus the three-year average of 5.2 make the stock attractive, but our model estimates the next dividend at RUB 0.0 per share, creating uncertainty. The portal's model gives 56% upside, confirming undervaluation at current gold prices. The verdict is 'attractive', but with a caveat regarding the risk of continued weak profit.
Open the company's financial profile PLZL →
See also: market overview · valuation map · stock screeners