American Tower: profit more than doubled, but net debt rose by $7.5bn in the quarter

On 7 August American Tower released its second-quarter 2026 results. Revenue came in at $2,749.1m, up 4.7% year on year, EBITDA at $1,783.2m, and net profit at $887.5m, 2.3 times the $380.5m a year earlier. The main shift in the report is not profit but debt: net debt rose from $35.7bn on 31 March to $43.2bn on 30 June, an increase of $7.5bn in three months. At a price that already reflects its high-yield REIT status, the share looks rather attractive, but the debt build-up is the main argument against.
Key takeaways
— Revenue grew 4.7% year on year, slower than the 6.8% a quarter earlier
— Profit more than doubled, but this is a low-base effect rather than an operational leap
— EBITDA margin stayed almost flat – 64.9% versus 65.0% a year earlier
— Net debt rose from $35.7bn to $43.2bn over the quarter
— Operating cash flow of $1,486.8m covered capital expenditure of $320.9m almost five times over
— Return on equity of 98.0% reflects a thin equity base rather than exceptional profitability
Attractiveness
Key figures, USD bn
| Metric | Q2 2025 | Q2 2026 | Change |
|---|---|---|---|
| Revenue | 2.63 | 2.75 | +4.7% |
| EBITDA | 1.71 | 1.78 | +4.4% |
| Operating profit | 1.20 | 1.27 | +5.9% |
| Net profit | 0.38 | 0.89 | +133.2% |
| Operating cash flow | 1.28 | 1.49 | +16.0% |
| Capex | 0.30 | 0.32 | +5.4% |
| EBITDA margin | 65.0% | 64.9% | -0.1 pp |
| Net margin | 14.5% | 32.3% | +17.8 pp |
Revenue grew 4.7% year on year, slower than the 6.8% a quarter earlier
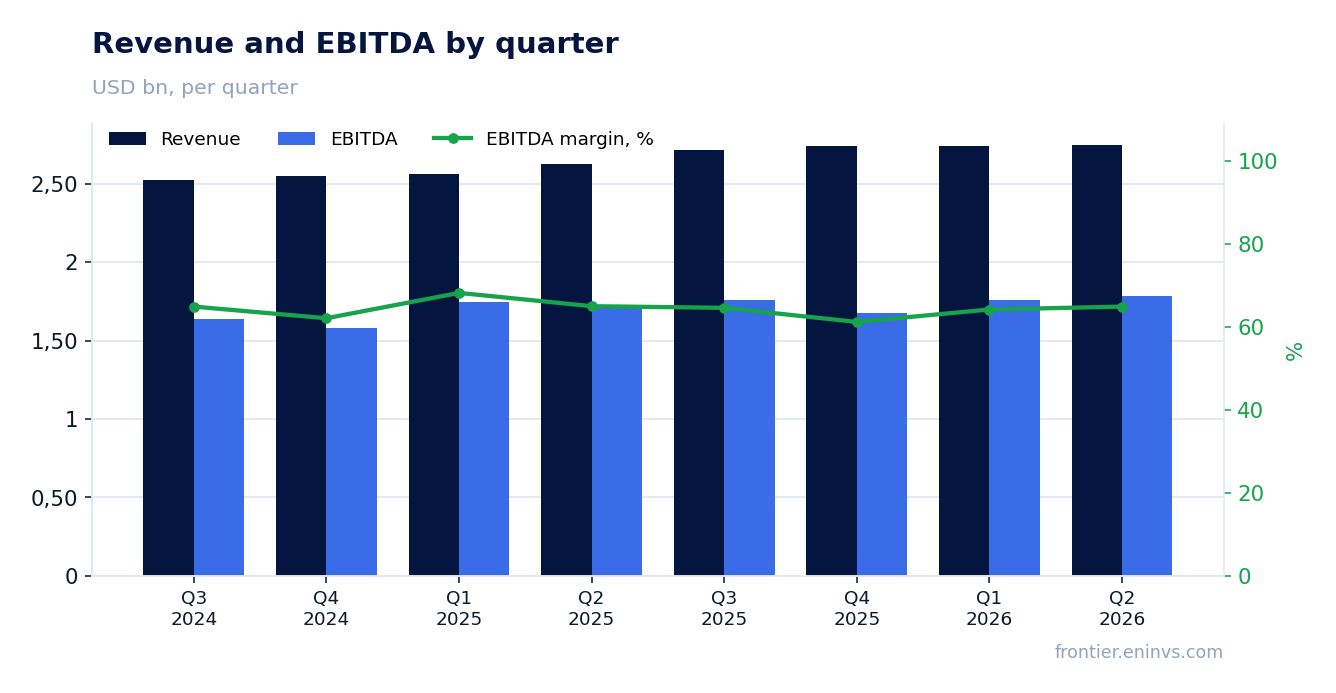
Second-quarter 2026 revenue came in at $2,749.1m, up 4.7% year on year. This is a deceleration from the first quarter, when growth was 6.8%. The slowdown is not sharp, but it breaks the acceleration streak seen since the third quarter of 2025, when growth reached 7.7%.
The core revenue driver remains tower leasing – the heart of American Tower's business. The company does not break down revenue by segment in the provided data, so it is impossible to say which segment slowed. However, the overall trend suggests that organic rental rate growth remains positive but at a more modest pace than in previous quarters.
For an investor, the absolute revenue level matters less than its ability to generate cash flow. With revenue of $2,749.1m, EBITDA came to $1,783.2m, or 64.9% of revenue. This means that most of the revenue converts into operating profit before depreciation, which is typical for infrastructure REITs.
Profit more than doubled, but this is a low-base effect rather than an operational leap
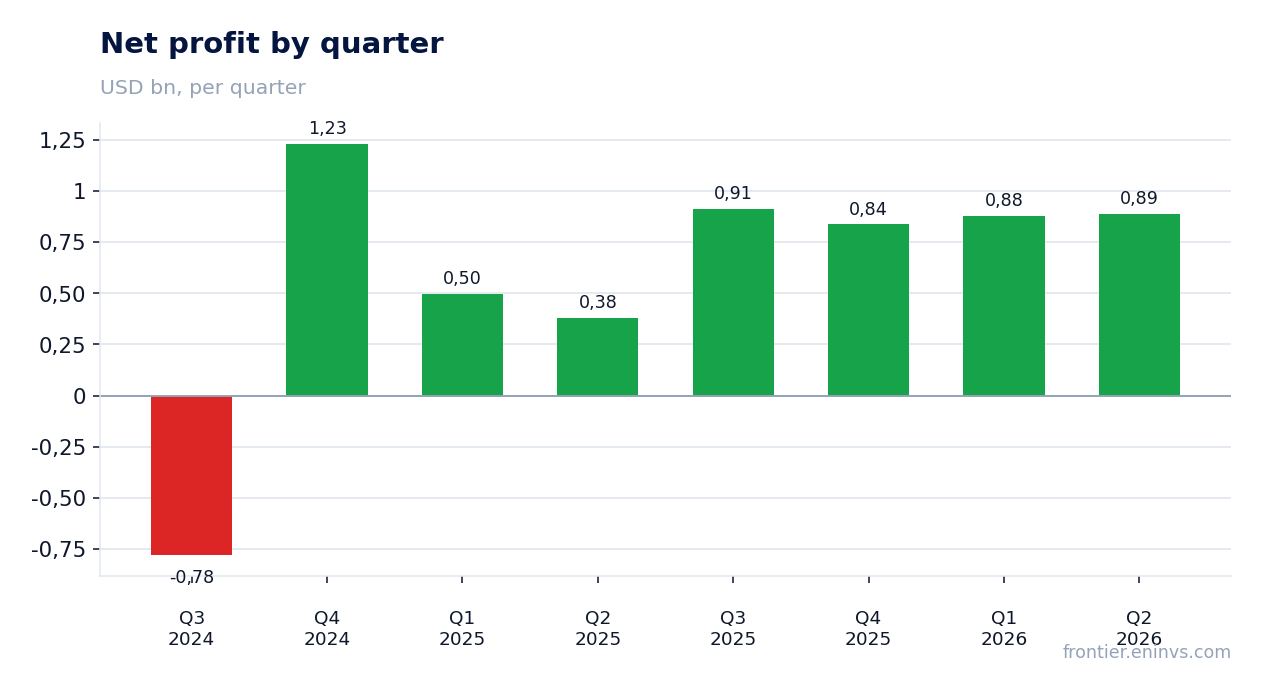
Net profit in the second quarter of 2026 was $887.5m, up 133.2% from $380.5m a year earlier. Such growth looks impressive, but it is explained by a low base: in the second quarter of 2025, profit was depressed by one-off factors that did not repeat this year. Operating profit grew by only 5.9% – from $1,197.7m to $1,268.8m, which is far more modest.
The net margin rose to 32.3% from 14.5% a year earlier. This jump also reflects the low base of the previous year rather than an improvement in operational efficiency. The EBITDA margin remained virtually unchanged – 64.9% versus 65.0%, confirming that operational efficiency has not changed significantly.
Thus, the 2.3-fold profit growth is mainly a recovery effect after a weak second quarter of 2025. For assessing business sustainability, the dynamics of EBITDA and operating profit, which are growing at moderate rates, are more important.
EBITDA margin stayed almost flat – 64.9% versus 65.0% a year earlier
EBITDA in the second quarter of 2026 was $1,783.2m, up 4.4% year on year. EBITDA growth almost matches revenue growth, so the margin remained at 64.9% versus 65.0% a year earlier. This indicates stability in operating costs: the company did not face a significant increase in expenses that could have squeezed the margin.
Stability at such a high margin level is a key advantage of the tower business. However, for an investor, it is important that the margin is not growing: the company is not demonstrating operating leverage, meaning additional revenue does not bring disproportionately higher profit. This limits the potential for profit acceleration in the future.
The report does not disclose the cost structure, so it is impossible to say which expense line affected the margin. But the fact that the margin remained virtually unchanged suggests that revenue growth was accompanied by a proportional increase in operating expenses.
Net debt rose from $35.7bn to $43.2bn over the quarter
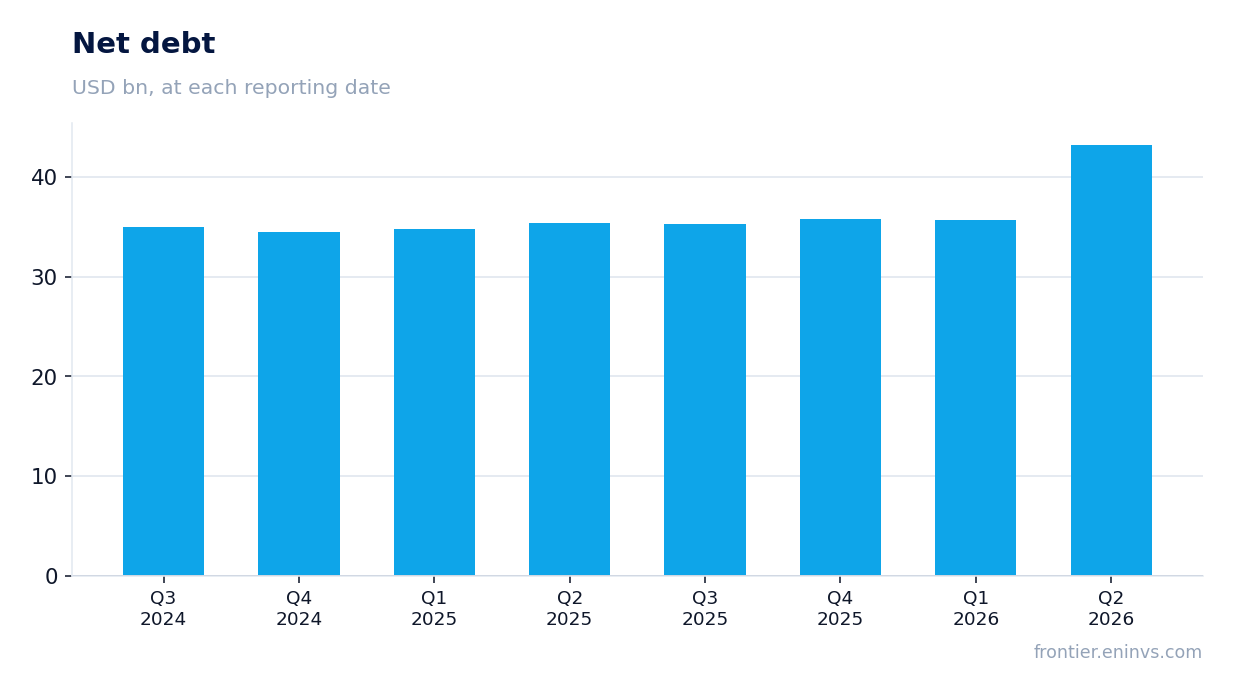
Net debt as of 30 June 2026 was $43.2bn. This is $7.5bn more than on 31 March 2026, when it stood at $35.7bn. Over the year, net debt increased by $7.8bn – from $35.4bn on 30 June 2025. Such debt growth is the main negative in the report.
The reason for the debt increase is not disclosed in the provided data. However, it can be noted that operating cash flow for the quarter was $1,486.8m, while capital expenditure was only $320.9m. This means the business generates significant free cash flow that could have been used to reduce debt. Nevertheless, debt grew, which may indicate large investments or shareholder payouts not reflected in the provided data.
For a REIT with a high share of debt financing, the debt level is critical. The net debt to EBITDA ratio is not provided, so it is impossible to assess how critical the burden is. However, an absolute debt increase of $7.5bn in a quarter is a significant change that requires attention.
Operating cash flow of $1,486.8m covered capital expenditure of $320.9m almost five times over
Operating cash flow in the second quarter of 2026 was $1,486.8m. Capital expenditure for the same period was $320.9m. Thus, free cash flow before debt operations and dividends was about $1,165.9m. This is a solid figure, indicating the business's ability to fund its investments from internal sources.
For comparison: a year earlier, operating cash flow was $1,281.5m, and capital expenditure was $304.6m. Operating cash flow growth of 16.0% with capital expenditure rising only 5.4% means the company improved its cash conversion. This is a positive signal that partially offsets the debt increase.
However, it is important to understand that operating cash flow can be volatile due to changes in working capital. In this case, the flow growth appears sustainable, as it is accompanied by revenue and EBITDA growth. Nevertheless, if debt continues to grow at such a pace, even strong operating cash flow may not cover financing needs.
Return on equity of 98.0% reflects a thin equity base rather than exceptional profitability
American Tower's return on equity (ROE) is 98.0%. Such a high figure usually indicates exceptional profitability, but in this case it is explained by the capital structure: the company finances assets mainly with debt, so equity is small. With net profit over the last 12 months and relatively small equity, ROE mechanically turns out very high.
For a REIT, a high share of debt financing is the norm, as they are required to distribute most of their profit as dividends. However, this increases financial risk: if interest rates rise, the cost of servicing debt increases, which can reduce profit and dividends. The report does not disclose interest expenses, so it is impossible to assess how comfortably the company services its debt.
An investor should not rely on ROE as a measure of efficiency in isolation from the capital structure. EBITDA margin and operating cash flow dynamics are more informative, showing the stability of the business.
Valuation on the latest reported figures
| Metric | Value |
|---|---|
| Operating cash flow (LTM) | 5.77 bn |
| ROE | 98.0% |
Bottom line
American Tower reported second-quarter 2026 results with revenue growth of 4.7% and profit more than doubling, but the latter is a low-base effect from the previous year. Operational efficiency is stable: EBITDA margin of 64.9%, operating cash flow of $1,486.8m covering capital expenditure almost five times over. The main issue is the increase in net debt from $35.7bn to $43.2bn over the quarter. At the current price, the share looks rather attractive for income-oriented investors, but debt growth is a key risk that could change the assessment.
Open the company's financial profile AMT →
See also: market overview · valuation map · stock screeners