APA Corporation: profit up a quarter, but revenue leans on last year's base rather than the oil price

APA Corporation reported second-quarter 2026 results. Revenue rose 9.0% year on year to USD 2,373m, EBITDA by 28.3% to USD 1,726m, and net profit by 23.9% to USD 747m. The EBITDA margin climbed to 68.5% from 58.2% a year earlier, while net debt fell to USD 3,437m. The share looks attractive: trailing-twelve-month EV/EBITDA is 3.24 against its own three-year average of 2.85, debt is 0.69 EBITDA, and the 2.23% dividend yield sits alongside the portal model's fair-value upside.
Key takeaways
— Revenue rose 9.0% year on year, but this is a reversal after three quarters of decline, not an acceleration
— EBITDA added 28.3% and the margin rose to 68.5% – profit growth outpaces revenue
— Net profit rose 23.9% to USD 747m at a 31.5% margin
— Quarterly operating cash flow was USD 1,706m – nearly three times capital expenditure
— Net debt fell to USD 3,437m, or 0.69 times LTM EBITDA
— The 2.23% dividend yield rests on profit and cash flow
— EV/EBITDA of 3.24 against its own three-year average of 2.85 – the share is above its own history
Attractiveness
Key figures, USD bn
| Metric | Q2 2025 | Q2 2026 | Change |
|---|---|---|---|
| Revenue | 2.18 | 2.37 | +9.0% |
| EBITDA | 1.27 | 1.63 | +28.3% |
| Operating profit | 0.74 | 1.22 | +65.8% |
| Net profit | 0.60 | 0.75 | +23.9% |
| Operating cash flow | 1.18 | 1.71 | +44.5% |
| Capex | 0.66 | 0.57 | -13.8% |
| EBITDA margin | 58.2% | 68.5% | +10.3 pp |
| Net margin | 27.7% | 31.5% | +3.8 pp |
Revenue rose 9.0% year on year, but this is a reversal after three quarters of decline, not an acceleration
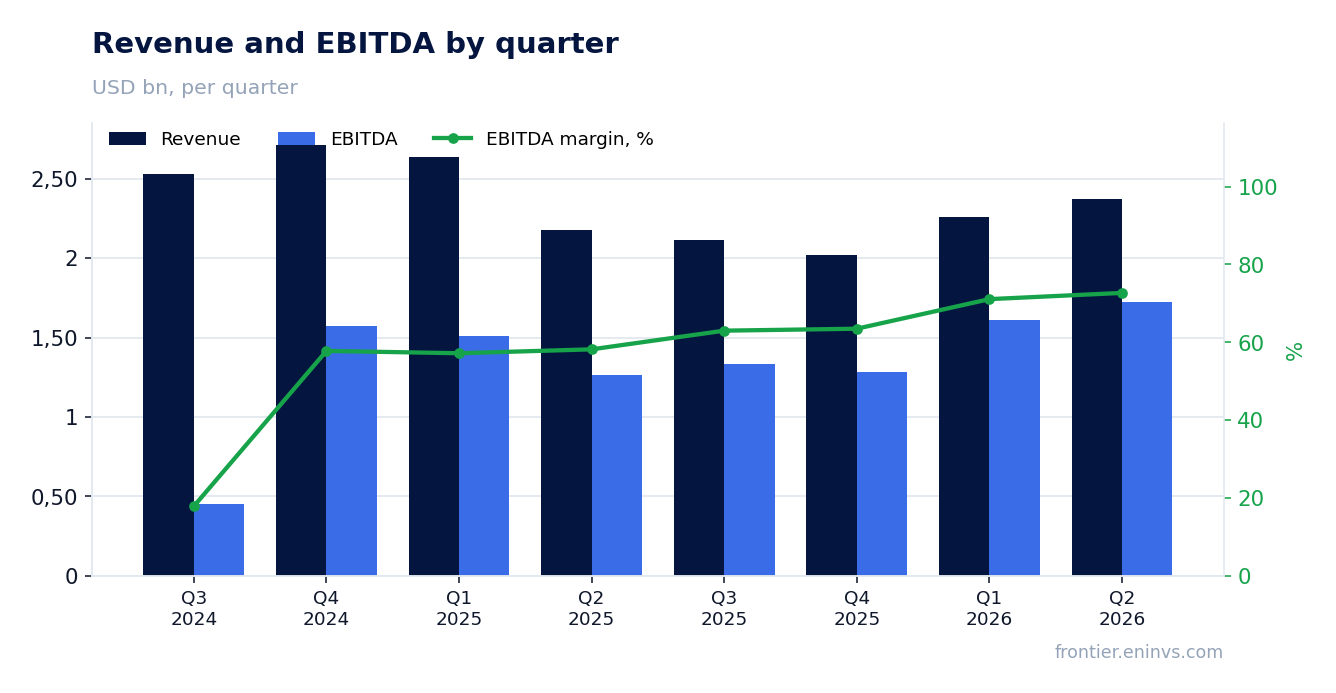
In the second quarter of 2026, revenue was USD 2,373m, up 9.0% year on year. This is the first quarterly growth after three periods of decline: in Q1 2026 revenue fell 14.2%, in Q4 2025 by 25.5%, and in Q3 by 16.4%. The reversal came against the low base of Q2 2025, when revenue dropped 14.4%.
The sequential comparison shows revenue also grew from the previous quarter: 2,373m versus 2,261m in Q1 2026. This is the second consecutive quarterly increase, indicating a recovery after the slump at the end of 2025. However, the 9.0% annual growth does not yet offset the declines of previous quarters – trailing twelve-month revenue was USD 8,800m.
Revenue dynamics matter for assessing profit sustainability. If growth continues, it will confirm the company has adapted to the price environment. If it proves one-off against a low base, pressure on profit will return.
EBITDA added 28.3% and the margin rose to 68.5% – profit growth outpaces revenue
EBITDA in Q2 2026 rose 28.3% year on year to USD 1,726m. This is significantly faster than the 9.0% revenue growth, expanding the EBITDA margin to 68.5% from 58.2% a year earlier. Such a gap means the company not only sold more but also substantially improved unit profitability.
The 10.3 percentage point margin increase is a key factor in the report. It could be explained by lower unit costs, a change in sales mix, or one-off factors. The materials do not disclose which cost line produced this effect, so we record the result without attributing it to a specific cause.
Operating profit in Q2 2026 was USD 1,222m versus USD 737m a year earlier. Operating profit growth of 65.8% also outpaces revenue dynamics, confirming improved operating efficiency. Over the trailing twelve months, EBITDA was USD 6,214.7m.
Net profit rose 23.9% to USD 747m at a 31.5% margin
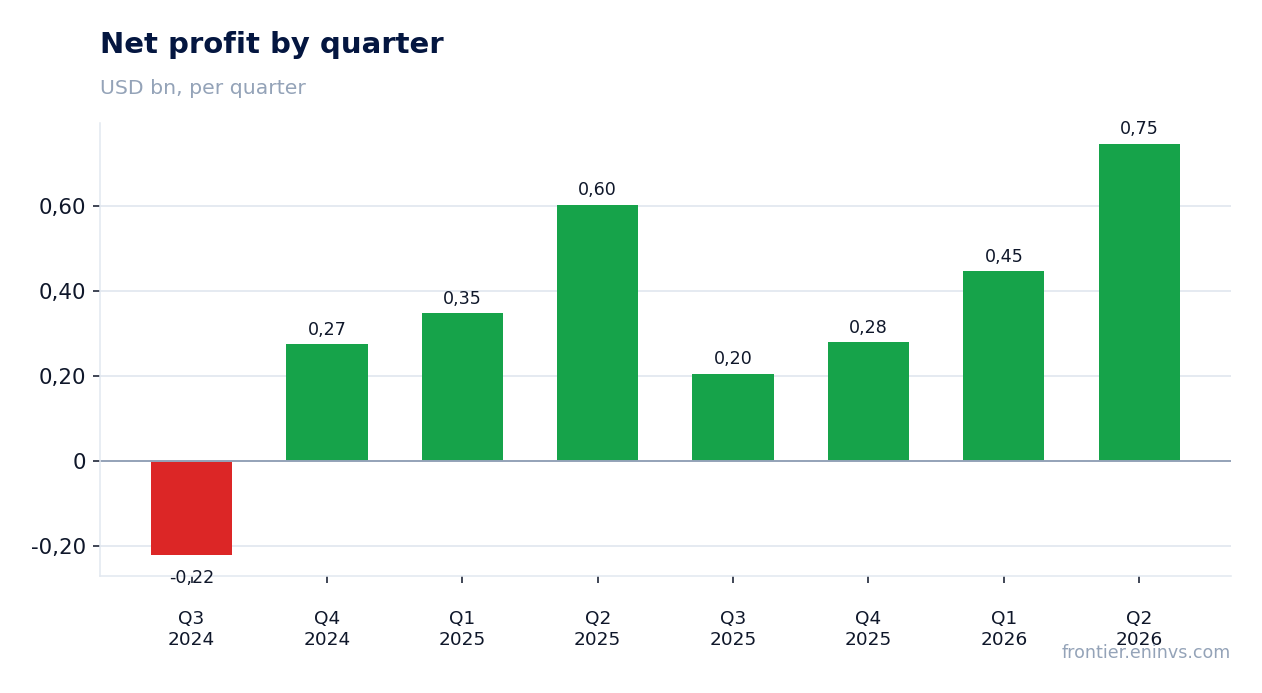
Net profit in Q2 2026 was USD 747m, up 23.9% year on year. Profit growth lags EBITDA growth of 28.3%, indicating higher expenses below the operating line – possibly interest or taxes. The net margin rose to 31.5% from 27.7% a year earlier.
Over the trailing twelve months, net profit was USD 1,677m. Return on equity (ROE) for the period was 44.3%, reflecting high capital efficiency. However, such a high ROE may result from either high profit or relatively small equity.
It is important to note that the 23.9% net profit growth is for the reported period, not LTM. The LTM profit of USD 1,677m includes four quarters and cannot be directly compared with quarterly profit.
Quarterly operating cash flow was USD 1,706m – nearly three times capital expenditure
Operating cash flow in Q2 2026 was USD 1,706m, significantly above USD 1,181m a year earlier. This is the highest quarterly figure in at least two years. Capital expenditure for the quarter was USD 569m, down from USD 660m a year earlier.
The ratio of operating cash flow to capital expenditure is about 3 to 1, indicating a strong ability to generate free cash flow. Over the trailing twelve months, operating cash flow was USD 4,500m, while capital expenditure was about USD 2,514m (sum of four quarters). This leaves a substantial amount after investments.
Such cash flow supports both dividend payments and debt reduction. In Q2 2026, net debt fell to USD 3,437m from USD 4,243m in Q1. The USD 806m quarterly debt reduction was partly financed by operating cash flow.
Net debt fell to USD 3,437m, or 0.69 times LTM EBITDA
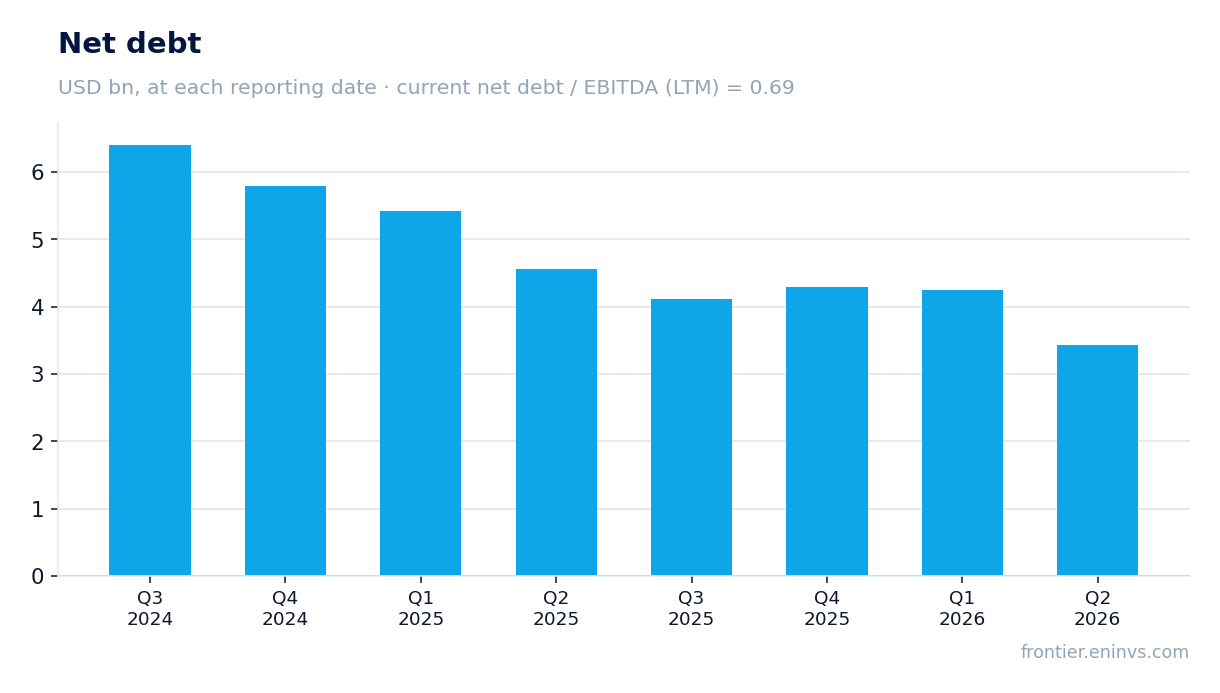
Net debt at the end of Q2 2026 was USD 3,437m, down from USD 4,243m in Q1 and USD 4,557m a year earlier. Over the trailing twelve months, net debt decreased by USD 1.3bn. The ratio of net debt to LTM EBITDA is 0.69, a low level of leverage.
Debt reduction is occurring alongside EBITDA growth, further improving the coverage ratio. However, we cannot claim that leverage decreased because the previous value of this ratio is not in the facts. We record the current level of 0.69 as a fact.
Low leverage gives the company resilience to a possible decline in oil prices and preserves the ability to fund dividends even if conditions worsen. Interest expenses are not disclosed, but at this debt level they are likely not a major factor affecting net profit.
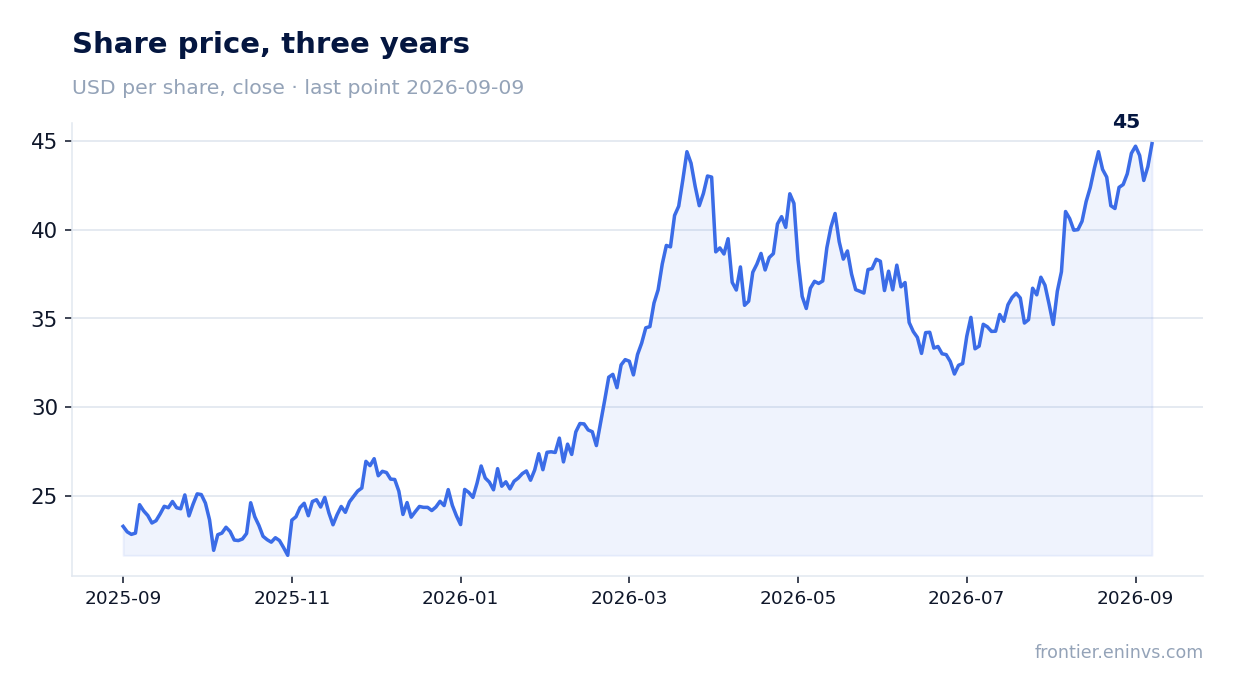
The 2.23% dividend yield rests on profit and cash flow
The trailing twelve-month dividend yield is 2.23%. The company pays dividends covered by both net profit and operating cash flow. With LTM net profit of USD 1,677m and a market capitalisation of USD 15,827m, the price-to-earnings ratio (P/E) is 9.44.
Our estimate for the current year's dividend assumes the current yield is maintained with stable profit. The payout rests on profit and cash flow, which grew significantly in the latest quarter. If operating cash flow remains at USD 1,706m per quarter, the dividend will be well covered.
The 2.23% yield is below the key rate, but for an oil and gas company with low leverage and growing profit it looks sustainable. The risk of a dividend cut is linked to falling oil prices and reduced free cash flow, but the current debt level of 0.69 EBITDA provides a margin of safety.
EV/EBITDA of 3.24 against its own three-year average of 2.85 – the share is above its own history
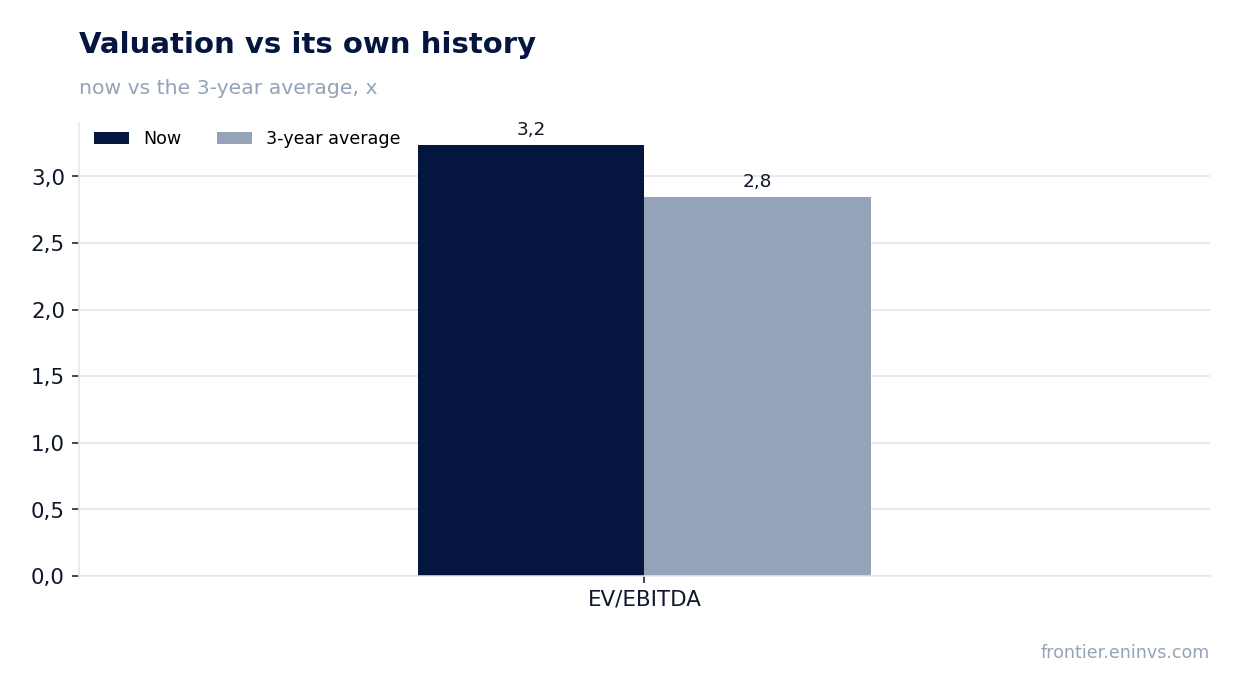
Trailing twelve-month EV/EBITDA is 3.24, above its own three-year average of 2.85. This means that at the current price the share is valued higher than its average over the past three years. The gap is about 14% to the average.
The trailing twelve-month P/E is 9.44. With a market capitalisation of USD 15,827m and net debt of USD 3,437m, EV is about USD 19,264m. The EV/EBITDA ratio of 3.24 is lower than the P/E, reflecting the significant share of debt in the capital structure, though debt itself is low.
According to the portal's model, which re-prices EBITDA at current commodity prices at the target EV/EBITDA, the share's upside to fair value is -39%. This is our own estimate, not a market consensus. It indicates that at current oil prices the share may be overvalued relative to the model.
Valuation on the latest reported figures
| Metric | Value |
|---|---|
| Market cap | 15.8 bn USD |
| P/E (LTM) | 9.4 |
| EV/EBITDA (LTM) | 3.2 |
| P/B | 2.60 |
| Net debt / EBITDA (LTM) | 0.69 |
| Operating cash flow (LTM) | 4.50 bn |
| ROE | 44.3% |
| Dividend yield (12m) | 2.2% |
| EV/EBITDA, 3-year average | 2.8 |
Bottom line
In Q2 2026, APA Corporation delivered strong profit growth: EBITDA rose 28.3%, net profit by 23.9%, and the EBITDA margin climbed to 68.5%. Operating cash flow of USD 1,706m was nearly three times capital expenditure, and net debt fell to USD 3,437m at 0.69 times EBITDA. However, the 9.0% revenue growth is a reversal after three quarters of decline, and the sustainability of this reversal is not yet confirmed. The EV/EBITDA valuation of 3.24 is above its own three-year average of 2.85, and the portal model gives -39% upside. The share looks attractive due to low leverage and strong cash flow, but another quarter of positive revenue dynamics is needed for confirmation.
Open the company's financial profile APA →
See also: market overview · valuation map · stock screeners