ACUITY INC. (DE): profit up 43%, but half the gain came from a one-off tariff refund

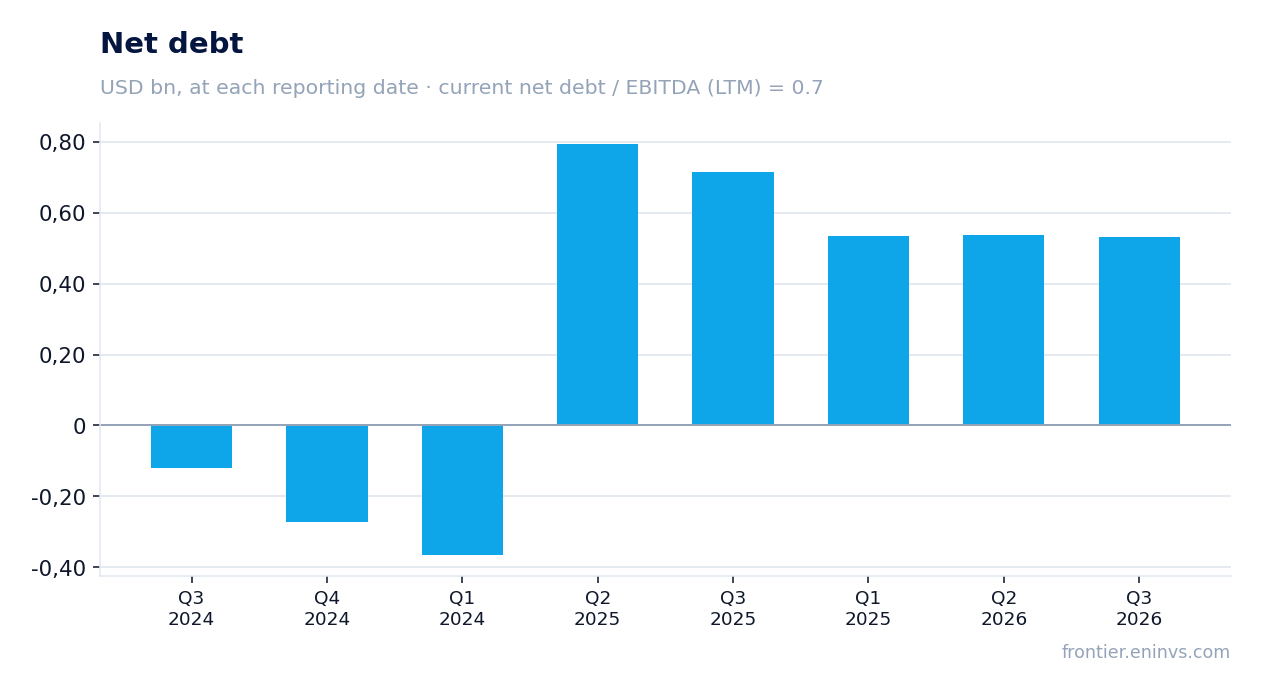
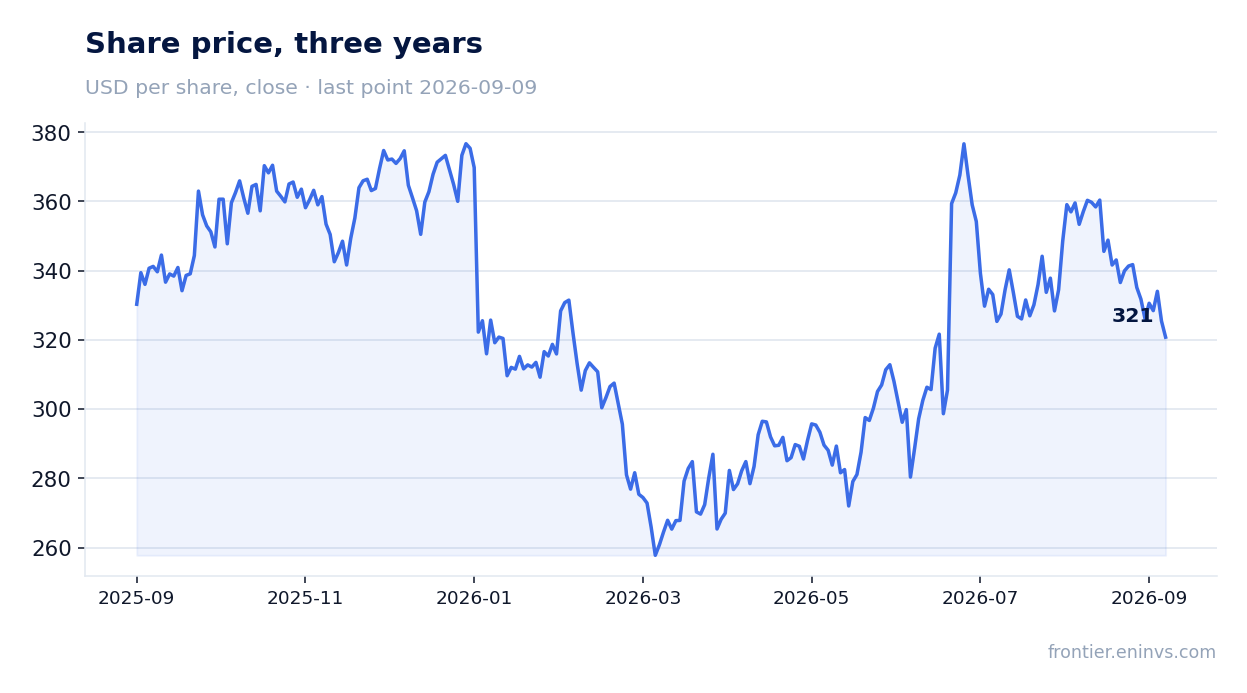
On 25 June ACUITY INC. (DE) reported results for the third quarter of fiscal 2026. Revenue rose 1.6% year on year to $1,198.0 million, EBITDA – by 33.0% to $234.0 million, net profit – by 43.3% to $141.0 million. The gap between sales and profit growth is explained by a one-off tariff refund of $6.4 million and a low base a year earlier, when the accounts included $29.7 million of special charges. The share added 17.6% on the release day, but trades at 12.5 times EV/EBITDA – slightly above its own three-year average, so at the current price the stock looks rather attractive than neutral.
Key takeaways
— Revenue grew just 1.6%, and all the growth came from the Acuity Intelligent Spaces segment
— EBITDA added 33% mainly due to a low base a year earlier and a one-off tariff refund
— EBITDA margin rose to 19.4% thanks to the disappearance of one-off charges
— Operating cash flow for nine months rose 30.4% to $520.2 million
— Debt load of 0.7 EBITDA LTM is comfortable, but the trend is not disclosed
— Dividend yield of 0.24% offers no support, but the payout ratio remains low
— Valuation at 12.5 EV/EBITDA LTM is slightly above its own three-year average of 12.0
Attractiveness
Key figures, USD bn
| Metric | Q3 2025 | Q3 2026 | Change |
|---|---|---|---|
| Revenue | 1.18 | 1.20 | +1.6% |
| EBITDA | 0.17 | 0.23 | +33.0% |
| Operating profit | 0.14 | 0.19 | +38.3% |
| Net profit | 0.10 | 0.14 | +43.3% |
| Operating cash flow | 0.21 | 0.29 | +40.0% |
| Capex | 0.01 | 0.02 | +11.3% |
| EBITDA margin | 14.8% | 19.4% | +4.6 pp |
| Net margin | 8.3% | 11.8% | +3.5 pp |
Revenue grew just 1.6%, and all the growth came from the Acuity Intelligent Spaces segment
In the third quarter of fiscal 2026 revenue was $1,198.0 million, up 1.6% from a year earlier. This is noticeably slower than in previous quarters: in the first quarter of 2026 growth was 20.2%, in the second – 4.9%. The slowdown is due to the core Acuity Brands Lighting segment cutting sales by 1.9% to $905.2 million.
All the growth came from the Acuity Intelligent Spaces segment: its revenue rose 14.9% to $303.5 million. Within ABL, sales through the independent network added only 0.8%, while the direct channel fell 27.7%. The company explains this by general market conditions, but gives no specific reasons in the release.
For nine months revenue rose 8.3% to $3,397.4 million, but this growth was almost entirely delivered in the first half. In the third quarter the dynamics almost stalled, and this is the main question for the report: whether AIS can continue to offset the weakness in ABL.
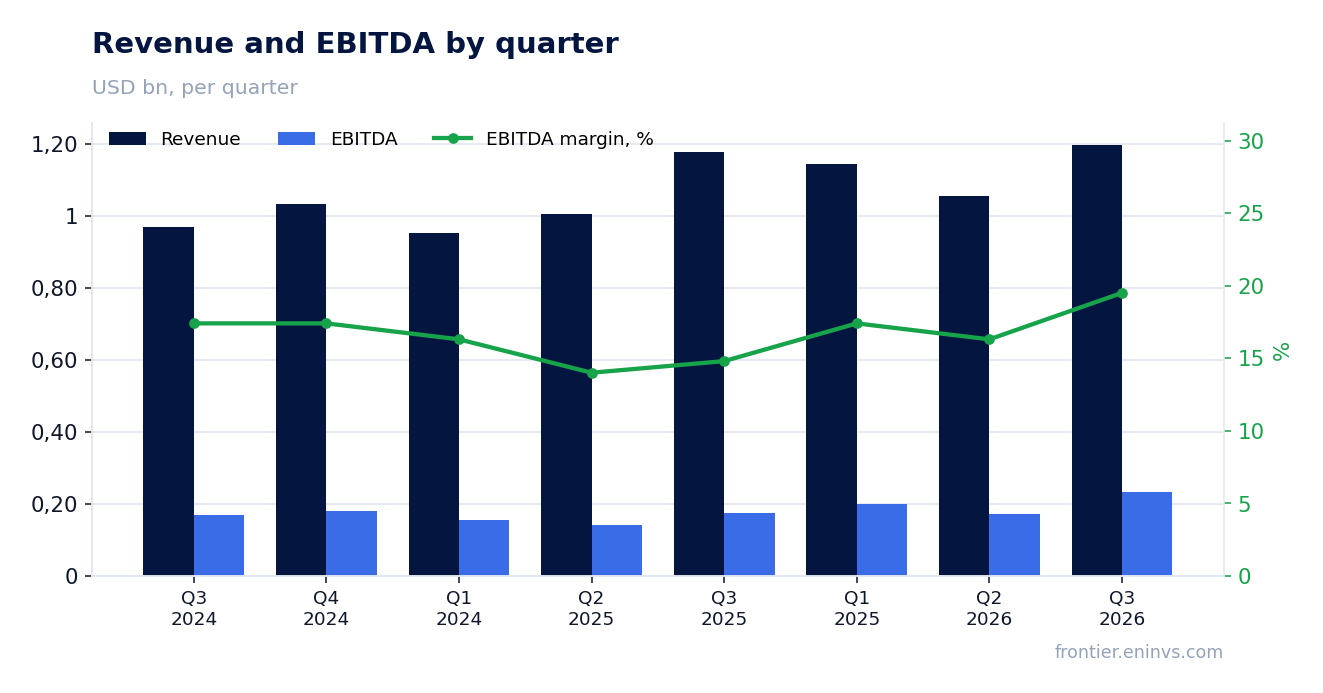
EBITDA added 33% mainly due to a low base a year earlier and a one-off tariff refund
EBITDA in the third quarter of 2026 rose 33.0% year on year to $234.0 million. However, adjusted EBITDA, which excludes one-off items, added only 2.1% to $241.2 million. The gap is explained by the fact that a year earlier the accounts included special charges of $29.7 million and acquired profit in inventory of $19.2 million, which are now absent.
An additional contribution came from a tariff refund of $6.4 million in the Acuity Brands Lighting segment, reflected as a non-GAAP adjustment. Without it, adjusted operating profit would have grown 0.8% rather than 2.1%. Thus operating dynamics remain weak, and profit growth is mainly due to the comparison base.
So the 33% rise in EBITDA is largely an effect of the low base and one-off items, not an improvement in operating efficiency. Sustainable profit growth has not yet been confirmed.
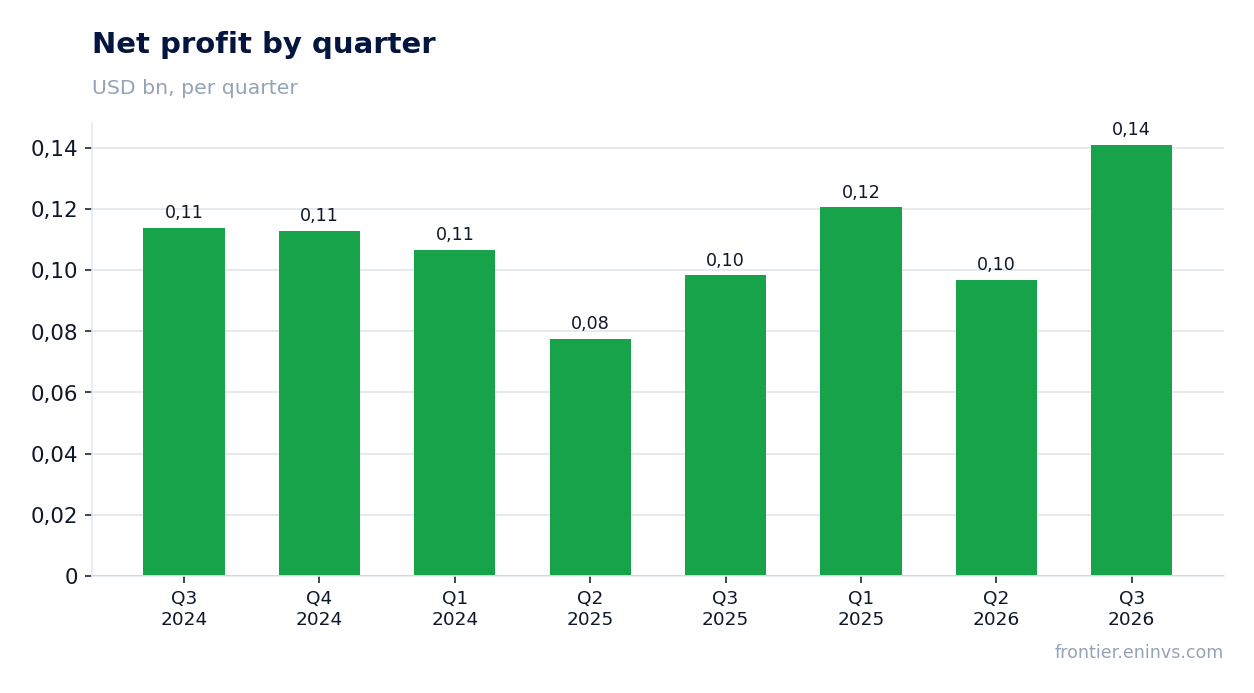
EBITDA margin rose to 19.4% thanks to the disappearance of one-off charges
EBITDA margin in the third quarter of 2026 was 19.4% versus 14.8% a year earlier. The 4.6 percentage point rise looks impressive, but it is almost entirely explained by the absence of special charges and acquired profit in inventory, which lowered the base a year earlier.
Adjusted EBITDA margin rose only 0.1 pp to 20.1%. This means that excluding one-off factors the company did not improve its operating efficiency. Gross margin rose to 50.6% from 48.4%, but here too the effect comes from the absence of acquired profit in inventory.
In the Acuity Intelligent Spaces segment operating margin rose to 18.6% from 10.4%, but this is also due to the absence of one-off items. In Acuity Brands Lighting margin rose to 17.7% from 14.5%, but adjusted margin fell 0.6 pp to 18.2%.
Operating cash flow for nine months rose 30.4% to $520.2 million
For the nine months of fiscal 2026 operating cash flow was $520.2 million, up 30.4% from a year earlier. Free cash flow rose 29.9% to $461.7 million. This is a strong result that confirms the company's ability to generate cash.
However, in the third quarter alone operating cash flow was $290.3 million versus $207.3 million a year earlier. The growth is mainly due to changes in working capital: inventories fell by $66.9 million, while receivables rose by $16.6 million. This could be either an improvement in management or a one-off factor.
Capital expenditure for nine months was $58.5 million, slightly above last year's $43.6 million. The company also repurchased $230 million of shares, which supports earnings per share. The cash position remains comfortable: $411.9 million on accounts.
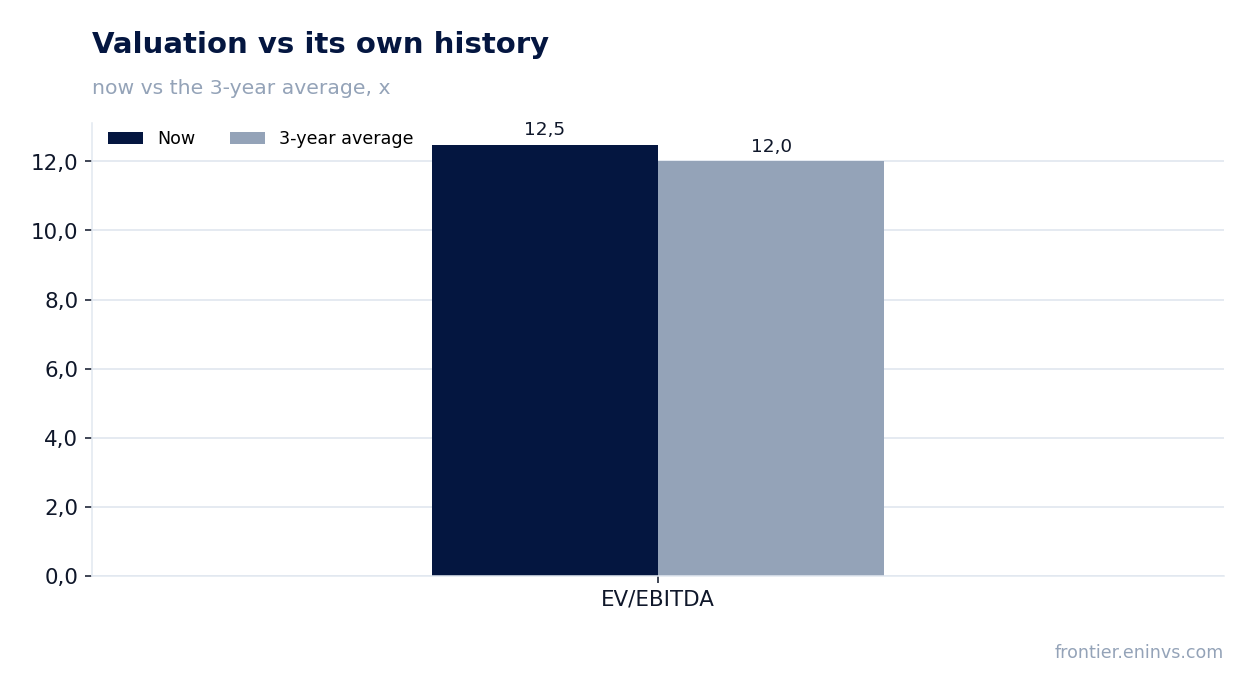
Debt load of 0.7 EBITDA LTM is comfortable, but the trend is not disclosed
Net debt at the latest reporting date was $581.9 million, and the ratio of net debt to EBITDA for the last 12 months was 0.7. This is a low level for an industrial company, providing a margin of safety. However, the facts do not include a previous value for this ratio, so it cannot be said that the load has fallen or risen.
In the third quarter net debt decreased by $3.9 million compared to the previous reporting period. Over 12 months the decline was about 0.2 billion rubles, but this is a ruble estimate that is not comparable with dollar reporting. In dollar terms, net debt at the end of the quarter was $531.8 million, down from $535.7 million a quarter earlier.
Interest expense fell to $6.1 million from $12.1 million a year earlier, due to partial debt repayment. The company repaid $400 million under a term loan and drew $200 million under a credit facility. The debt load is not a problem, but it also does not create a driver for growth.
Dividend yield of 0.24% offers no support, but the payout ratio remains low
Over the last 12 months the dividend yield was 0.24%. The company paid $0.20 per share in the third quarter of 2026, up 17.6% from a year earlier. At the current share price of $305.51 this gives a very low yield that does not attract income-oriented investors.
However, the payout ratio remains low: for nine months dividends were $0.57 per share against diluted earnings of $11.45. That is only about 5% of profit. The company prefers to direct money to share buybacks – $230 million over nine months, significantly more than the $17.7 million of dividend payments.
Our estimate for the dividend for the current year is about $0.80 per share, based on the current quarterly payment and a possible increase. This would give a yield of about 0.26% at the current price. The dividend is not a key factor for this stock, and is unlikely to become one in the near future.
Valuation at 12.5 EV/EBITDA LTM is slightly above its own three-year average of 12.0
On the EV/EBITDA multiple for the last 12 months the stock trades at 12.5, slightly above its own three-year average of 12.0. This means the market values the company a little more expensively than on average over the last three years. P/E LTM is 20.9, which also does not look cheap.
Our valuation model, based on EBITDA growth and a target multiple, gives upside to fair value of +29%. This is our own calculation, not a market consensus. It assumes the company can maintain the current level of profitability and continue buying back shares.
However, realising this potential requires sustainable revenue growth, which was virtually absent in the third quarter. If sales dynamics do not accelerate, the multiple may remain at the current level or decline.
Valuation on the latest reported figures
| Metric | Value |
|---|---|
| Market cap | 9.85 bn USD |
| P/E (LTM) | 20.9 |
| EV/EBITDA (LTM) | 12.5 |
| P/B | 3.61 |
| Net debt / EBITDA (LTM) | 0.70 |
| Operating cash flow (LTM) | 0.60 bn |
| ROE | 6.6% |
| Dividend yield (12m) | 0.2% |
| EV/EBITDA, 3-year average | 12.0 |
Bottom line
The strengths of the report are cash flow and low debt. Operating cash flow for nine months rose 30.4% to $520.2 million, and net debt is only 0.7 EBITDA. However, profit growth is largely due to one-off factors and a low base, while revenue is barely growing. At the current valuation of 12.5 EV/EBITDA, slightly above its own three-year average, the stock looks rather attractive, but sustainable sales growth is needed to confirm this. Verdict – rather attractive.
Open the company's financial profile AYI →
See also: market overview · valuation map · stock screeners