Charter Communications: revenue falls for a fourth straight quarter, but profit is propped up by debt extinguishment
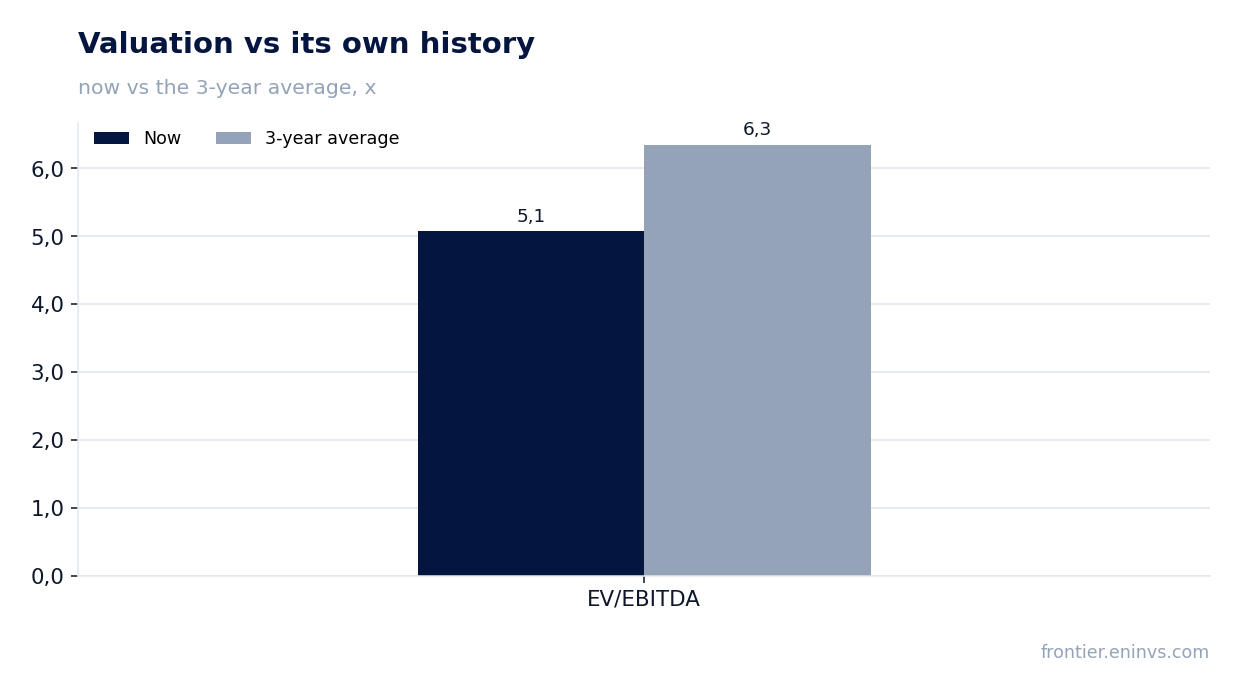
On 24 July Charter Communications reported second-quarter 2026 results. Revenue fell 1.7% year-on-year to $13,526 million, adjusted EBITDA declined 4.3% to $5,449 million, while net income slipped only 0.7% to $1,292 million thanks to a one-off gain on debt extinguishment. The stock trades at EV/EBITDA of 5.07 against its own three-year average of 6.35, a discount of about 20%, but negative revenue and EBITDA dynamics and the absence of a dividend make the shares rather unattractive at current levels.
Key takeaways
— Revenue falls for a fourth consecutive quarter, and the decline accelerated to 1.7%
— Adjusted EBITDA falls faster than revenue, margin compresses
— Net income held up thanks to a one-off gain on debt extinguishment
— Operating cash flow rose 9%, but free cash flow declined
— Leverage at 4.33x EBITDA is a level, not a trend
— The discount to the historical multiple does not justify the price amid falling EBITDA
— No dividends are paid, a deliberate choice in favour of share buybacks
Attractiveness
Key figures, USD bn
| Metric | Q2 2025 | Q2 2026 | Change |
|---|---|---|---|
| Revenue | 13.8 | 13.5 | -1.7% |
| EBITDA | 5.46 | 5.26 | -3.6% |
| Operating profit | 3.28 | 3.06 | -6.6% |
| Net profit | 1.30 | 1.29 | -0.7% |
| Operating cash flow | 3.60 | 3.92 | +9.0% |
| Capex | 2.87 | 2.87 | -0.1% |
| EBITDA margin | 39.6% | 38.9% | -0.7 pp |
| Net margin | 9.5% | 9.6% | +0.1 pp |
Revenue falls for a fourth consecutive quarter, and the decline accelerated to 1.7%
In the second quarter of 2026, Charter's revenue amounted to $13,526 million, down 1.7% year-on-year. This is the fourth consecutive quarterly decline: in Q3 2025 the drop was 0.9%, in Q1 2026 – 1.0%, now – 1.7%. The deceleration relative to the first quarter is evident: the rate worsened by 0.7 percentage points.
The main source of weakness is video services. Video revenue fell 9.7% to $3,149 million due to a shift of subscribers to cheaper packages and higher costs for programmers' streaming applications, which are netted against revenue. Internet revenue declined 3.2% to $5,776 million, reflecting a 172,000 contraction in the subscriber base and pricing mix. These two segments together generate almost $9 billion, and their combined decline outweighs growth in mobile and advertising.
Support came from mobile and advertising. Mobile service revenue grew 18.9% to $1,095 million thanks to a 406,000 increase in lines during the quarter. Advertising revenue added 12.3% to $416 million, but this growth is almost entirely driven by political advertising: excluding political spend, advertising fell 4.6%.
Thus, organic growth remains negative. Even excluding one-off effects from streaming apps and political advertising, revenue declined 0.8% year-on-year. The company has not yet reversed the trend of subscriber attrition in broadband, which limits growth prospects.
Adjusted EBITDA falls faster than revenue, margin compresses
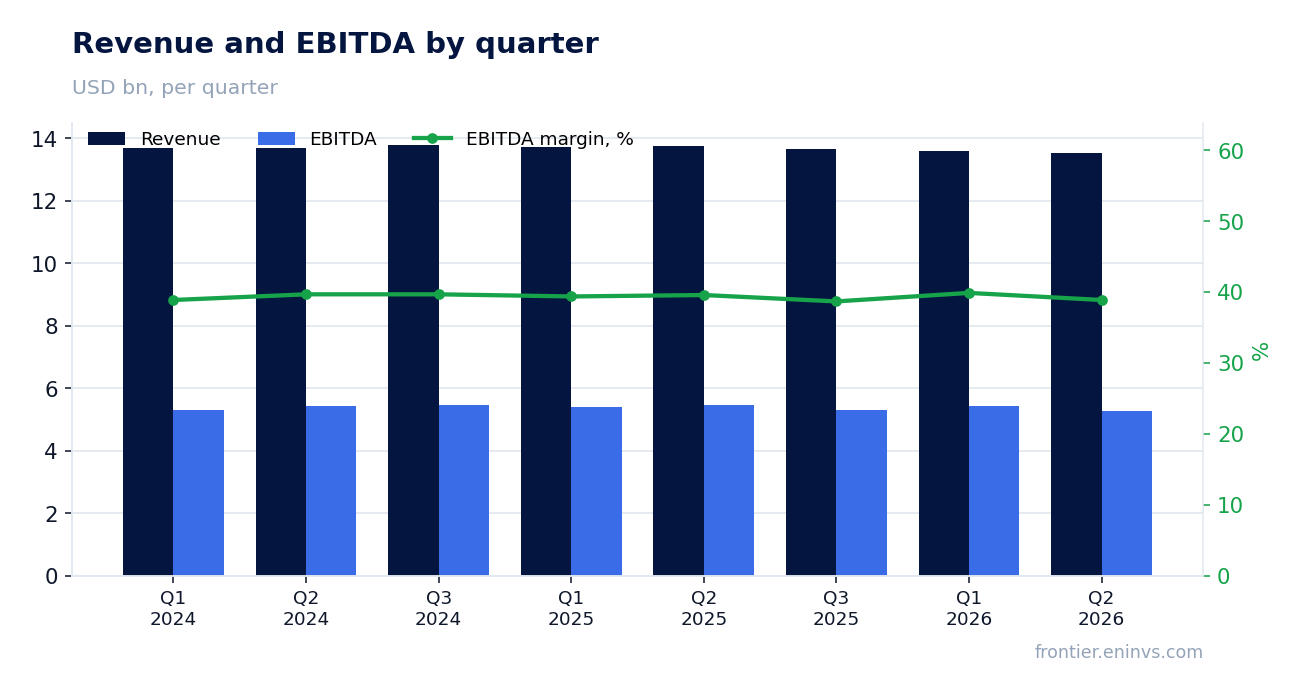
Adjusted EBITDA in Q2 2026 was $5,449 million, down 4.3% year-on-year. The decline in EBITDA is more than double the rate of revenue decline, indicating negative operating leverage. EBITDA margin compressed to 40.3% from 41.4% a year earlier.
The main reason is rising operating costs. Total operating expenses remained flat at $8,077 million, but unfavourable shifts occurred within the structure. Programming costs fell 9.7% to $2,035 million due to netting of streaming app costs, but other items grew. Other costs of revenue increased 11.3% to $1,837 million due to higher mobile device sales and direct mobile costs. Field and technology operations added 1.6%, customer operations – 1.1%.
The company also incurred $65 million in transition expenses related to preparing for the Cox integration. Excluding these, EBITDA would have declined 3.2% instead of 4.3%. Nevertheless, even the adjusted figure falls faster than revenue, indicating pressure on profitability.
Margin compression is a warning signal. With falling revenue, the company cannot cut costs proportionally, as a significant portion is fixed or growing faster than inflation. This limits the ability to generate cash flow and service debt.
Net income held up thanks to a one-off gain on debt extinguishment
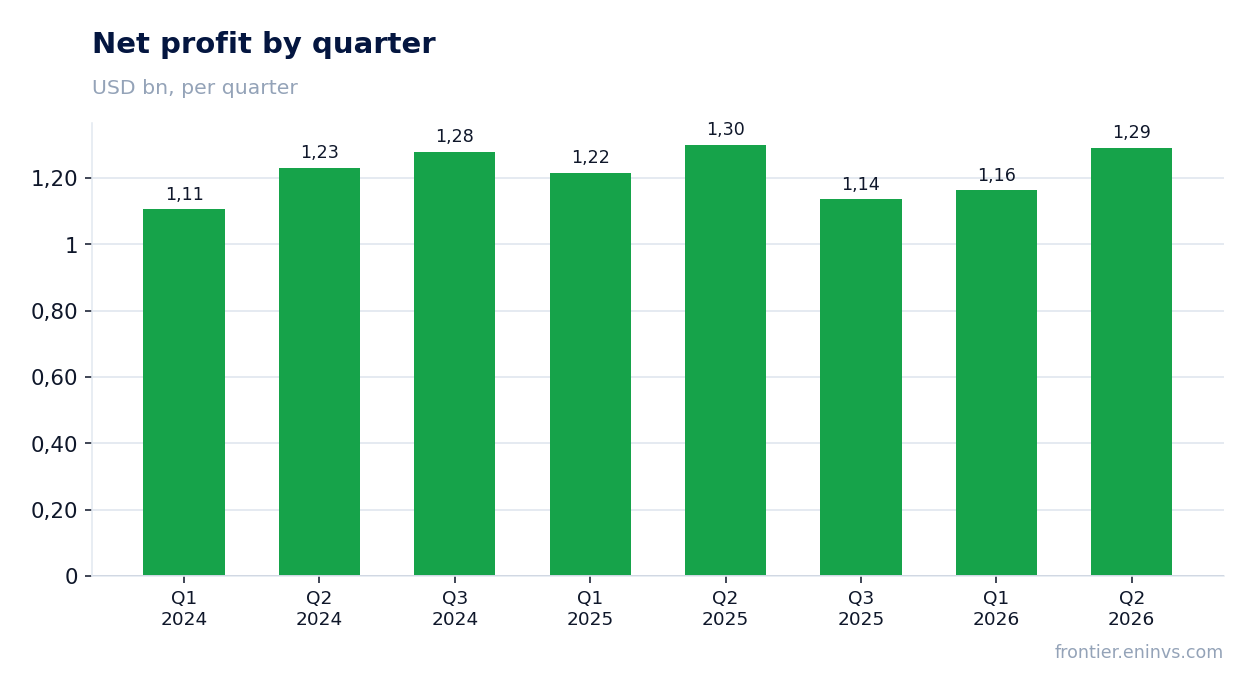
Net income attributable to Charter shareholders in Q2 2026 was $1,292 million, down only 0.7% year-on-year. This contrasts sharply with the 4.3% decline in EBITDA. The difference is explained by a one-off gain on debt extinguishment: other income includes a gain on retirement of debt, which in this case was positive.
The report states that the decline in EBITDA was offset by a gain on extinguishment of debt related to open market debt repurchases. During the quarter, the company repurchased $1.2 billion in aggregate principal amount of notes for $1.0 billion in cash. This operation generated an accounting gain that boosted net income but is not a sustainable source of income.
Without this one-off gain, net income would have shown significantly weaker dynamics. Investors should note that the current profit level does not reflect operating results. In the next quarter, a similar effect may be absent, and profit will come under pressure.
Net profit margin was 9.6% versus 9.5% a year earlier, but this increase is also due to the one-off factor. Operating profit fell 6.6% to $3,063 million, which better reflects the true state of the business.
Operating cash flow rose 9%, but free cash flow declined
Operating cash flow in Q2 2026 was $3,925 million, up 9.0% year-on-year. The increase was mainly driven by lower cash taxes, not by improved operating results. This is an important distinction: the sustainability of cash flow is questionable, as it grows against a backdrop of falling EBITDA.
Capital expenditures remained virtually flat at $2,871 million. The company confirmed its 2026 guidance of approximately $11.4 billion, excluding the impact of the Cox transaction. The main areas are network evolution and rural expansion. Within capex, upgrade/rebuild spending increased ($657 million vs. $457 million a year earlier), while line extension spending declined.
Free cash flow fell 7.4% to $969 million. The decline was due to an unfavourable change in accrued expenses related to capital expenditures, which partly offset higher operating cash flow. This means that even with higher operating cash flow, the company generates less free cash.
The decline in free cash flow amid high capital expenditures limits the company's ability to reduce debt and buy back shares. Against falling EBITDA, this creates additional pressure on financial flexibility.
Leverage at 4.33x EBITDA is a level, not a trend
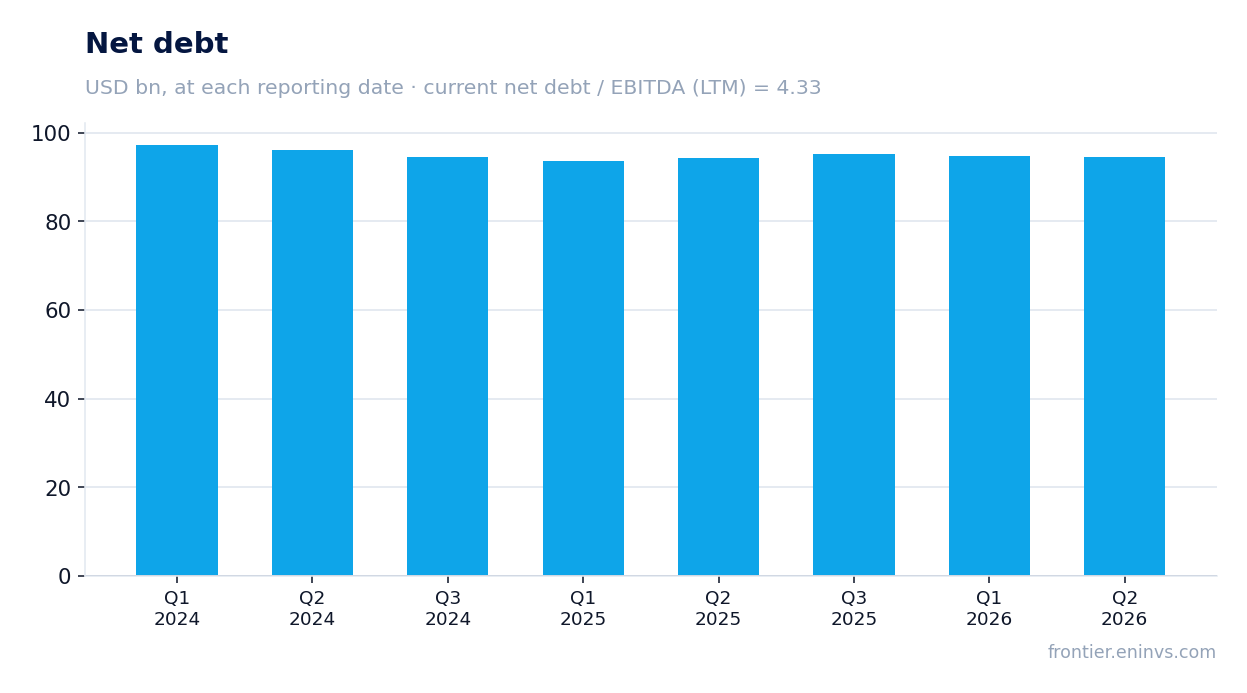
Charter's net debt as of 30 June 2026 was $94,605 million. The ratio of net debt to LTM EBITDA is 4.33. This is a level the company maintains; the facts do not provide the previous value of this ratio, so it cannot be stated that leverage rose or fell.
During the quarter, net debt remained virtually unchanged: from $94,709 million on 31 March 2026 to $94,605 million on 30 June 2026, a decrease of $0.1 billion. Over 12 months, debt increased by $0.2 billion: from $94,371 million on 30 June 2025 to $94,605 million on 30 June 2026. This is a very moderate increase that does not create an immediate threat but does not improve the situation either.
Total principal debt is $93.8 billion, while the company has access to credit facilities providing approximately $3.7 billion of additional liquidity above its $509 million cash position. Liquidity is adequate but not excessive. Interest expense for the quarter was $1,276 million, comparable to the prior year.
With LTM EBITDA of $21,826 million and a market capitalisation of $14,043 million, EV/EBITDA is 5.07. This is below the three-year average of 6.35. However, leverage remains high, and if EBITDA falls, the ratio could rise even if absolute debt does not increase.
The discount to the historical multiple does not justify the price amid falling EBITDA
Charter's EV/EBITDA currently stands at 5.07. The three-year average of this multiple is 6.35. Thus, the stock trades at a discount of about 20% to its own history. This may seem attractive, but context is needed.
The discount is explained by deteriorating fundamentals. Revenue has been falling for four consecutive quarters, EBITDA is declining faster than revenue, and margin is compressing. The market is pricing in further deterioration, and the current multiple may not be so low if profit continues to fall.
Our own valuation model used by the portal shows that the fair value of the share is 16% below the current market price. The model takes into account EBITDA growth and a target multiple. This is not a consensus forecast or a target price, but the result of our internal methodology.
The LTM P/E is 2.85, reflecting one-off gains in profit. Excluding these gains, the multiple would be significantly higher. ROE is 31.0%, but it is also distorted by one-off factors and share buybacks that reduce equity.
Thus, the discount to the historical multiple is not a sufficient argument for buying. A reversal in revenue and EBITDA dynamics is needed, and it is not yet visible.
No dividends are paid, a deliberate choice in favour of share buybacks
Charter Communications does not pay dividends. The facts show no dividend payments over the last 12 months, and the company did not announce any dividends in its Q2 2026 report. This is consistent with its long-term policy: free cash is directed to share buybacks and debt reduction.
Instead of dividends, the company actively repurchases shares. In Q2 2026, it bought back 4.0 million Class A shares for $838 million. For the half-year, buybacks totalled $1,878 million. This is a substantial amount that supports earnings per share: basic EPS rose to $10.76 from $9.41 a year earlier, partly due to a 13.1% reduction in shares outstanding.
The absence of dividends means investors receive no current income. For income-oriented investors, this makes the stock unattractive. However, for growth-oriented investors, buybacks can be a more efficient way to return capital, especially at a low valuation.
Nevertheless, with falling EBITDA and high debt, the company's ability to continue buybacks at previous levels may decline. In the current quarter, free cash flow was $969 million, while $838 million and $1.0 billion were spent on share and bond repurchases, respectively. This means the company is partly funding buybacks through debt or other sources.
For investors seeking dividend income, Charter is not suitable. For those willing to tolerate no dividends for potential capital growth, the key question remains the company's ability to reverse negative operating trends.
Valuation on the latest reported figures
| Metric | Value |
|---|---|
| Market cap | 14.0 bn USD |
| P/E (LTM) | 2.9 |
| EV/EBITDA (LTM) | 5.1 |
| P/B | 0.87 |
| Net debt / EBITDA (LTM) | 4.33 |
| Operating cash flow (LTM) | 16.5 bn |
| ROE | 31.0% |
| EV/EBITDA, 3-year average | 6.3 |
Bottom line
Charter's Q2 2026 report confirms a troubling trend: revenue has fallen for four consecutive quarters, with the decline accelerating to 1.7%. Adjusted EBITDA is falling faster than revenue, and margin is compressing. Net income held up only thanks to a one-off gain on debt extinguishment, which is not a sustainable source. The discount to the historical EV/EBITDA multiple (5.07 vs. average 6.35) does not compensate for the fundamental weakness of the business. Our valuation model shows that the fair value of the share is 16% below the current price. No dividends are paid, and share buybacks are partly funded by debt. All this makes the stock rather unattractive for investors at current levels.
Open the company's financial profile CHTR →
See also: market overview · valuation map · stock screeners