COSTCO WHOLESALE CORP /NEW: revenue up 11.1%, but a quarter of quarterly profit came from a one-off tariff refund
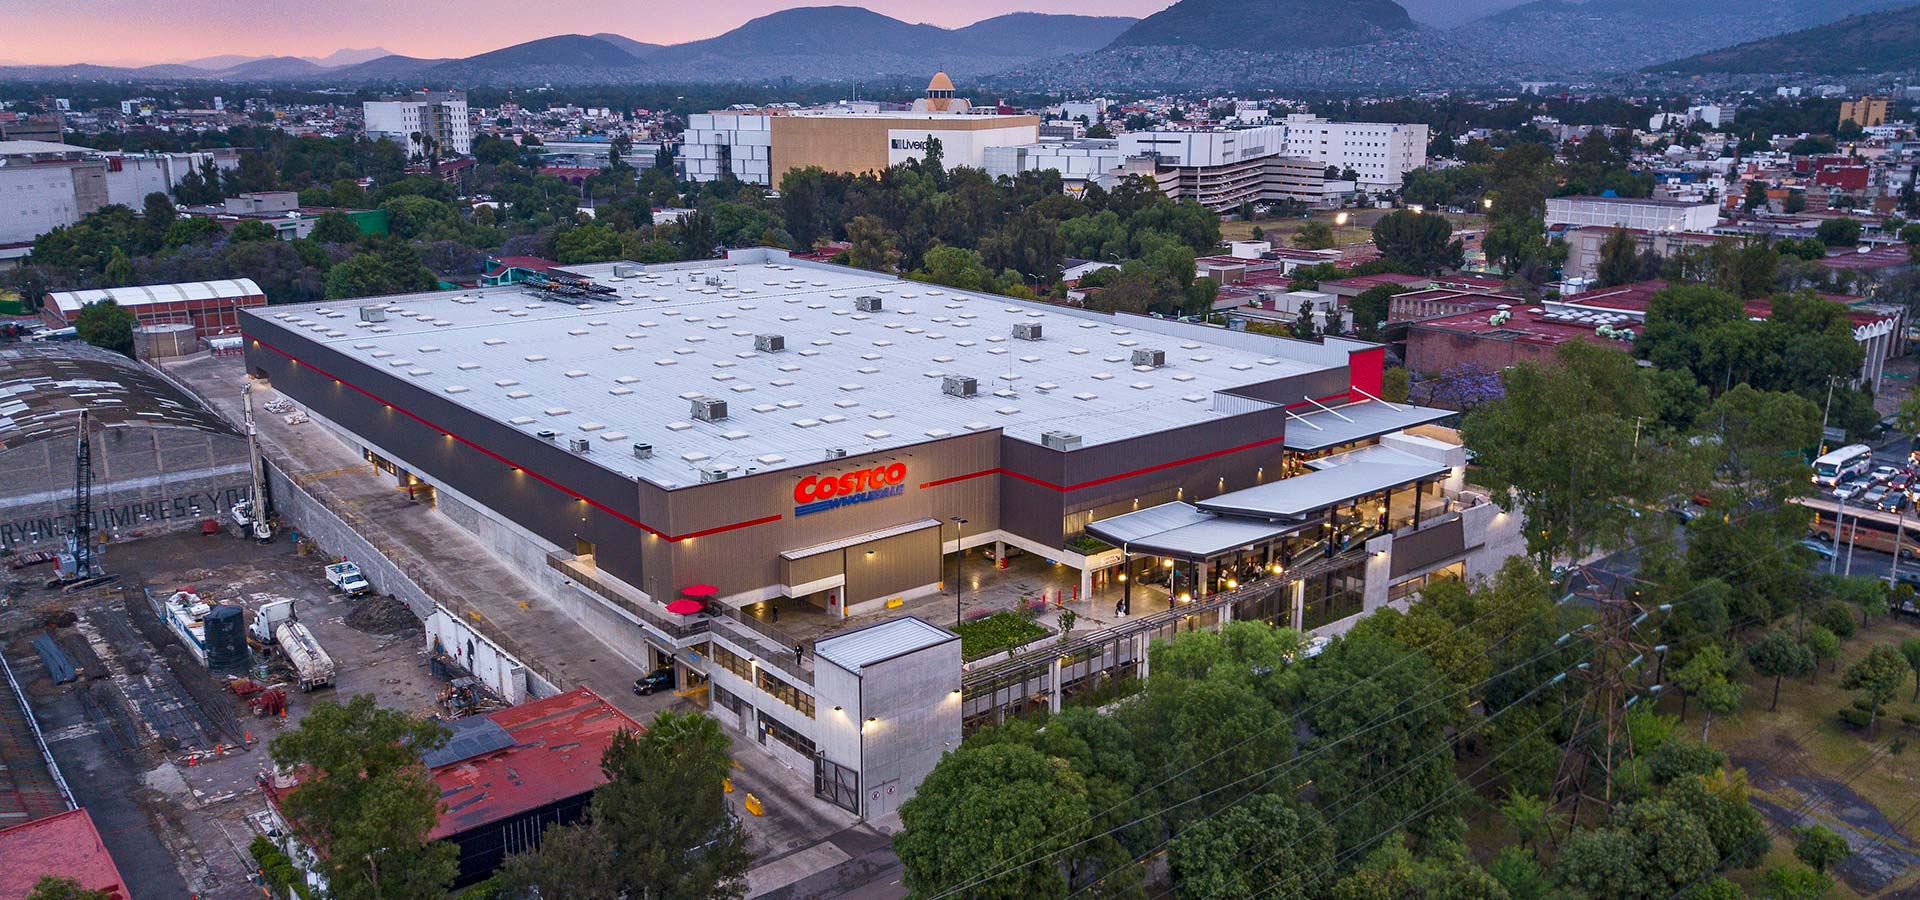
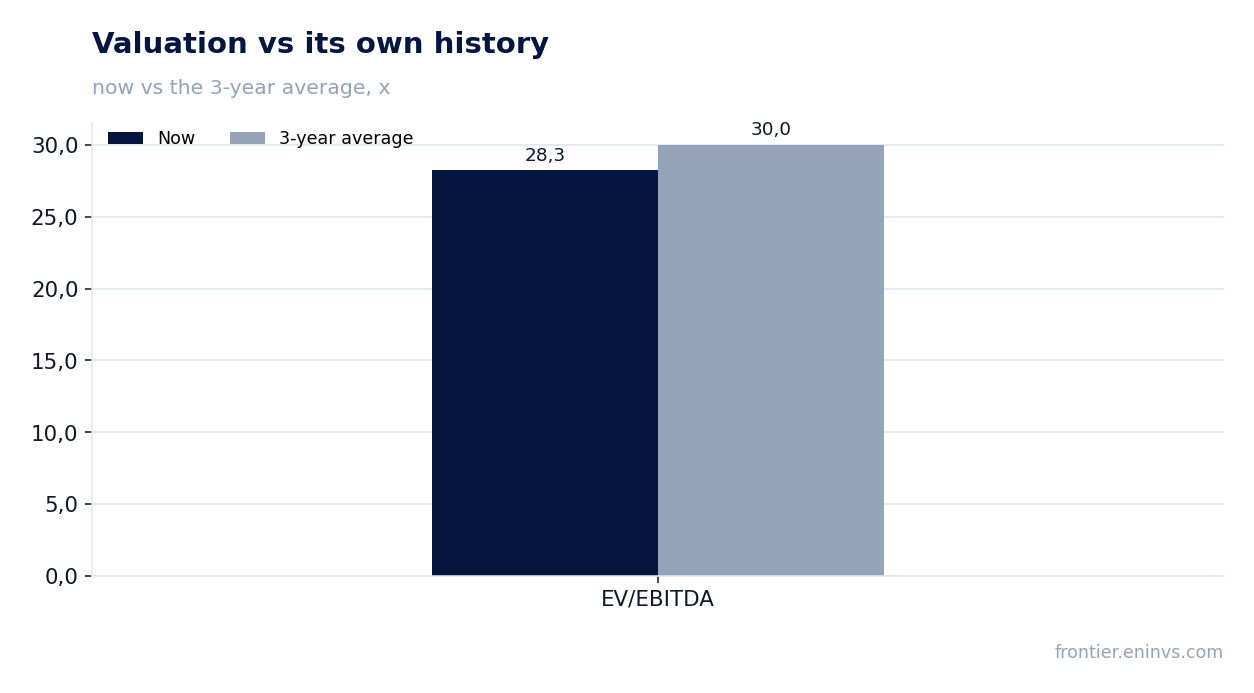
On 24 September COSTCO WHOLESALE CORP /NEW reported results for the fourth quarter of fiscal 2026. Revenue came in at 95,723 million dollars, operating profit at 3,801 million, net profit at 2,998 million. Year on year revenue rose 11.1% and net profit 24.6%, with the net margin improving to 3.1% from 2.8%. However, the quarter's profit includes a one-off IEEPA tariff refund worth 0.15 dollars per diluted share – without it growth would have been noticeably more modest. With EV/EBITDA at 28.3 against its own three-year average of 30.0 and the portal's model showing only +2% upside to fair value, the share looks neutral: a strong operating report is already priced in.
Key takeaways
— Revenue rose 11.1% year on year, but the pace was roughly the same as the 11.6% a quarter earlier
— The net margin improved to 3.1% from 2.8% a year earlier, and part of that gain is one-off
— The IEEPA tariff refund added 0.15 dollars per share, about a quarter of quarterly profit
— Comparable sales excluding fuel and FX rose 6.7%, while reported comparable sales rose 9.4%
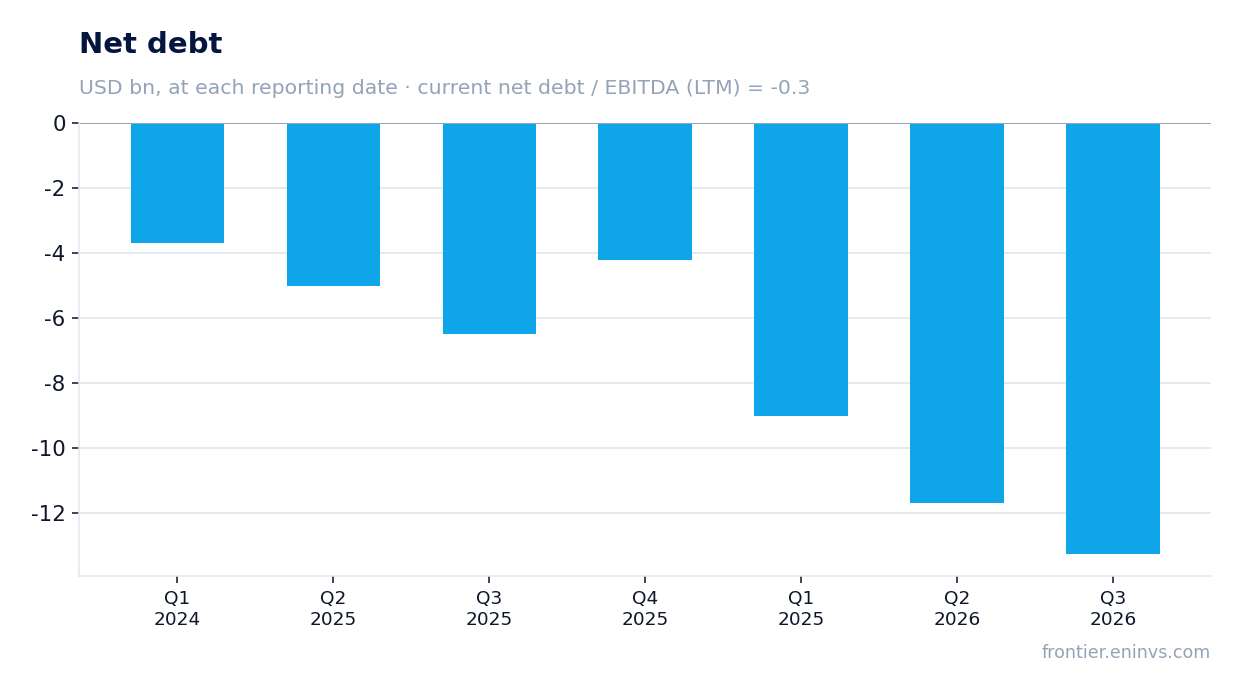
— Net debt is negative at 4,226 million dollars, with net debt / EBITDA LTM at minus 0.3
— Dividend yield of 0.62% on 2,458 million dollars of payments for the year – low for its history and low against the key rate
— EV/EBITDA of 28.3 against its own three-year average of 30.0, while the portal's model shows only +2% upside to fair value
Attractiveness
Key figures, USD bn
| Metric | Q4 2025 | Q4 2026 | Change |
|---|---|---|---|
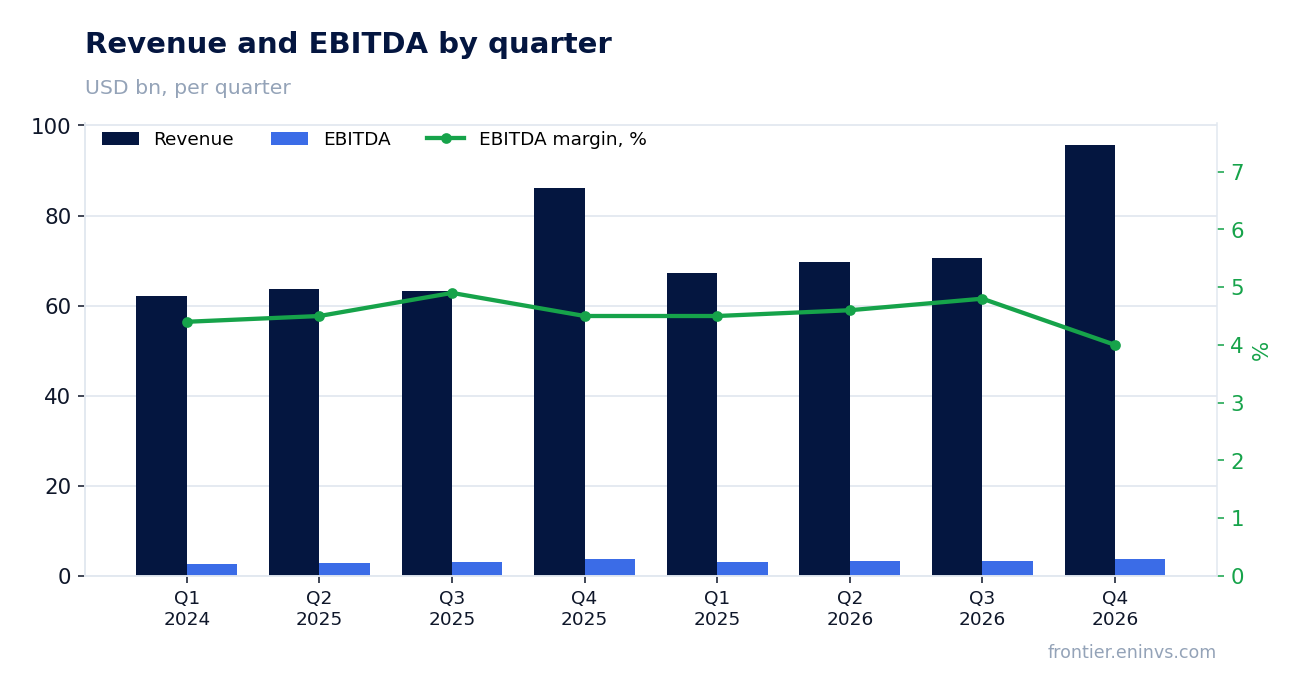
| Revenue | 86.2 | 95.7 | +11.1% |
| EBITDA | 4.12 | — | — |
| Operating profit | 3.07 | 3.80 | +23.6% |
| Net profit | 2.41 | 3.00 | +24.6% |
| Operating cash flow | 3.87 | — | — |
| Capex | 1.97 | — | — |
| EBITDA margin | 4.8% | — | — |
| Net margin | 2.8% | 3.1% | +0.3 pp |
Revenue rose 11.1% year on year, but the pace was roughly the same as the 11.6% a quarter earlier
Revenue for the fourth quarter of fiscal 2026 came to 95,723 million dollars, up 11.1% year on year. In the previous quarter growth was 11.6% – the pace was roughly the same. That is a consistently high level for a retailer, but without acceleration.
The main contribution came from net sales of 93,873 million dollars, up 11.2%. Membership fees rose 7.3% to 1,850 million. Total company comparable sales rose 9.4%, but excluding fuel and FX they rose only 6.7%. The 2.7 percentage point gap shows that a noticeable part of growth is more expensive fuel and a weaker dollar, not higher physical traffic.
Digital sales rose 19.5% – the fastest segment, but still small relative to total revenue. The chain operates 939 warehouses, with almost no openings during the quarter, so growth came mainly from existing locations.
The net margin improved to 3.1% from 2.8% a year earlier, and part of that gain is one-off
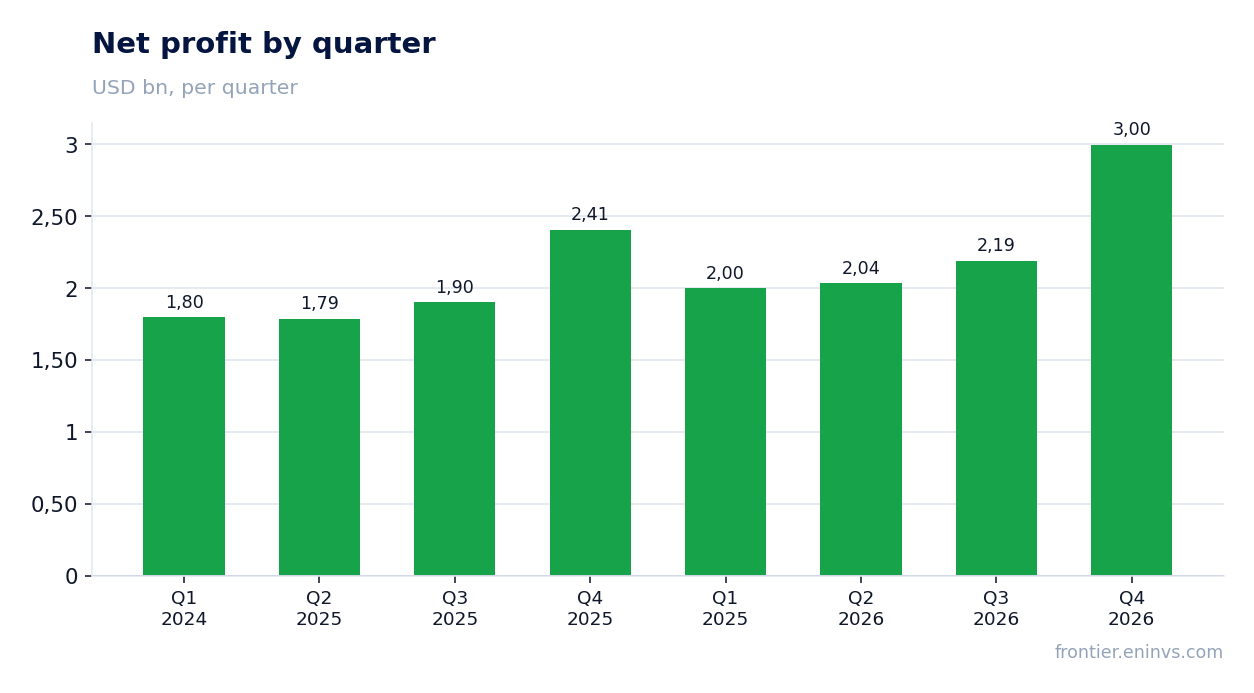
Net profit for the quarter was 2,998 million dollars, with a net margin of 3.1% against 2.8% a year earlier. Operating profit rose to 3,801 million from 3,341 million, or 13.8%. The operating margin improved to 4.0% from 3.9%.
However, profit includes a one-off: the IEEPA tariff refund added 0.15 dollars per diluted share, which at 444.4 million shares is about 67 million dollars. That is roughly a quarter of quarterly profit. Without it, net profit would have grown by 22%, not 24.6%.
The company notes that part of the refund was reinvested in increased member value – that is, in lower prices or better offerings. That makes sense for long-term loyalty, but means the effect on next quarter's profit will be smaller.
The IEEPA tariff refund added 0.15 dollars per share, about a quarter of quarterly profit
The one-off IEEPA tariff refund is the key detail of the report. It added 0.15 dollars per diluted share, while total earnings per share were 6.75 dollars. Without this one-off, EPS would have been about 6.60 dollars.
The company explicitly states that the refund was partly reinvested in increased member value. This means part of the benefit has already been spent and will not repeat. For an investor, the important point is that 24.6% year-on-year profit growth is a figure that will not automatically recur next quarter.
It is worth remembering that tariffs are an external factor, and their refund is not related to operating efficiency. Therefore, the sustainability of profit should be judged by the operating margin, which rose only 0.1 percentage point, to 4.0%.
Comparable sales excluding fuel and FX rose 6.7%, while reported comparable sales rose 9.4%
Reported comparable sales rose 9.4%, but excluding changes in fuel prices and foreign exchange they rose only 6.7%. The 2.7 percentage point gap is the contribution of fuel and FX, which do not reflect consumer demand for Costco goods.
By region: in the U.S. comparable sales rose 10.7% reported and 7.2% adjusted, in Canada – 5.0% and 4.6%, in other international markets – 7.0% and 6.2%. The U.S. market remains the main driver, but even there adjusted growth is more modest than reported.
Digital sales rose 19.5% reported and 19.8% adjusted – the only segment where adjustments barely change the picture. However, its share of revenue is not disclosed, and it cannot yet move the overall result.
Net debt is negative at 4,226 million dollars, with net debt / EBITDA LTM at minus 0.3
Net debt at the latest reporting date is minus 4,226 million dollars, meaning cash exceeds debt. The ratio of net debt to EBITDA for the trailing twelve months is minus 0.3. This is a level, not a direction: it cannot be compared with a previous value, but the fact of negative net debt itself speaks to financial stability.
Cash and equivalents on the balance sheet are 20,207 million dollars, short-term investments 1,094 million. Long-term debt is 3,914 million, current portion 2,248 million. The company is not burdened by debt and has a significant liquidity cushion.
Operating cash flow for the year was 15,825 million dollars, capital expenditures 6,435 million. Free cash flow is therefore about 9,390 million – more than enough to cover dividends and buybacks.
Dividend yield of 0.62% on 2,458 million dollars of payments for the year – low for its history and low against the key rate
Over the trailing twelve months the company paid 2,458 million dollars in dividends. With a market capitalisation of 398,024 million dollars, the dividend yield is 0.62%. That is a very low level – both for the company historically and relative to current rates.
Our estimate of the dividend for fiscal 2026, based on payments over the trailing twelve months and profit for the same period, is about 5.54 dollars per share. It rests on the payout ratio the company maintains and on trailing twelve-month profit of 9,260 million dollars. If the one-off tariff refund does not repeat, next year's profit could be lower, limiting dividend growth.
A yield of 0.62% does not even cover current inflation and is significantly below the key rate. For an income-oriented investor, this stock is not suitable. The main return on capital here has historically come through capital appreciation, not dividends.
EV/EBITDA of 28.3 against its own three-year average of 30.0, while the portal's model shows only +2% upside to fair value
The EV/EBITDA multiple for the trailing twelve months is 28.3. That is below its own three-year average of 30.0, meaning the stock trades at a small discount to its history. However, the discount is small – about 6%.
The P/E multiple for the trailing twelve months is 43.0. That is a high level, reflecting market expectations for future growth. At the same time, the portal's model, based on EBITDA growth and a target multiple, shows only +2% upside to fair value. This means the current price already reflects a significant part of future growth.
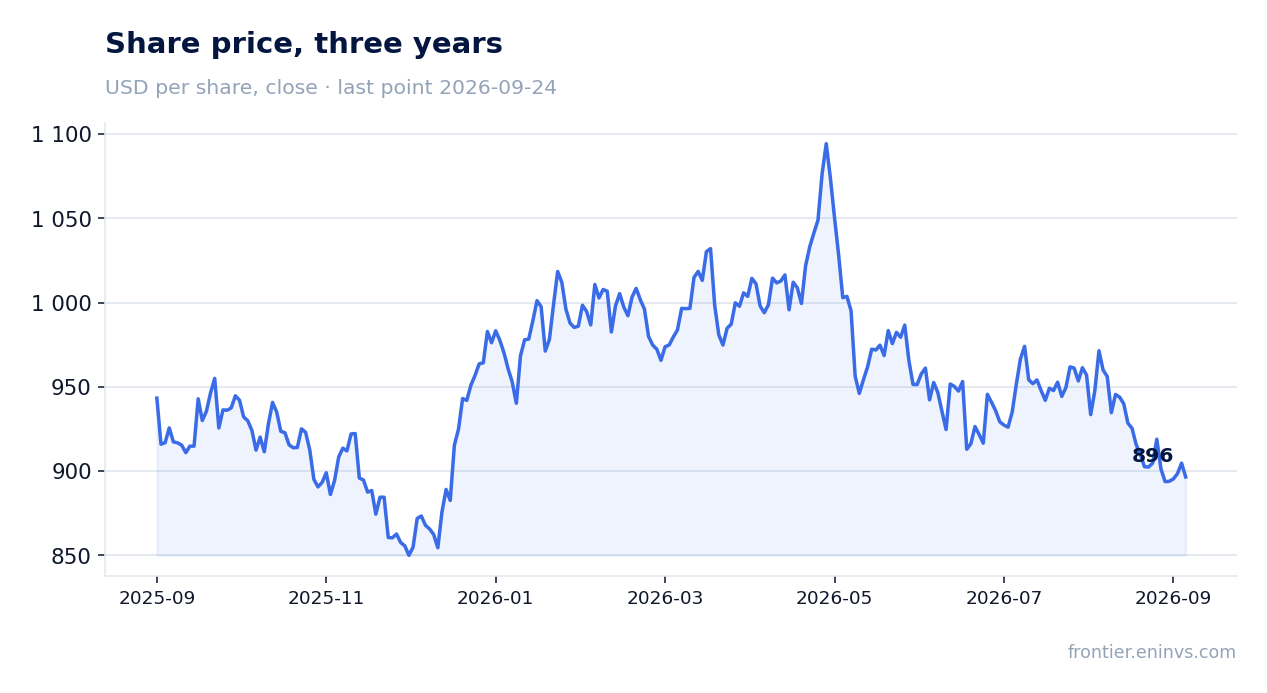
On the day after the report the share lost 0.9%, and from the report date to 24 September 2026 – also 0.9%. The market saw no reason for a re-rating in the report. With a neutral portal valuation and low dividend yield, upside is limited.
Valuation on the latest reported figures
| Metric | Value |
|---|---|
| Market cap | 398 bn USD |
| P/E (LTM) | 43.0 |
| EV/EBITDA (LTM) | 28.3 |
| P/B | 13.65 |
| Net debt / EBITDA (LTM) | -0.30 |
| ROE | 8.9% |
| Dividend yield (12m) | 0.6% |
| EV/EBITDA, 3-year average | 30.0 |
Bottom line
COSTCO WHOLESALE CORP /NEW's fourth-quarter fiscal 2026 report showed strong revenue and profit growth, but a significant part of that growth is the one-off IEEPA tariff refund, which added 0.15 dollars per share. The operating margin rose only 0.1 percentage point, while comparable sales excluding fuel and FX rose just 6.7% against reported 9.4%. The company is financially sound: net debt is negative, free cash flow is about 9.4 billion dollars. However, EV/EBITDA of 28.3 is close to its own three-year average of 30.0, the portal's model shows only +2% upside to fair value, and the dividend yield of 0.62% is unattractive. Verdict – neutral: the share is fairly valued, and a re-rating requires sustainable growth without one-off factors.
Open the company's financial profile COST →
See also: market overview · valuation map · stock screeners