Comstock Resources: Revenue Fell a Quarter but Production Growth and a One-Off Deal Kept Profit Positive

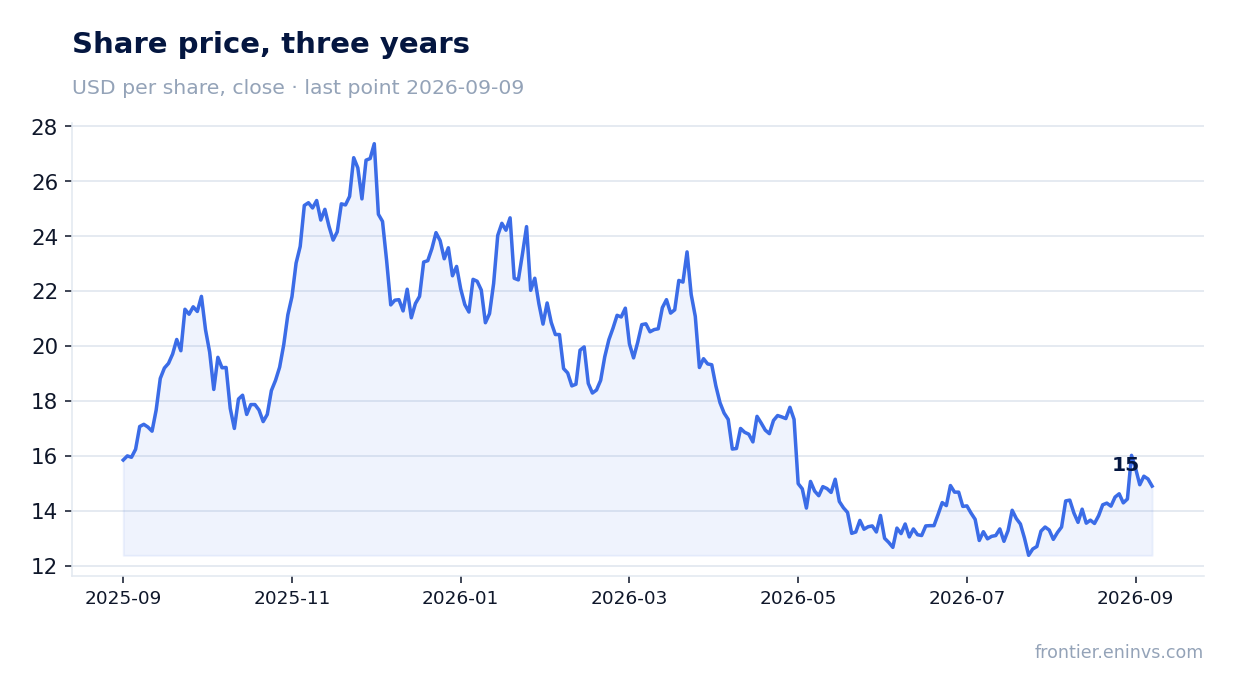
On July 29, Comstock Resources, Inc. released its second-quarter 2026 results. Revenue fell 24.9% year-on-year to $353.3 million, adjusted EBITDAX declined to $245 million, and net income available to the company was $8.8 million versus $124.8 million a year earlier. Support came from a 16% sequential production increase and the sale of a 27% stake in Pinnacle for $600 million, used to repay debt. At the current price, the stock trades at 5.99 EV/EBITDA LTM, below its own three-year average of 6.89, while the portal's model points to 63% downside to fair value. Given the revenue decline and margin pressure, the stock looks rather unattractive.
Key takeaways
— Revenue fell 24.9% due to lower gas prices and reduced gas services income
— Production rose 16% sequentially but added only 1% year-on-year
— Profit stayed positive thanks to a one-off gain from the Pinnacle stake sale
— Leverage at 2.38 EBITDA LTM remains moderate, but capital expenditures are rising
— The portal's model points to 63% downside to fair value
Attractiveness
Key figures, USD bn
| Metric | Q2 2025 | Q2 2026 | Change |
|---|---|---|---|
| Revenue | 0.47 | 0.35 | -24.9% |
| EBITDA | 0.25 | 0.19 | -23.3% |
| Operating profit | 0.09 | 0.02 | -74.8% |
| Net profit | 0.12 | 0.01 | -93.0% |
| Operating cash flow | 0.35 | 0.17 | -51.0% |
| Capex | 0.34 | 0.43 | +25.4% |
| EBITDA margin | 52.7% | 53.8% | +1.1 pp |
| Net margin | 26.5% | 2.5% | -24.0 pp |
Revenue fell 24.9% due to lower gas prices and reduced gas services income
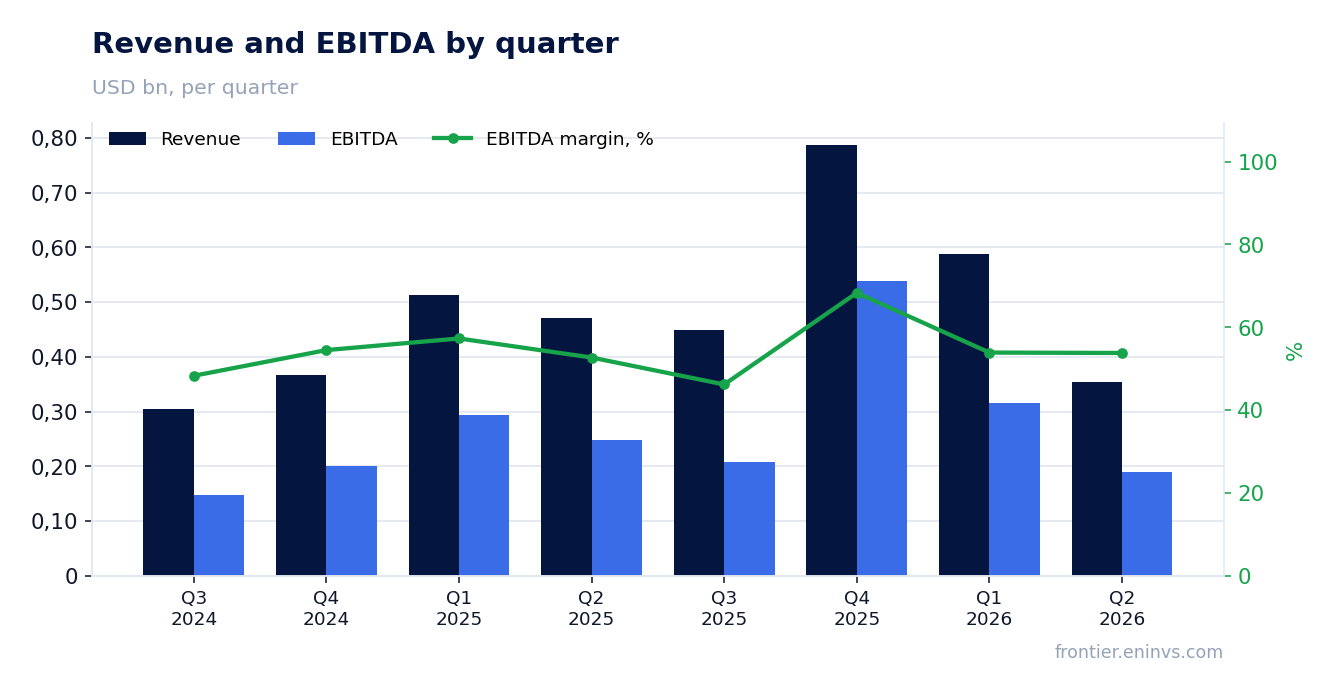
Revenue in the second quarter of 2026 was $353.3 million, down 24.9% year-on-year. The main contributor to the decline was a drop in gas services revenue to $63.5 million from $130.3 million in Q2 2025. Natural gas sales also fell to $287.7 million from $339.2 million, driven by both a lower average realized price ($2.54 per Mcf versus $3.02) and little change in production volumes.
Production in the quarter was 113.1 Bcfe, up 16% from Q1 2026 but only 1% above Q2 2025. The sequential increase reflects new wells turned to sales, including five Western Haynesville wells with average initial production of 33 MMcf per day. However, year-on-year production was nearly flat, so the revenue decline was entirely due to pricing and the contraction in the services segment.
The average realized price including hedging was $2.93 per Mcfe versus $3.07 a year earlier. Hedges contributed $43.3 million in realized gains, partially offsetting the drop in unhedged prices. Nevertheless, total natural gas and oil sales including hedging fell to $331.6 million from $344.3 million a year earlier.
Production rose 16% sequentially but added only 1% year-on-year
Production in Q2 2026 was 113.1 Bcfe, up 16% from Q1 but only 1% above Q2 2025. The gap is explained by unusually low production in Q1 2026 due to weather and maintenance, while Q2 returned to normal operating levels.
The company turned 16 (12.7 net) operated wells to sales in the quarter, including five Western Haynesville wells with an average lateral length of 9,679 feet and initial production of 33 MMcf per day. Twelve Legacy Haynesville wells were also turned to sales with an average lateral length of 11,835 feet and initial production of 31 MMcf per day; five of these were horseshoe wells.
Despite the sequential increase, year-on-year production growth remains weak: for the first half of 2026, output fell 7% compared to the same period in 2025. This means that to return to year-on-year growth, the company will need not only to maintain current drilling rates but also to compensate for the first-half shortfall.
Profit stayed positive thanks to a one-off gain from the Pinnacle stake sale
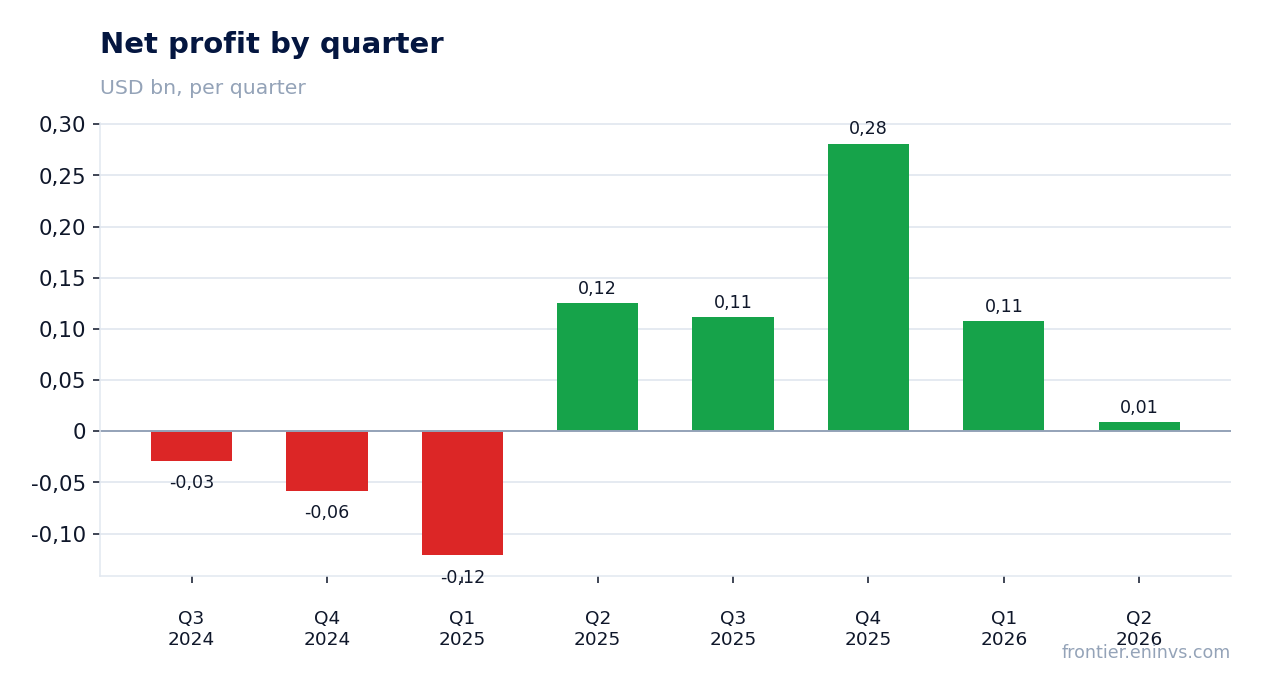
Net income available to the company in Q2 2026 was $8.8 million, or $0.03 per share, versus $124.8 million ($0.44 per share) a year earlier. The sharp decline was due to operating income falling to $22.6 million from $89.4 million, as well as lower other income. However, the company remained profitable, helped by a one-off gain from the sale of a 27% stake in Pinnacle Gas Services for $600 million, used to repay debt.
Adjusted EBITDAX was $244.8 million, down 5.8% from $259.7 million in Q2 2025. The EBITDAX margin fell to 53.8% from 52.7% a year earlier, reflecting a faster decline in revenue than in costs. The unhedged operating margin was 70%, and the hedged margin was 74%.
The reported profit also included a $1.0 million unrealized loss on hedging, which was excluded from adjusted profit. Excluding one-off items, adjusted net income was $8.3 million, or $0.03 per share. Thus, the company's sustainable profitability remains under pressure from low gas prices.
Leverage at 2.38 EBITDA LTM remains moderate, but capital expenditures are rising
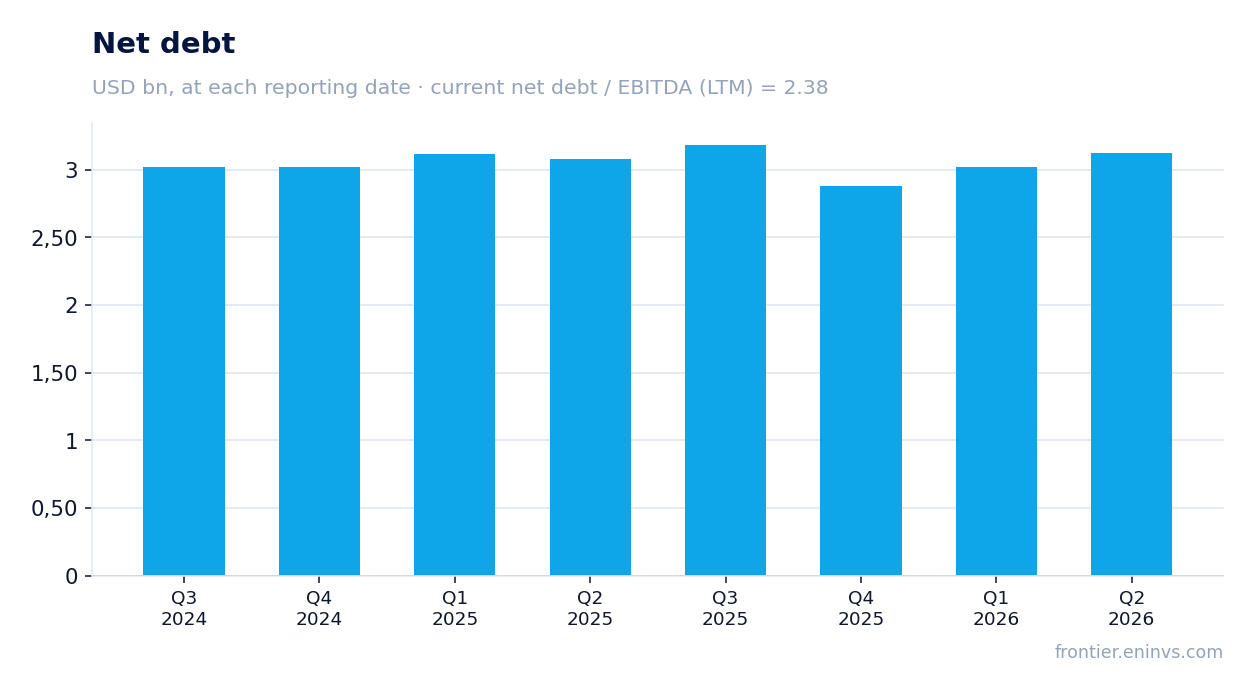
Net debt at the end of Q2 2026 was $3,124.9 million, up 0.1 billion rubles from the previous reporting date and virtually unchanged over the last 12 months. The net debt to EBITDA LTM ratio is 2.38 – a moderate level for the industry. However, the company does not disclose the trend of this ratio, so it cannot be said that leverage has decreased or increased.
Operating cash flow for the quarter was $170.2 million, and before changes in working capital it was $188.5 million. This is sufficient to cover interest expense ($55.0 million) but not enough to fund capital expenditures, which reached $431.9 million. The gap is covered by asset sales and debt issuance.
Capital expenditures rose to $431.9 million from $344.3 million a year earlier, driven by increased drilling activity. The company drilled 17 (15.6 net) wells in Q2, and total exploration and development capex for the half-year was $733.7 million. This level of investment requires stable funding, and if low gas prices persist, leverage could increase.
The portal's model points to 63% downside to fair value
According to the portal's model, the fair value of Comstock Resources shares, calculated by re-pricing EBITDA at current commodity prices and a target EV/EBITDA, implies 63% downside from the current market price. This is the portal's own estimate, not a market consensus or a target price. The model uses current gas prices and a target multiple that may differ from the actual one.
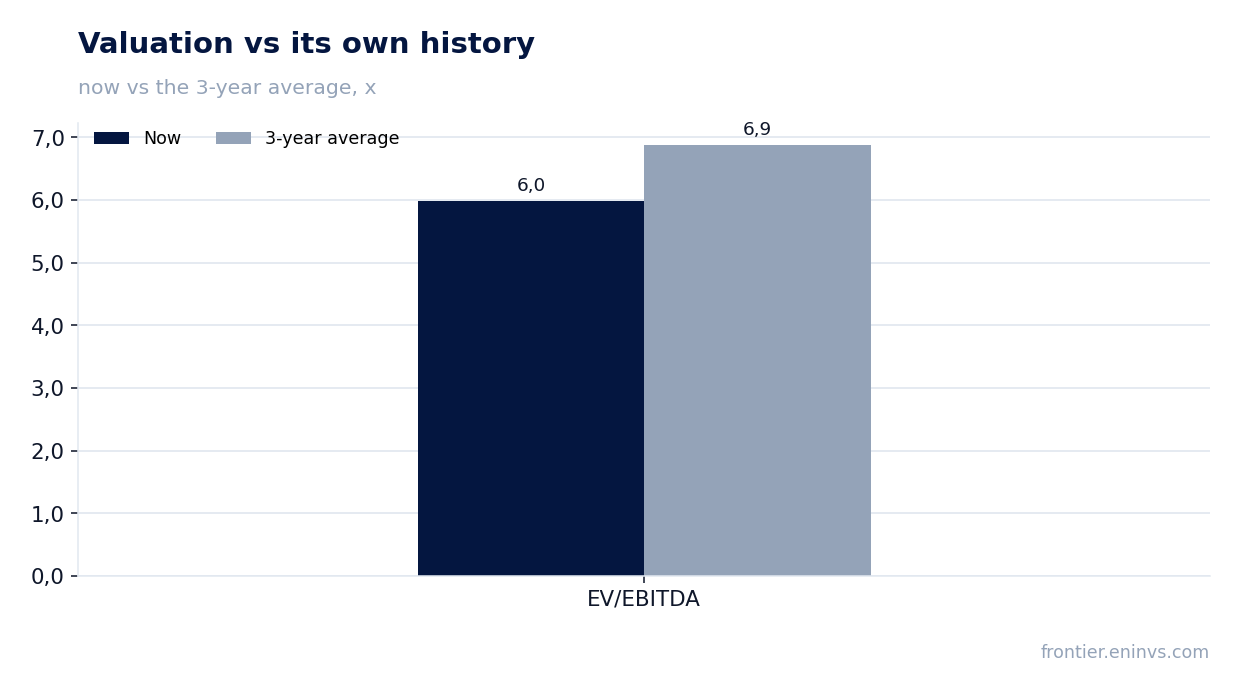
The current EV/EBITDA LTM multiple is 5.99, below its own three-year average of 6.89. This means the stock is cheaper than its own history, yet the portal's model points to further downside. The discrepancy may be because the market is pricing in higher gas prices or expects production growth, while the model uses current spot prices.
The P/E LTM is 8.61, also below historical levels, but LTM profit includes one-off gains, which understates the multiple. Excluding one-off items, profit would be significantly lower and P/E higher. Thus, the EV/EBITDA valuation appears more reliable, and it indicates that the stock trades below its own history but may still be above fair value according to the portal's model.
Valuation on the latest reported figures
| Metric | Value |
|---|---|
| Market cap | 4.37 bn USD |
| P/E (LTM) | 8.6 |
| EV/EBITDA (LTM) | 6.0 |
| P/B | 1.65 |
| Net debt / EBITDA (LTM) | 2.38 |
| Operating cash flow (LTM) | 0.90 bn |
| ROE | 1.3% |
| EV/EBITDA, 3-year average | 6.9 |
Bottom line
Bottom line: in Q2 2026, Comstock Resources reported a sharp decline in revenue and profit due to low gas prices but remained profitable thanks to a one-off sale of a stake in Pinnacle. Production rose sequentially but was nearly flat year-on-year. Leverage is moderate, but capital expenditures are rising, and operating cash flow does not cover investments. The stock trades below its three-year average EV/EBITDA, yet the portal's model points to 63% downside. Given weak fundamentals and uncertainty in the gas market, the stock looks rather unattractive.
Open the company's financial profile CRK →
See also: market overview · valuation map · stock screeners