CISCO SYSTEMS, INC.: record fiscal 2026, but shares fall on slowing order growth

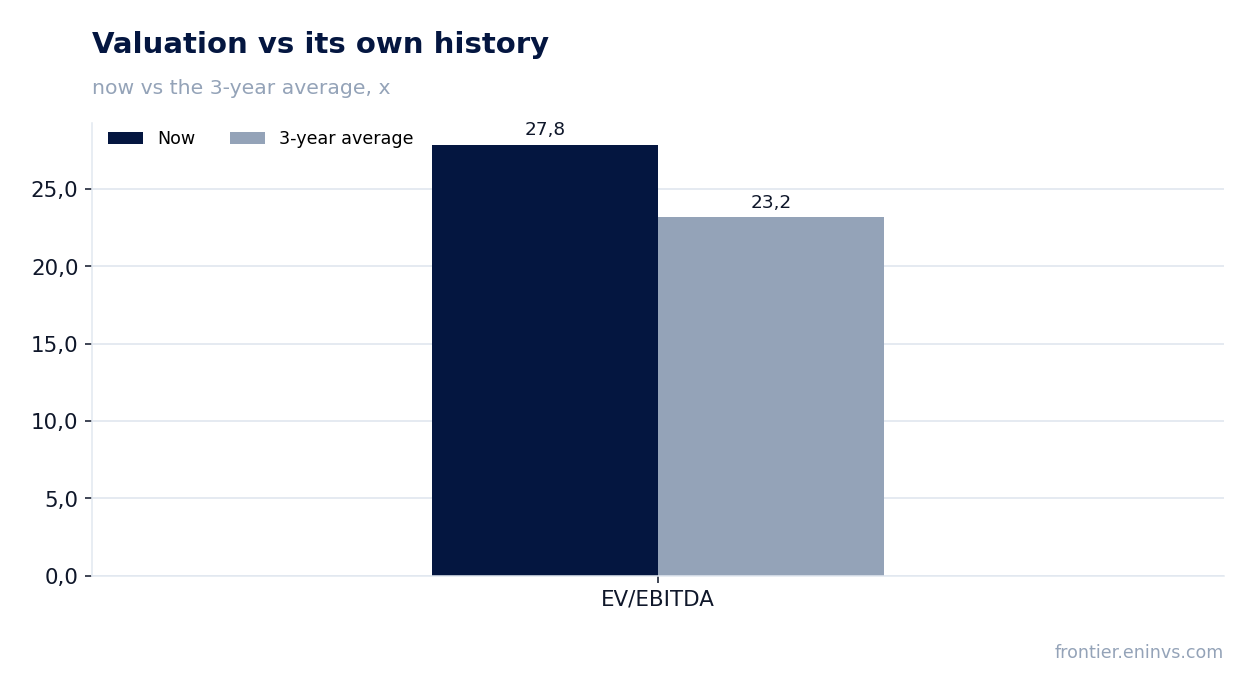
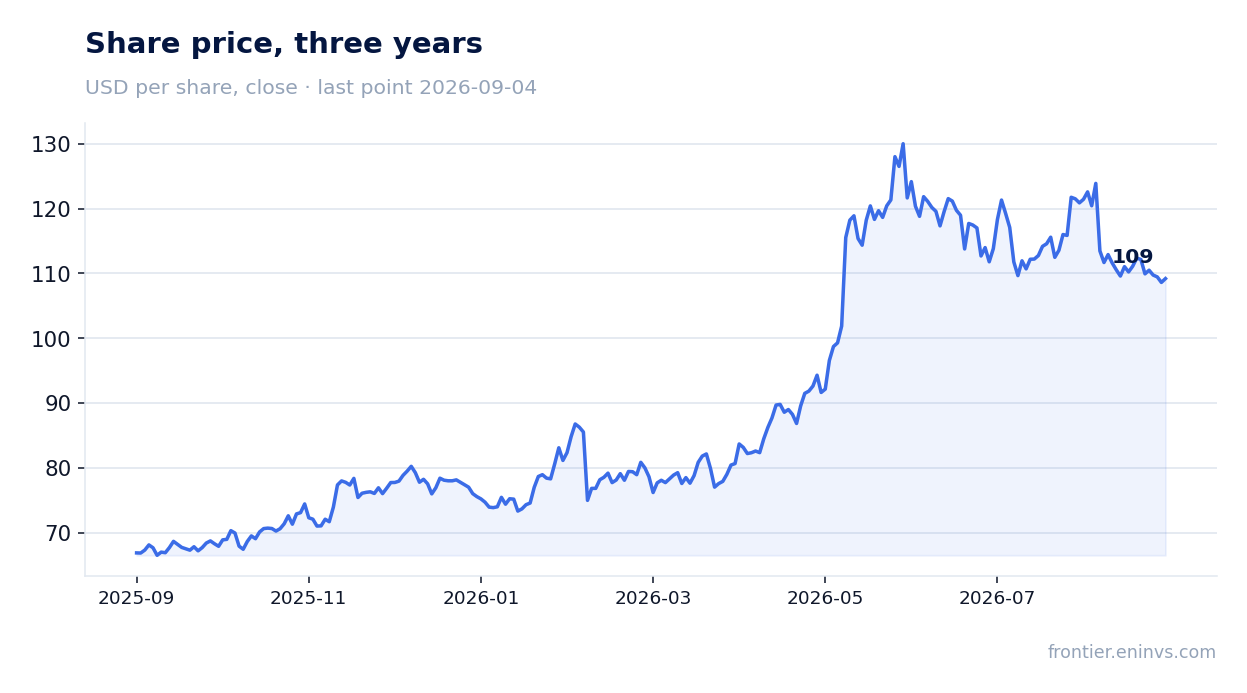
12 августа 2026 года Cisco Systems опубликовала результаты за четвёртый квартал и весь 2026 финансовый год. Выручка за год выросла на 11,8% до 63,3 млрд долл., EBITDA – на 29,0% до 16,1 млрд долл., чистая прибыль – на 30,3% до 13,3 млрд долл.. Несмотря на сильные цифры, акции после отчёта подешевели на 9,3% к 4 сентября, что отражает опасения рынка относительно устойчивости роста заказов и оценки. На текущий момент акции выглядят скорее привлекательно: мультипликатор EV/EBITDA 27,8 выше среднего за три года (23,2), но модель портала оценивает потенциал роста в +1%.
Key takeaways
— Revenue for fiscal 2026 grew 11.8% to $63.3 billion, with Q4 up 18% to $17.3 billion, exceeding the high end of guidance
— EBITDA for the year rose 29.0% to $16.1 billion, with margin expanding from 22.0% to 25.4% on operational efficiency
— Net profit for fiscal 2026 increased 30.3% to $13.3 billion, but Q4 included one-off investment gains of $869 million
— Product orders in Q4 grew 35% year over year, but excluding hyperscalers growth was 25%, indicating continued reliance on large customers
— The company guides fiscal 2027 revenue of $72.2–73.4 billion, implying ~15% growth – below Q4's 18% pace
— Free cash flow for fiscal 2026 was $12.8 billion (OCF $14.2 billion less capex $1.4 billion), covering dividends of $6.6 billion
— Net debt at end of fiscal 2026 was $15.7 billion, with Net Debt/EBITDA of 0.97 – a moderate level
Attractiveness
Key figures, USD bn
| Metric | FY 2025 | FY 2026 | Change |
|---|---|---|---|
| Revenue | 56.7 | 63.3 | +11.8% |
| EBITDA | 12.5 | 16.1 | +29.0% |
| Operating profit | 11.8 | 15.4 | +30.7% |
| Net profit | 10.2 | 13.3 | +30.3% |
| Operating cash flow | 14.2 | 14.2 | -0.1% |
| Capex | 0.91 | 1.41 | +55.8% |
| EBITDA margin | 22.0% | 25.4% | +3.4 pp |
| Net margin | 18.0% | 21.0% | +3.0 pp |
Revenue for fiscal 2026 grew 11.8% to $63.3 billion, with Q4 up 18% to $17.3 billion, exceeding the high end of guidance
In Q4 of fiscal 2026 (ended July 25, 2026), Cisco's revenue was $17.3 billion, up 18% year over year, exceeding the high end of the company's own guidance. Growth was driven by products (+24%), while services revenue was flat.
For the full fiscal 2026, revenue reached $63.3 billion, up 11.8% from the prior year. Quarterly dynamics accelerated through the year: from +6.4% in Q1 to +9.7% in Q2 and +6.4% in Q3, but Q4 jumped to +18% – largely on hyperscaler orders for AI infrastructure.
Geographically, growth was broad: Americas +18%, EMEA +19%, APJC +14% in Q4. Among product categories, Networking led (+28%), followed by Security (+14%), Collaboration (+12%), and Observability (+6%).
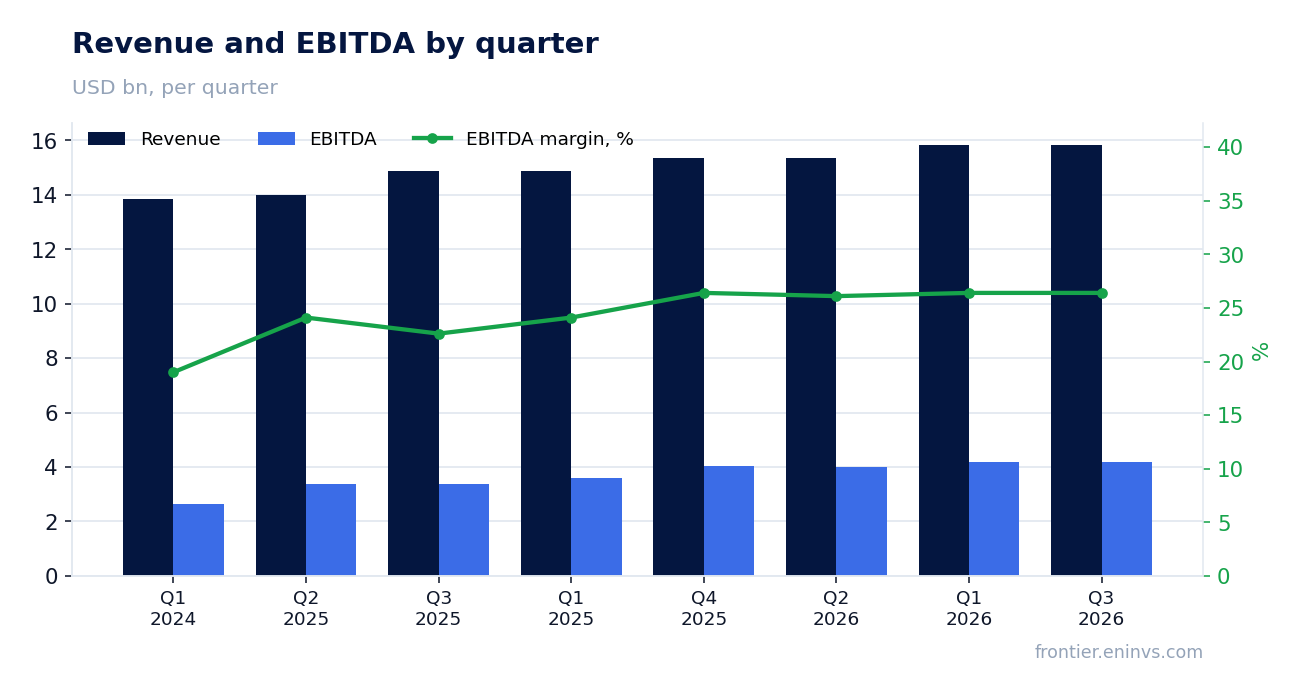
EBITDA for the year rose 29.0% to $16.1 billion, with margin expanding from 22.0% to 25.4% on operational efficiency
EBITDA for fiscal 2026 was $16.1 billion (LTM), up 29.0% from the prior year. EBITDA margin expanded from 22.0% to 25.4% – the company demonstrates operational efficiency, also reflected in GAAP operating income up 31% to $15.4 billion.
In Q4, GAAP operating margin was 24.7%, and non-GAAP – 35.9%, above year-ago levels (21.0% and 34.3%, respectively). Management attributes the improvement to strong discipline and operating leverage.
EBITDA growth outpaced revenue growth (29% vs 11.8%), indicating the company is not only increasing sales but also improving cost structure. However, part of Q4's growth is tied to one-off investment gains, which are excluded from EBITDA but affect net profit.
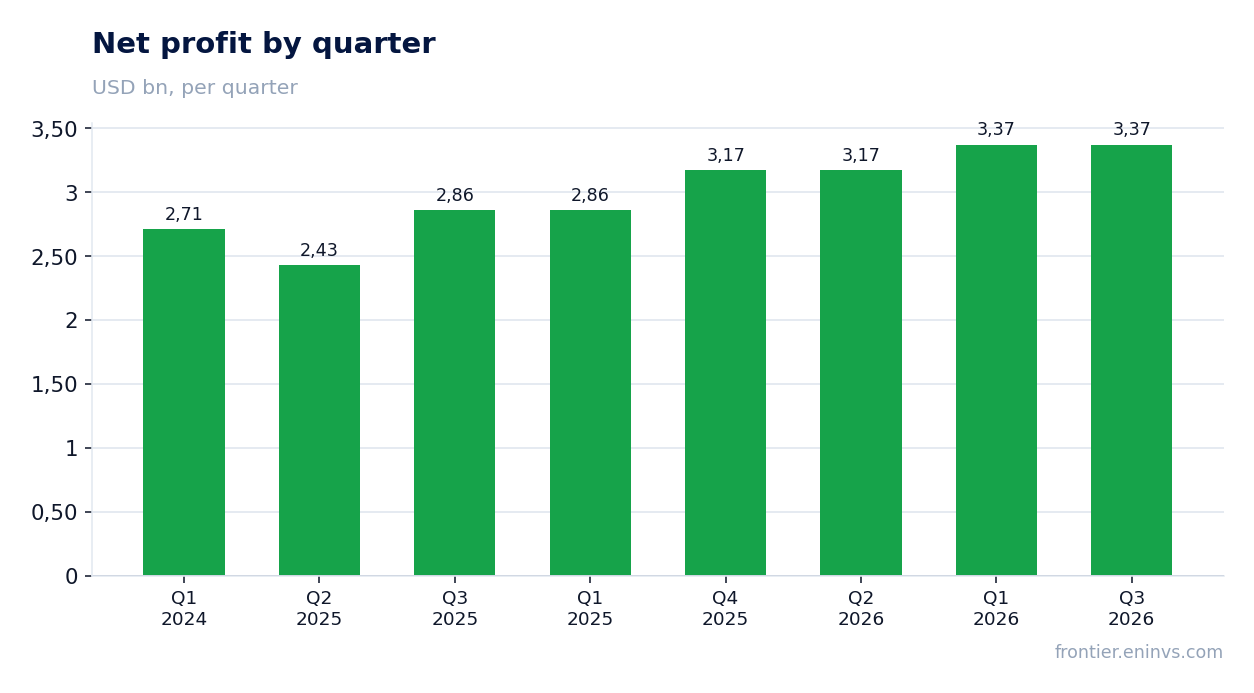
Net profit for fiscal 2026 increased 30.3% to $13.3 billion, but Q4 included one-off investment gains of $869 million
Net profit for fiscal 2026 was $13.3 billion, up 30.3% from the prior year. In Q4, net profit rose 51% to $3.9 billion, and GAAP EPS increased 52% to $0.97.
However, Q4 included 'Other income (loss), net' of $822 million, of which $869 million were gains on investments (per non-GAAP reconciliation). Without these one-off gains, net profit would have been lower, though still showing double-digit growth.
Non-GAAP net profit for the year rose 13% to $17.2 billion, reflecting operational dynamics excluding one-off items. The gap between GAAP and non-GAAP is mainly due to share-based compensation ($3.8 billion) and amortization of acquired intangibles ($1.8 billion).
Product orders in Q4 grew 35% year over year, but excluding hyperscalers growth was 25%, indicating continued reliance on large customers
Cisco reported record demand: in Q4 of fiscal 2026, total product orders grew 35% year over year, and 25% excluding hyperscalers. Growth was double-digit across all geographies and customer markets.
Networking orders grew 40% in Q4 – the eighth consecutive quarter of double-digit growth. Management attributes this to a 'networking supercycle' and rapid AI adoption.
However, reliance on hyperscalers remains significant: they contributed a notable share of order growth. Without them, dynamics would be more modest, posing a risk if large customers cut capital spending.
The company guides fiscal 2027 revenue of $72.2–73.4 billion, implying ~15% growth – below Q4's 18% pace
Cisco guided Q1 of fiscal 2027 revenue of $18.0–18.2 billion, implying ~15% growth year over year (vs $15.8 billion in Q1 2026). Non-GAAP EPS is expected at $1.32–1.34.
For full fiscal 2027, the company expects revenue of $72.2–73.4 billion, corresponding to ~15% growth from the $63.3 billion base. This is below Q4's 18% pace, indicating an expected deceleration.
The fiscal 2027 non-GAAP EPS guidance of $5.05–5.11 implies ~17% growth from $4.33 in 2026. The company also expects non-GAAP operating margin to improve to 35.5–36.5% in Q1.
Free cash flow for fiscal 2026 was $12.8 billion (OCF $14.2 billion less capex $1.4 billion), covering dividends of $6.6 billion
Operating cash flow for fiscal 2026 was $14.2 billion, roughly flat year over year. Capital expenditures rose to $1.4 billion (from $0.9 billion a year earlier), driven by investments in AI infrastructure.
Free cash flow thus stood at about $12.8 billion (OCF minus capex). The company paid $6.6 billion in dividends and $6.1 billion in buybacks, totaling more than FCF, with the deficit covered by debt.
In Q4, OCF was $5.4 billion, up 27% year over year, helped by better collections and higher deferred revenue.
Net debt at end of fiscal 2026 was $15.7 billion, with Net Debt/EBITDA of 0.97 – a moderate level
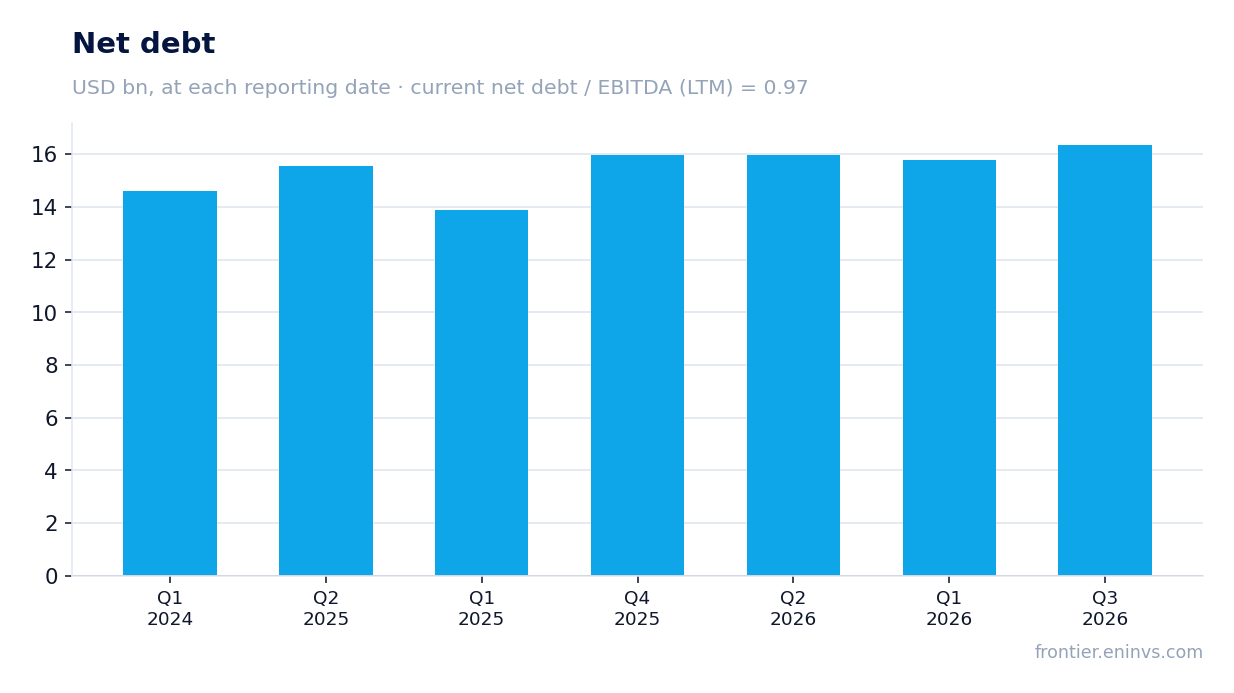
At the end of fiscal 2026, Cisco's net debt was $15.7 billion (per balance sheet: cash and investments of $15.9 billion, debt of $29.5 billion, though exact calculation not shown). Net Debt/EBITDA stood at 0.97 – a moderate level for a company with strong cash flow.
Over the trailing twelve months, net debt increased by $1.3 billion, driven by buybacks and dividends exceeding free cash flow. Nevertheless, leverage remains comfortable, and the company retains an investment-grade rating.
Cisco continues returning capital: in Q4 it paid $1.7 billion in dividends and repurchased $1.5 billion in stock. The quarterly dividend was raised to $0.42 per share, corresponding to an annual yield of about 1.5%.
Valuation on the latest reported figures
| Metric | Value |
|---|---|
| Market cap | 432 bn USD |
| P/E (LTM) | 32.5 |
| EV/EBITDA (LTM) | 27.8 |
| P/B | 8.59 |
| Net debt / EBITDA (LTM) | 0.97 |
| Operating cash flow (LTM) | 14.2 bn |
| ROE | 26.8% |
| Dividend yield (12m) | 1.5% |
| EV/EBITDA, 3-year average | 23.2 |
Bottom line
Cisco closed fiscal 2026 with record results: revenue up 11.8%, EBITDA up 29%, and margin expanded to 25.4%. The company is clearly benefiting from the AI supercycle, as evidenced by 35% order growth in Q4, and offers strong guidance for fiscal 2027. However, part of the profit was one-off, and order growth excluding hyperscalers is more modest. At the current price, shares trade at a premium to their own history (EV/EBITDA 27.8 vs 23.2 average), limiting upside. Our verdict is 'rather attractive': strong fundamentals justify some premium, but investors should wait for confirmation of sustainable order growth in coming quarters.
Open the company's financial profile CSCO →
See also: market overview · valuation map · stock screeners