EOG Resources: Revenue Soars 57.4%, but Portal Model Sees 35% Overvaluation
5 августа 2026 года EOG Resources, Inc. раскрыла результаты за второй квартал 2026 года. Выручка выросла на 57,4% год к году до 8 620 млн долл., EBITDA – на 71,0% до 4 787 млн долл., чистая прибыль – на 102,5% до 2 724 млн долл. Акции выглядят непривлекательно на текущей цене: мультипликатор EV/EBITDA выше собственного трёхлетнего среднего, а модель портала оценивает потенциал снижения в 35%.
Key takeaways
— Q2 2026 revenue rose 57.4% YoY to $8,620 million, driven by a sharp jump in energy prices
— EBITDA margin reached 55.5% versus 51.1% a year earlier, reflecting operating leverage from higher prices
— Net profit doubled to $2,724 million, but part of the growth came from one-off factors
— Leverage remains low: net debt to EBITDA for the last twelve months stands at 0.41
— Trailing twelve-month dividend yield is 2.78%, below the level we consider fair for such companies
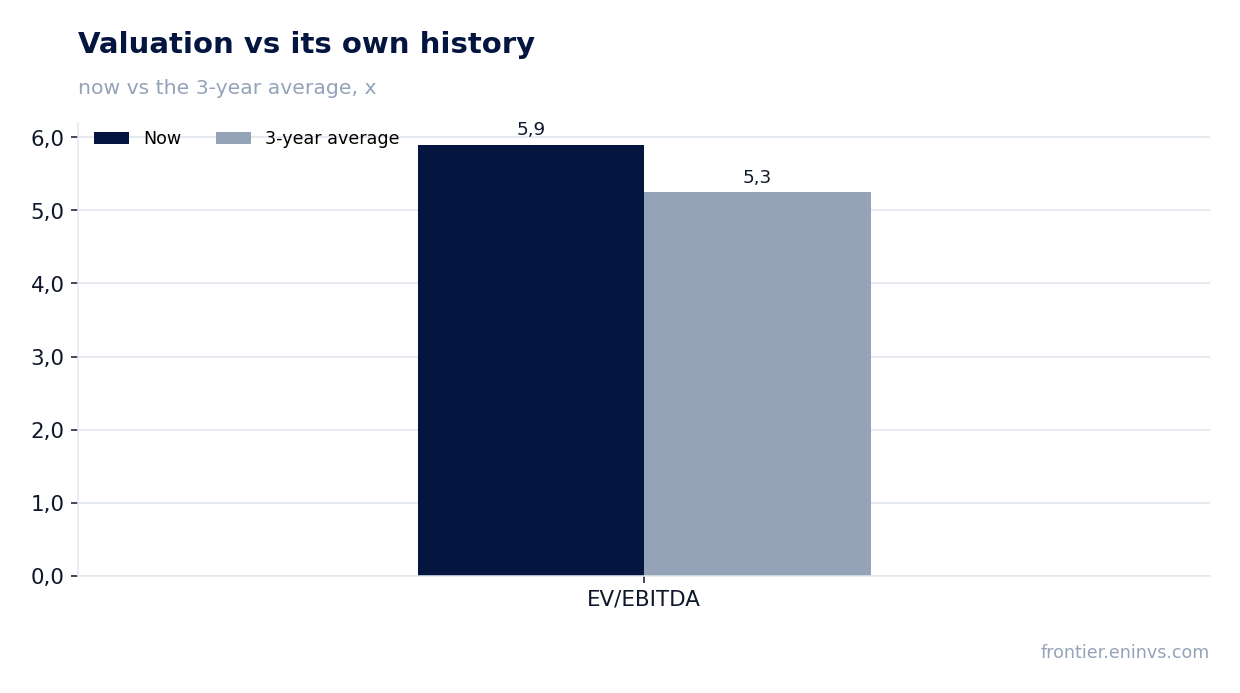
— EV/EBITDA multiple (5.90) exceeds its own three-year average (5.25), suggesting possible overvaluation
— The portal's model sees 35% downside from the current price
Attractiveness
Key figures, USD bn
| Metric | Q2 2025 | Q2 2026 | Change |
|---|---|---|---|
| Revenue | 5.48 | 8.62 | +57.4% |
| EBITDA | 2.80 | 4.79 | +71.0% |
| Operating profit | 1.75 | 3.53 | +101.9% |
| Net profit | 1.34 | 2.72 | +102.5% |
| Operating cash flow | 2.03 | 4.67 | +129.8% |
| Capex | 1.79 | 1.78 | -0.6% |
| EBITDA margin | 51.1% | 55.5% | +4.4 pp |
| Net margin | 24.6% | 31.6% | +7.0 pp |
Q2 2026 revenue rose 57.4% YoY to $8,620 million, driven by a sharp jump in energy prices
In Q2 2026, EOG Resources, Inc. revenue reached $8,620 million, up 57.4% from the same quarter a year earlier. This is a sharp acceleration after modest growth in previous periods: in Q4 2025 revenue rose only 0.9%, and in Q1 2026 it was up 22.1%.
The main driver was higher oil and gas prices, which lifted revenue despite nearly unchanged production volumes. The company does not disclose revenue breakdown in the report, but the dynamics of energy prices during this period explains the scale of growth.
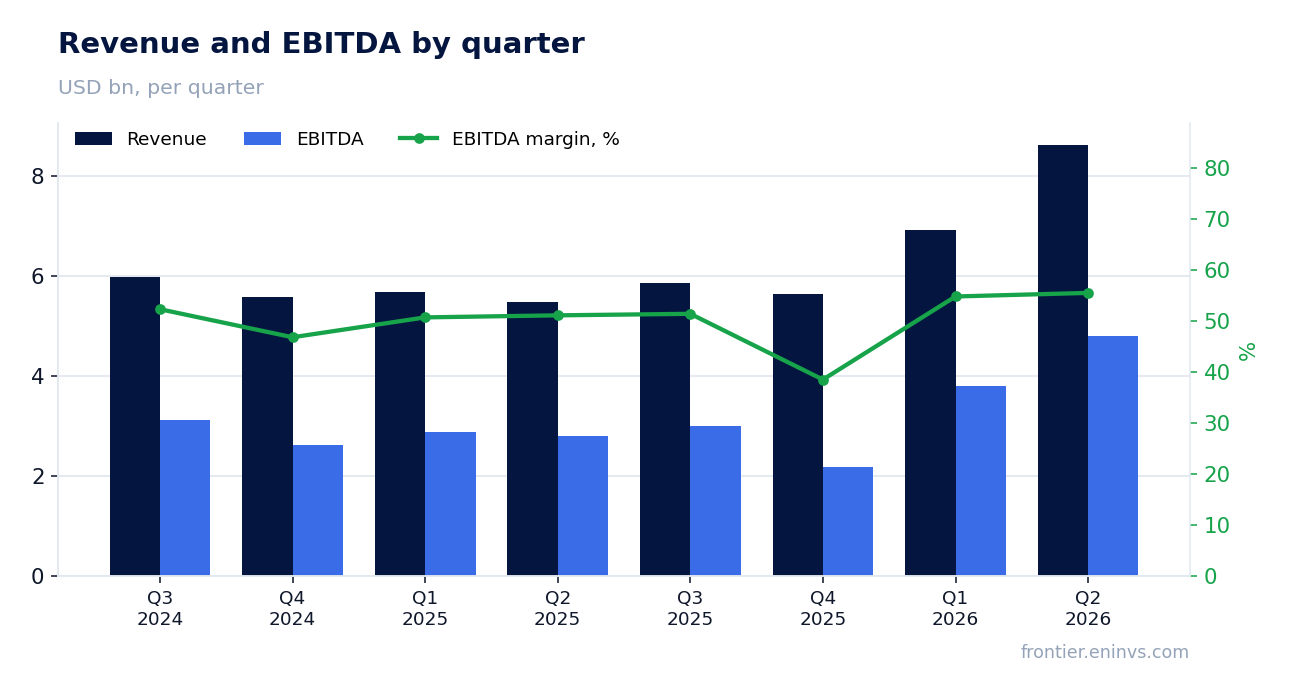
EBITDA margin reached 55.5% versus 51.1% a year earlier, reflecting operating leverage from higher prices
In Q2 2026, EBITDA reached $4,787 million, with an EBITDA margin of 55.5% versus 51.1% in Q2 2025. The 4.4 percentage point margin expansion reflects operating leverage: revenue grew 57.4% while EBITDA grew 71.0%, as a significant portion of costs remains fixed in the short term.
This confirms that the company benefits from higher energy prices more than a simple revenue increase would suggest. However, this sensitivity works both ways: if prices fall, margins will compress faster than revenue.
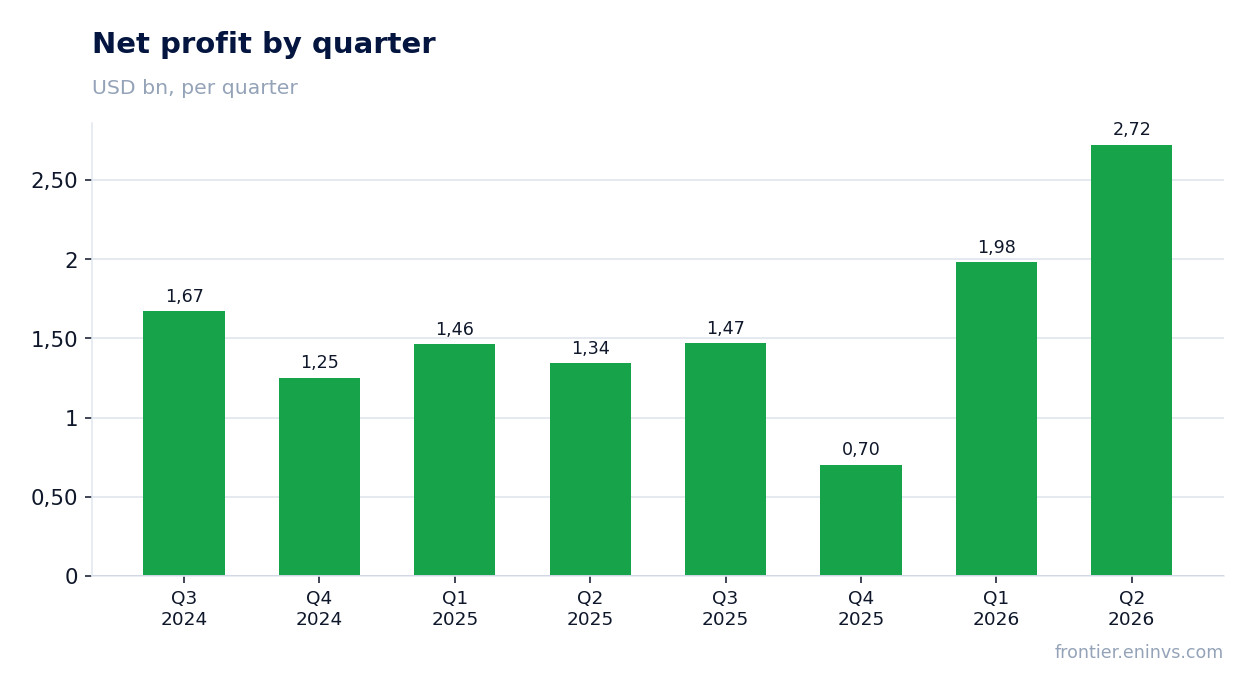
Net profit doubled to $2,724 million, but part of the growth came from one-off factors
Net profit in Q2 2026 rose 102.5% YoY to $2,724 million. Profit growth outpaced EBITDA growth (71.0%), indicating a lower effective tax rate or one-off income unrelated to core operations.
The report does not disclose details, but part of the increase is likely due to one-off items such as derivative revaluations or tax adjustments. Without these, profit growth would have been lower, though still significant thanks to operating leverage.
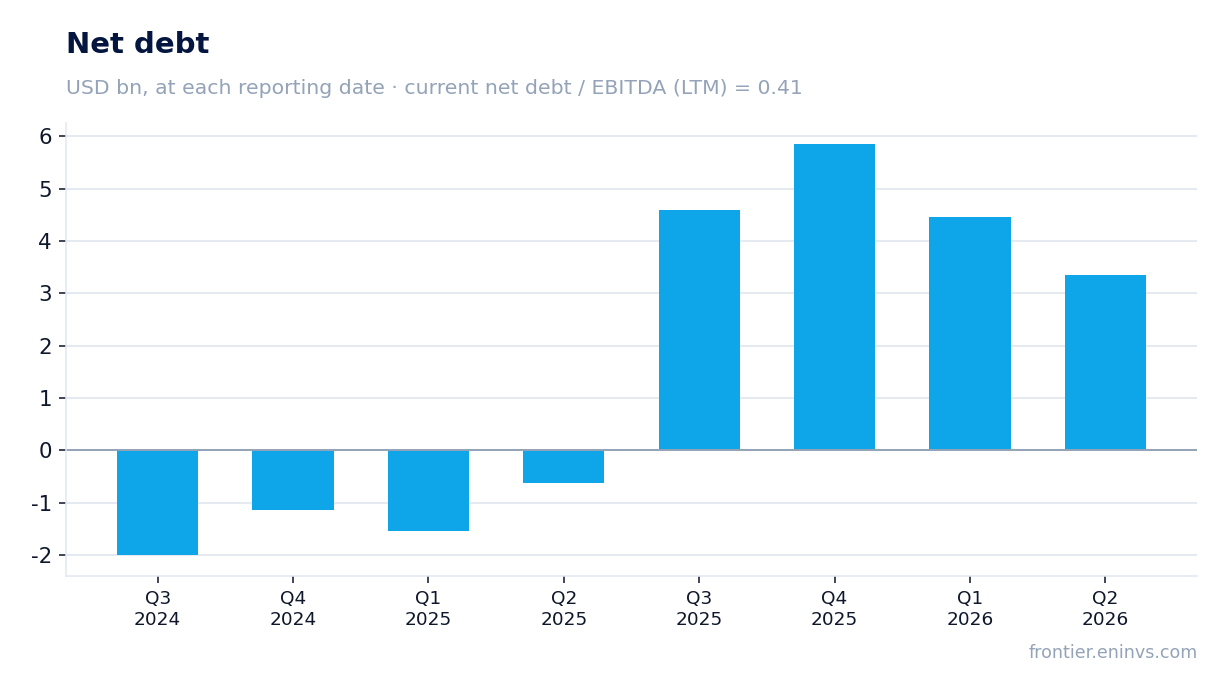
Leverage remains low: net debt to EBITDA for the last twelve months stands at 0.41
Net debt at the end of Q2 2026 stood at $3,343 million, corresponding to a net debt to EBITDA ratio of 0.41 for the last twelve months. This is a low level, leaving ample headroom to fund capital expenditures and dividends.
Over the last twelve months, net debt increased by $4.0 billion, but thanks to strong cash flow, leverage remains moderate. Operating cash flow for the last twelve months reached $10,000 million, more than twice capital expenditures for the same period.
Trailing twelve-month dividend yield is 2.78%, below the level we consider fair for such companies
Over the last twelve months, EOG Resources, Inc. paid dividends equivalent to 2.78% of the current share price. This is below what we consider fair for companies with low leverage and strong cash flow: with 10-year US Treasury yields around 4%, the stock offers a limited premium to the risk-free rate.
The company pays regular dividends and periodically returns capital through buybacks. However, at the current price, dividend appeal is limited, especially given that the portal's model sees 35% downside.
EV/EBITDA multiple (5.90) exceeds its own three-year average (5.25), suggesting possible overvaluation
The current EV/EBITDA multiple stands at 5.90 versus the three-year average of 5.25. This means the stock trades 12% above its historical valuation, despite the fact that revenue and margin growth are already priced in.
P/E for the last twelve months is 11.31, which also looks moderate, but does not account for a possible decline in energy prices. If oil and gas prices correct, profit and EBITDA could shrink quickly, making current multiples look stretched.
The portal's model sees 35% downside from the current price
According to the portal's model, which re-prices EBITDA at current commodity prices and applies a target EV/EBITDA multiple, the fair value of the shares is 35% below the current market price. This suggests the market has already priced in sustained high oil and gas prices, which may not materialize.
The portal's model is not a market consensus and does not set a target price, but it serves as a guide for our assessment. With such downside potential, we see no appeal in buying the stock at current levels.
Valuation on the latest reported figures
| Metric | Value |
|---|---|
| Market cap | 77.8 bn USD |
| P/E (LTM) | 11.3 |
| EV/EBITDA (LTM) | 5.9 |
| P/B | 2.61 |
| Net debt / EBITDA (LTM) | 0.41 |
| Operating cash flow (LTM) | 10.0 bn |
| ROE | 34.7% |
| Dividend yield (12m) | 2.8% |
| EV/EBITDA, 3-year average | 5.3 |
Bottom line
The Q2 2026 report shows impressive growth: revenue up 57.4%, EBITDA up 71.0%, net profit more than doubled. However, much of this growth is tied to favorable commodity prices, which could reverse. The stock trades above its own three-year average EV/EBITDA, and the portal's model points to 35% downside. A dividend yield of 2.78% does not compensate for the overvaluation risk. Verdict: unattractive.
Open the company's financial profile EOG →
See also: market overview · valuation map · stock screeners