Robinhood Markets, Inc.: record revenue and profit, but the market focuses on slowing EBITDA margin

On July 29, 2026, Robinhood Markets, Inc. reported results for the second quarter of 2026. Revenue rose 32.3% to a record $1,308 million, net profit increased 45.3% to $561 million, but EBITDA margin fell from 46.8% to 36.6%. At the current price, the share looks rather attractive: growth continues, but the valuation already prices in a lot.
Key takeaways
— Revenue grew 32.3% to a record $1.31 billion for the quarter, but growth slowed from 45% a year ago
— EBITDA margin fell from 46.8% to 36.6% due to a 33% increase in operating expenses
— Net profit rose 45.3%, but $129 million of it was one-off gains from the deconsolidation of RVI
— Funded customers grew 7% to 28.4 million, and net deposits reached a record $21.7 billion for the quarter
— The company lowered its 2026 adjusted operating expense outlook to $2.675–2.775 billion
— Shares rose 24.3% after the report but still trade at a discount to the portal's model
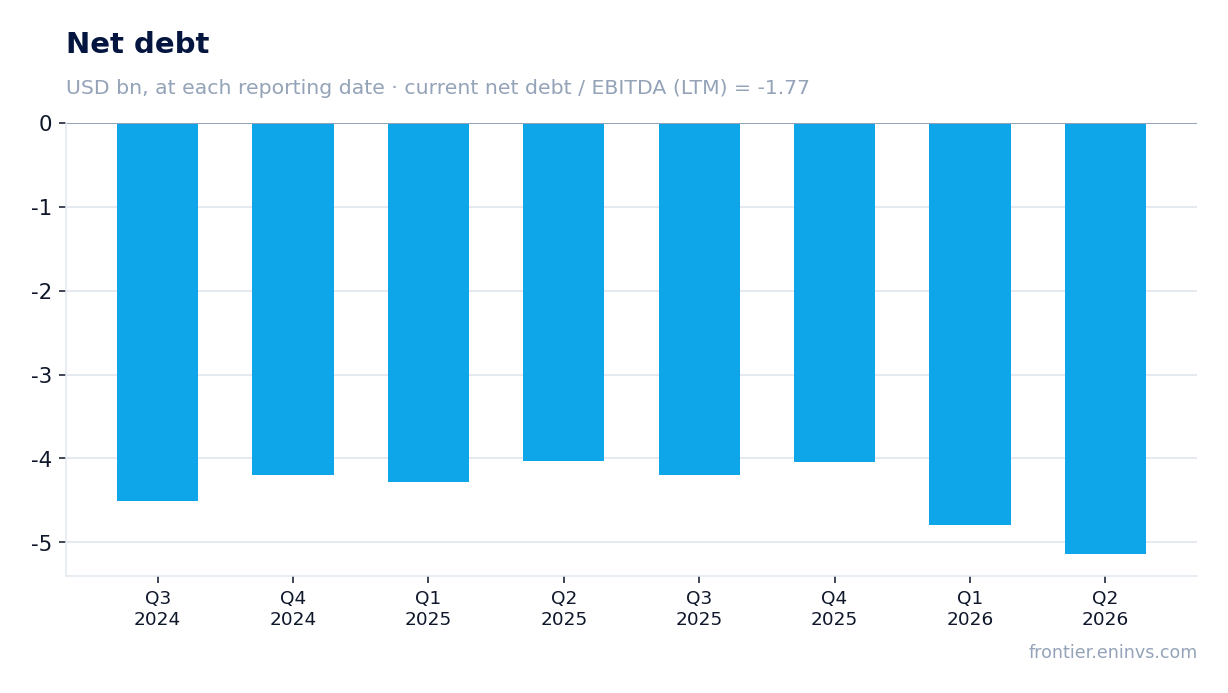
— Net debt is negative: minus $5.1 billion at the end of the quarter
Attractiveness
Key figures, USD bn
| Metric | Q2 2025 | Q2 2026 | Change |
|---|---|---|---|
| Revenue | 0.99 | 1.31 | +32.3% |
| EBITDA | 0.46 | 0.48 | +3.5% |
| Operating profit | 0.44 | 0.46 | +3.2% |
| Net profit | 0.39 | 0.56 | +45.3% |
| Operating cash flow | 3.51 | 0.72 | -79.5% |
| Capex | 0.01 | 0.02 | +200.0% |
| EBITDA margin | 46.8% | 36.6% | -10.2 pp |
| Net margin | 39.0% | 42.9% | +3.9 pp |
Revenue grew 32.3% to a record $1.31 billion for the quarter, but growth slowed from 45% a year ago
In the second quarter of 2026, Robinhood Markets, Inc. revenue reached $1,308 million, up 32.3% year-over-year. This is a record quarterly figure, but growth slowed: a year ago revenue was up 45%, and in Q3 2025 growth reached 100%.
The main driver was transaction-based revenue, up 44% to $776 million. Within it, event contracts revenue was particularly strong at $156 million, more than 10x higher than a year ago. Options revenue rose 29% to $342 million, equities revenue rose 95% to $129 million. Meanwhile, cryptocurrency revenue fell 38% to $100 million. Net interest revenue rose 9% to $389 million, and other revenue rose 54% to $143 million, helped by Trump Account service fees and Robinhood Gold subscriptions.
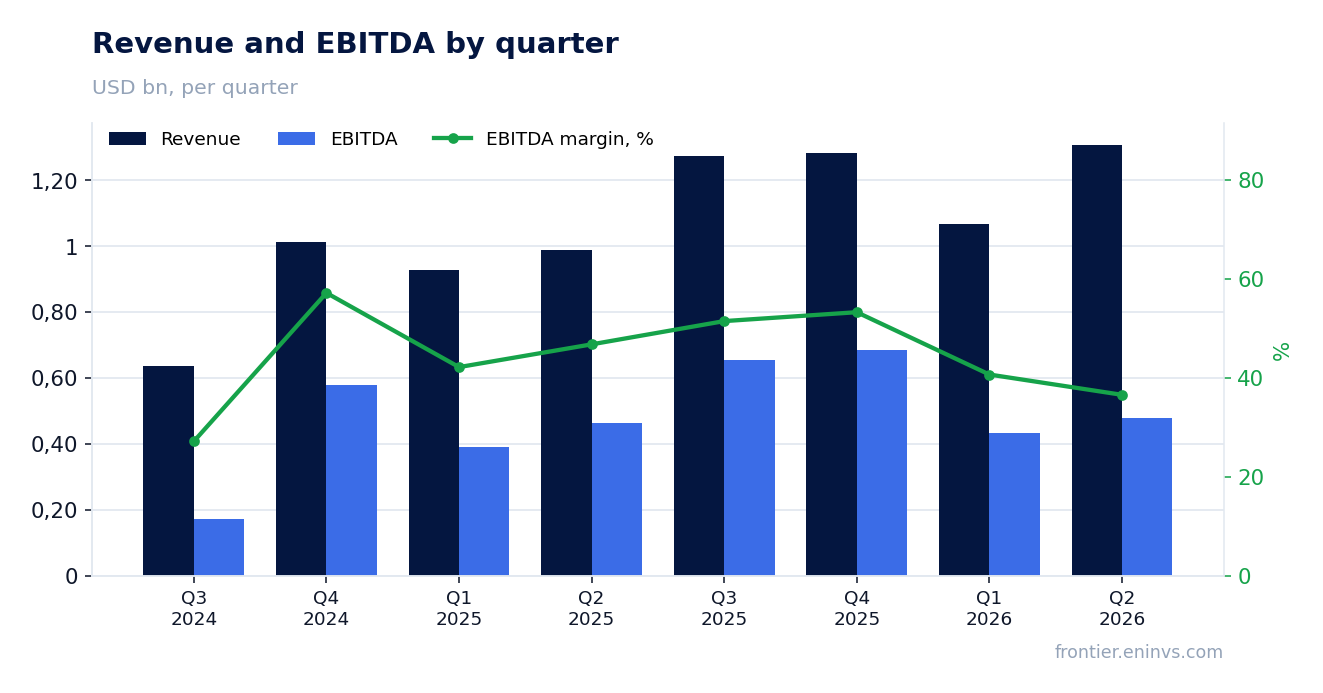
EBITDA margin fell from 46.8% to 36.6% due to a 33% increase in operating expenses
EBITDA in Q2 rose only 3.5% to $479 million, while revenue grew 32.3%. As a result, EBITDA margin fell from 46.8% a year ago to 36.6%.
The reason is operating expenses, which rose 33% to $734 million. The company increased marketing and growth investments, incurred one-time restructuring charges from the June 2026 workforce reduction, and costs related to Trump Accounts and Rothera. Adjusted operating expenses (non-GAAP) rose 23% to $641 million, still outpacing revenue growth.
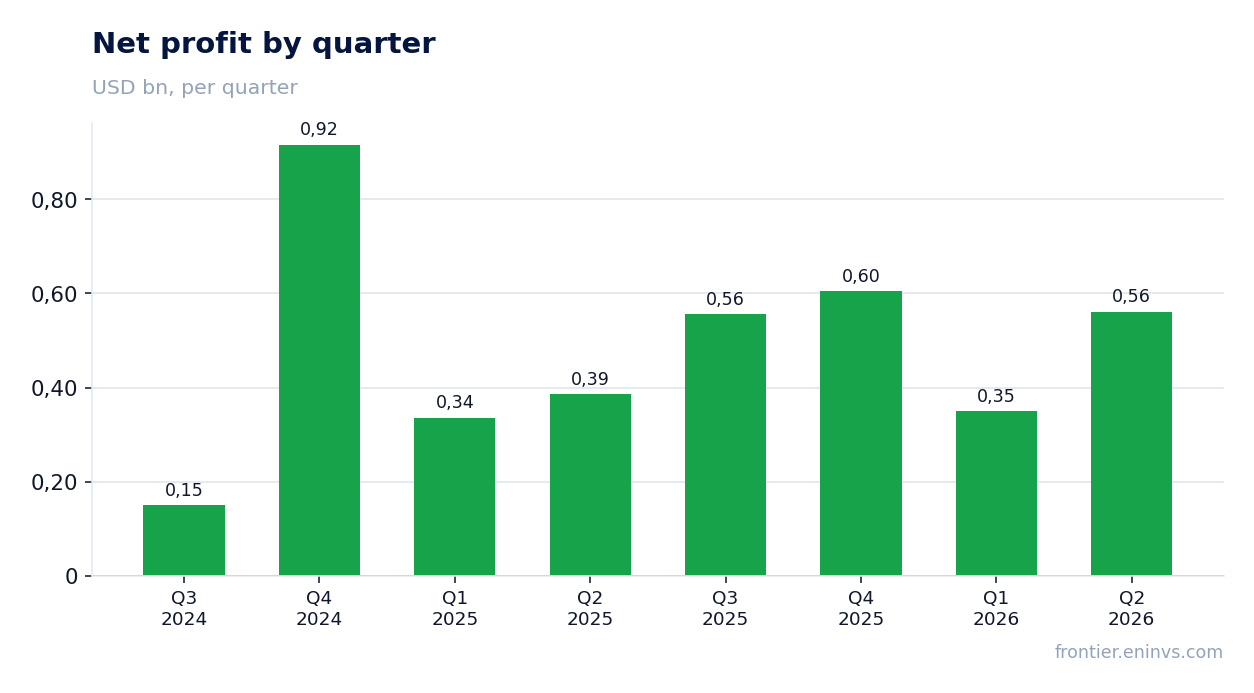
Net profit rose 45.3%, but $129 million of it was one-off gains from the deconsolidation of RVI
Net profit in Q2 2026 was $561 million, up 45.3% year-over-year. However, this figure includes $129 million of one-off gains, mainly related to the deconsolidation of Robinhood Ventures Fund I (RVI). Without them, profit would have been noticeably lower — around $432 million, still above last year's $386 million, but growth would have been only about 12%.
The one-off nature is confirmed by the income statement: 'other income, net' jumped to $135 million from $3 million a year ago. Investors should note that part of quarterly profit is not operational.
Funded customers grew 7% to 28.4 million, and net deposits reached a record $21.7 billion for the quarter
Funded customers reached 28.4 million, up 7% year-over-year. Investment accounts rose 9% to 29.9 million. Net deposits for the quarter were a record $21.7 billion, an annualized growth rate of 28% relative to assets at the end of Q1 2026.
Customer and deposit growth is a key indicator of future revenue, as it expands the base for transaction and interest income. Robinhood Gold subscribers rose 39% to 4.8 million, and average revenue per user (ARPU) increased 24% to $187.
The company lowered its 2026 adjusted operating expense outlook to $2.675–2.775 billion
Robinhood Markets, Inc. revised its 2026 outlook for adjusted operating expenses and SBC (non-GAAP) downward: now expected in the range of $2.675–2.775 billion, versus the previous $2.7–2.825 billion. The new outlook includes costs for Rothera and WonderFi but excludes potential credit loss provisions, costs for pending acquisitions, and other significant items.
The lowered outlook reflects efficiencies captured, part of which is funding new businesses. For investors, this signals cost control despite an active expansion phase.
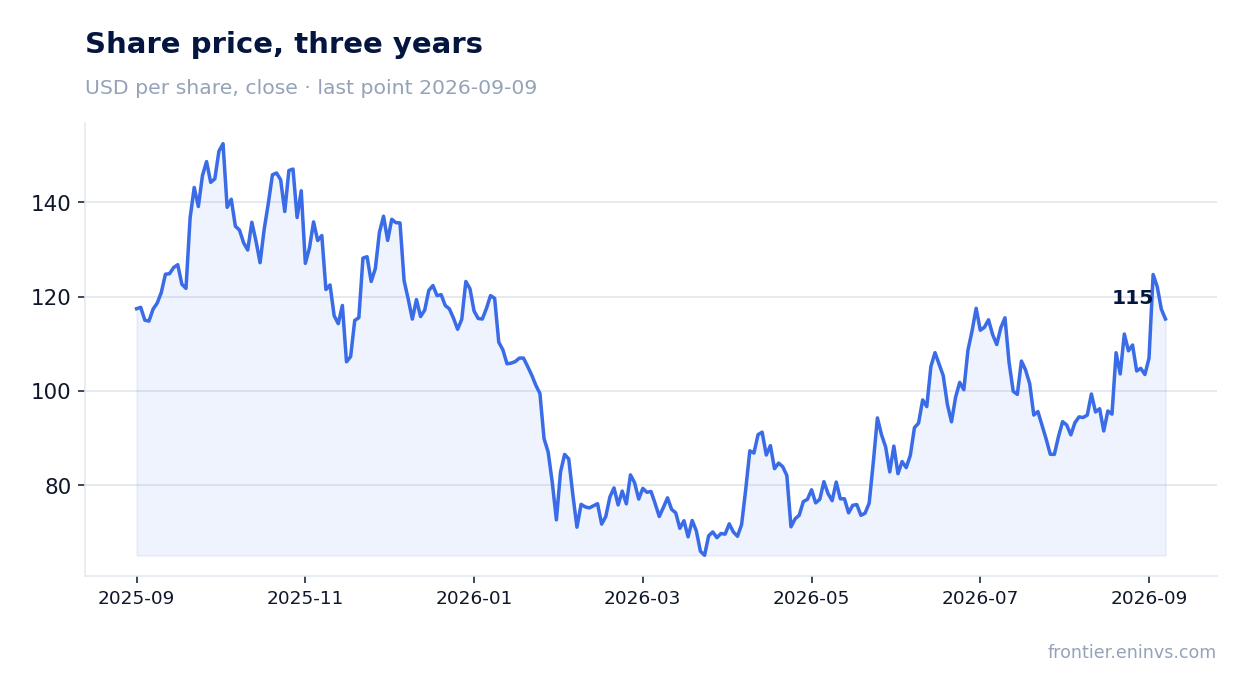
Shares rose 24.3% after the report but still trade at a discount to the portal's model
The day after the report, shares fell 3.1%, but from the release to September 9, 2026, they rose 24.3%. Current market capitalization is $103.9 billion.
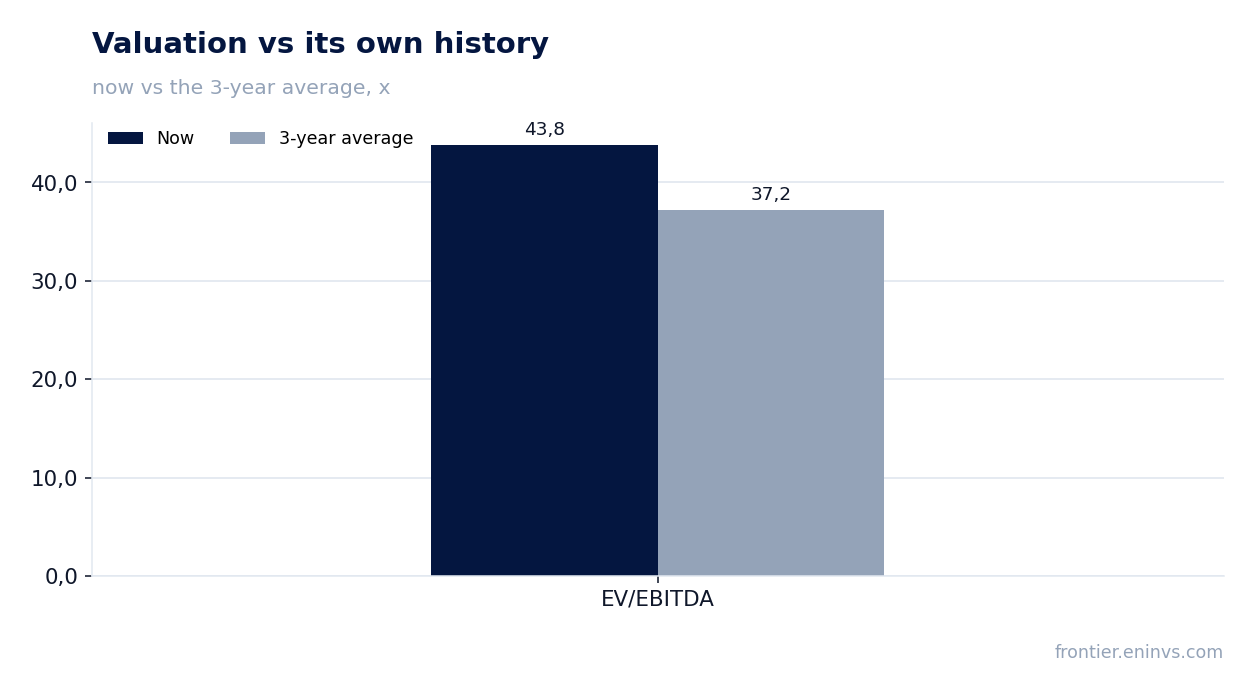
According to the portal's model, the upside is +2% to fair value. EV/EBITDA LTM is 43.8 versus the three-year average of 37.2 — the stock trades at a premium to its own history. P/E LTM is 50.1.
Net debt is negative: minus $5.1 billion at the end of the quarter
At the end of Q2 2026, Robinhood Markets, Inc. net debt was minus $5,143 million, meaning cash and liquid assets significantly exceeded debt. The metric improved by $0.4 billion quarter-over-quarter and by $1.1 billion over 12 months.
Net debt to EBITDA LTM is -1.77. The company maintains a financial cushion, which is important amid market volatility and active expansion.
Valuation on the latest reported figures
| Metric | Value |
|---|---|
| Market cap | 104 bn USD |
| P/E (LTM) | 50.1 |
| EV/EBITDA (LTM) | 43.8 |
| P/B | 11.35 |
| Net debt / EBITDA (LTM) | -1.77 |
| Operating cash flow (LTM) | 1.60 bn |
| ROE | 23.3% |
| EV/EBITDA, 3-year average | 37.2 |
Bottom line
In Q2 2026, Robinhood Markets, Inc. delivered record revenue and strong customer growth, confirming the resilience of its business model. However, EBITDA margin declined significantly, and part of profit was driven by one-off gains. At the current valuation — EV/EBITDA 43.8 vs. the three-year average of 37.2 — the share looks rather attractive, but upside is limited. The key question for holders is whether the company can restore margins as new products like Trump Accounts and Rothera scale.
Open the company's financial profile HOOD →
See also: market overview · valuation map · stock screeners