INTERNATIONAL BUSINESS MACHINES CORP: disappointing quarter, but shares already fell 25% – the question is how much is priced in
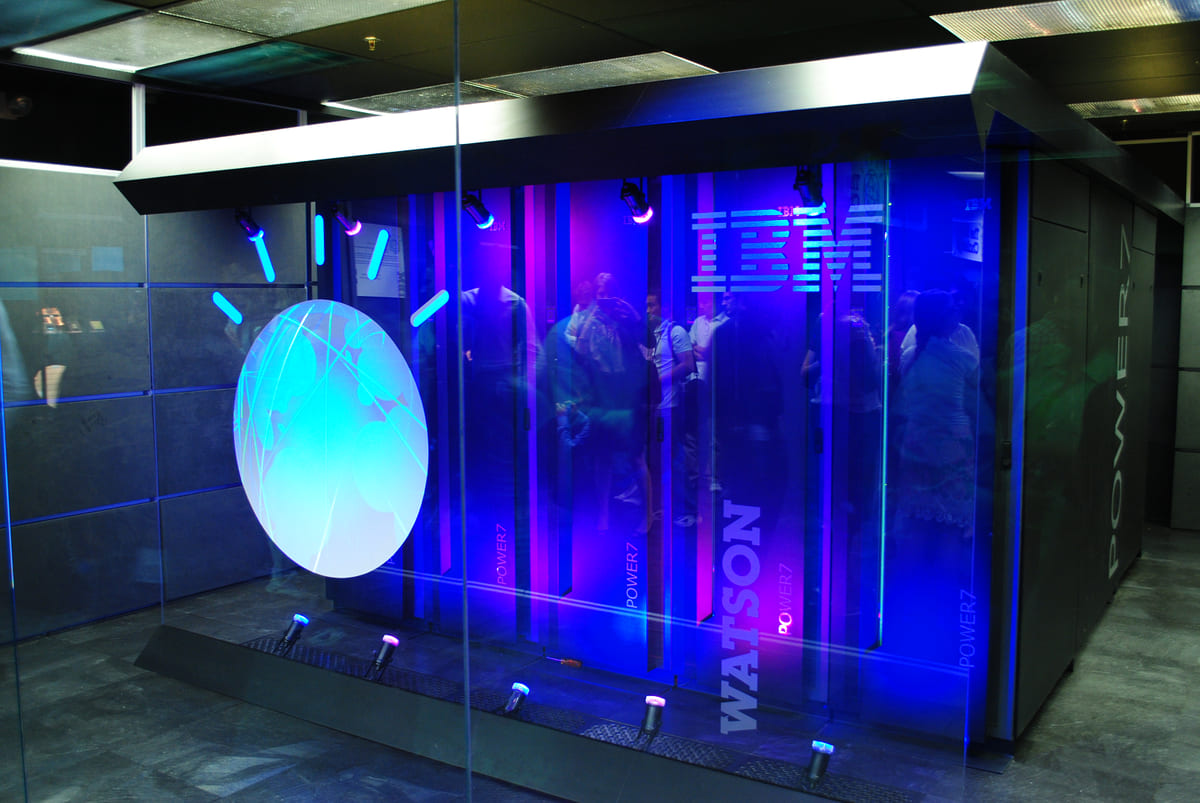
14 июля INTERNATIONAL BUSINESS MACHINES CORP раскрыла предварительные результаты за второй квартал 2026 года. Выручка выросла лишь на 1,1% до 17 162 млн долл., EBITDA – на 24,3% до 3 828 млн долл., чистая прибыль снизилась на 1,3% до 2 165 млн долл. Акции на релизе упали на 25,2%, и по состоянию на 4 сентября они ещё на 19,1% ниже уровня до публикации. При текущей цене акции выглядят скорее привлекательно: падение уже компенсировало значительную часть разочарования, а мультипликаторы вернулись к уровням ниже собственной трёхлетней истории.
Key takeaways
— Выручка выросла лишь на 1,1% из-за провала в Infrastructure и слабости в Consulting
— EBITDA прибавила 24,3% благодаря операционной эффективности, но чистая прибыль снизилась на 1,3%
— Свободный денежный поток за полугодие составил 4,8 млрд долл., что покрывает дивиденды, но долг вырос
— Акции упали на 25,2% в день релиза и ещё на 19,1% к 4 сентября – рынок наказал за неожиданный сбой
— Мультипликатор EV/EBITDA в 17,96 ниже собственного трёхлетнего среднего 20,49, но P/E в 20,78 остаётся высоким
— Компания объявила о крупных инвестициях в квантовые вычисления и Lightwell, что потребует дополнительных расходов
Attractiveness
Key figures, USD bn
| Metric | Q2 2025 | Q2 2026 | Change |
|---|---|---|---|
| Revenue | 17.0 | 17.2 | +1.1% |
| EBITDA | 3.86 | 4.80 | +24.3% |
| Operating profit | 2.60 | 2.48 | -4.5% |
| Net profit | 2.19 | 2.17 | -1.3% |
| Operating cash flow | 1.70 | 2.60 | +52.7% |
| Capex | 0.21 | 0.38 | +82.4% |
| EBITDA margin | 22.7% | 28.0% | +5.3 pp |
| Net margin | 12.9% | 12.6% | -0.3 pp |
Revenue grew only 1.1% due to Infrastructure shortfall and weak Consulting
In Q2 2026, INTERNATIONAL BUSINESS MACHINES CORP revenue reached $17,162 million, only 1.1% higher than a year earlier. The company attributes this to a shortfall in Infrastructure, which declined 7% due to weak sales of z17 mainframes and the associated software stack. Clients shifted capex toward servers and storage in late June ahead of expected price increases, causing large deals to miss their timelines.
Software revenue grew 5%, with Red Hat accelerating to 11% and recent acquisitions HashiCorp and Confluent performing strongly. Consulting was flat (up 1% in constant currency), reflecting client caution. Thus, revenue growth was the weakest in recent quarters: the previous three quarters saw 9.5%, 12.1%, and 9.1% growth, respectively.
EBITDA rose 24.3% on operational efficiency, but net profit fell 1.3%
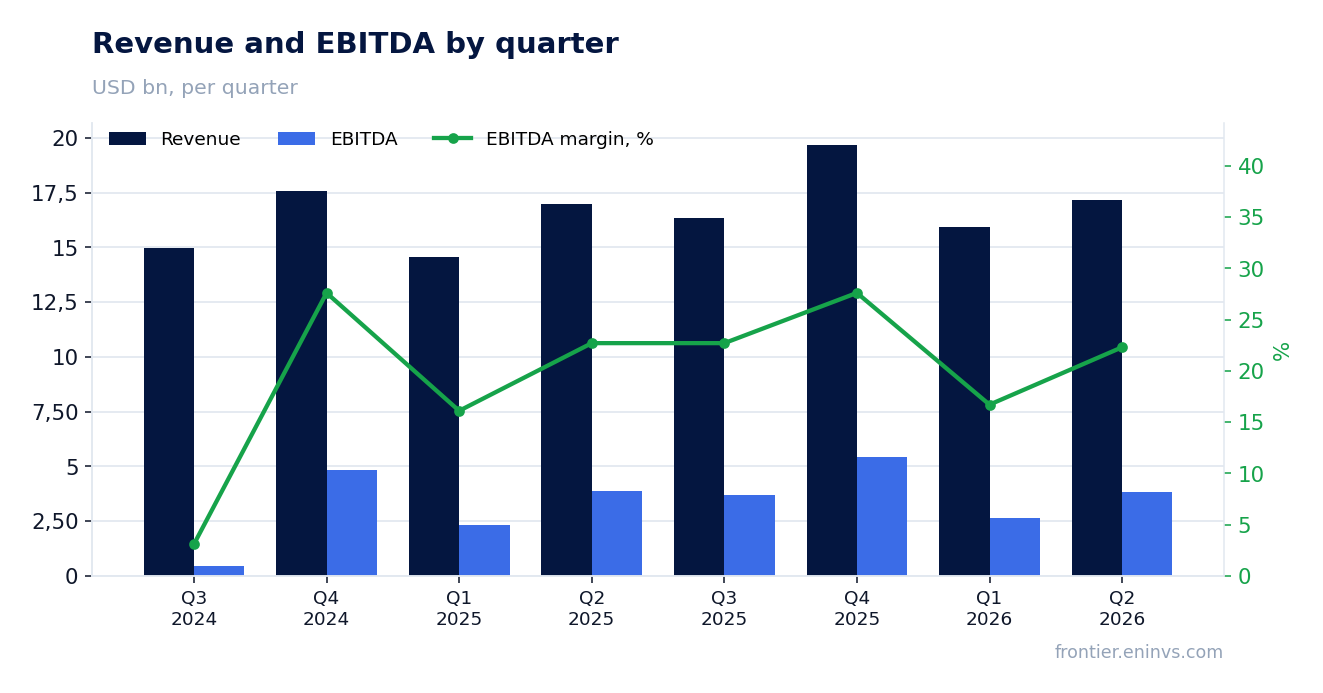
EBITDA in Q2 2026 rose 24.3% to $3,828 million, with EBITDA margin expanding from 22.7% to 28.0%. The company attributes this to productivity initiatives that continued to expand operating (non-GAAP) pre-tax income margin by 30 basis points.
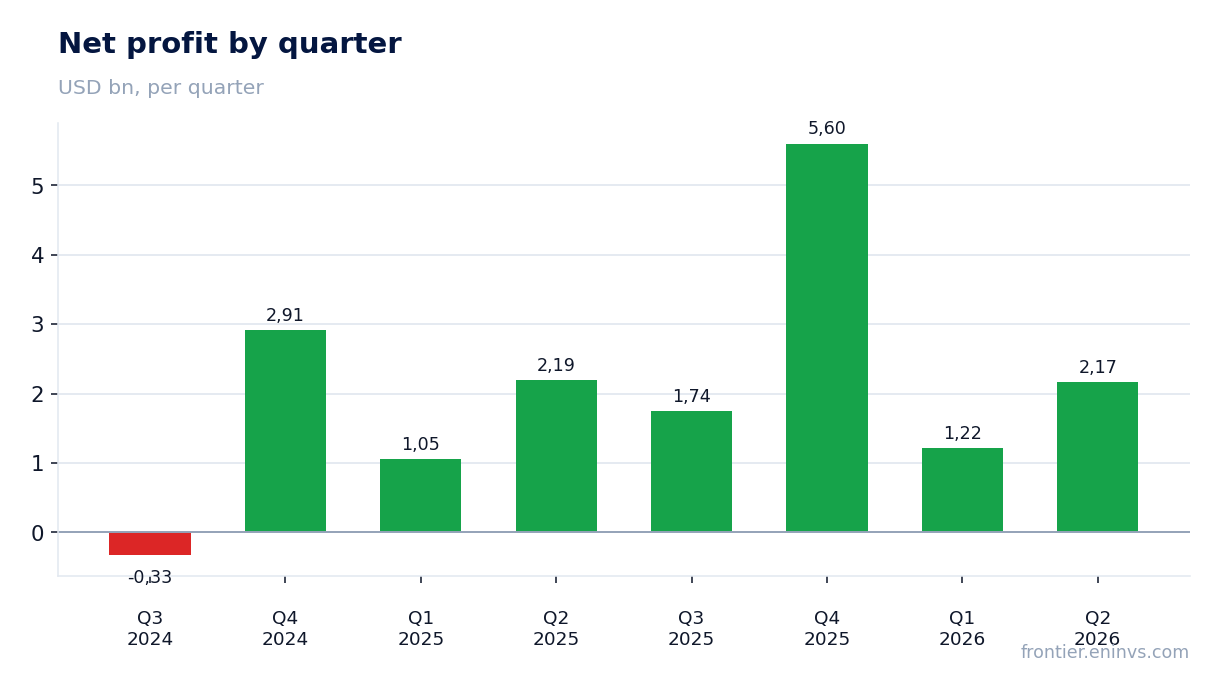
However, net profit fell 1.3% to $2,165 million, and net margin contracted from 12.9% to 12.6%. Higher interest expenses and likely tax effects weighed. As a result, EBITDA growth did not translate into EPS growth: GAAP EPS fell 2% to $2.27, while operating (non-GAAP) EPS rose 5% to $2.93.
Free cash flow for H1 was $4.8 billion, covering dividends, but debt rose
In H1 2026, net cash from operating activities was $7.8 billion, and free cash flow was $4.8 billion (after capital expenditures of $743 million and changes in financing receivables). This is sufficient to cover dividends, which over the last 12 months correspond to a yield of 2.9%.
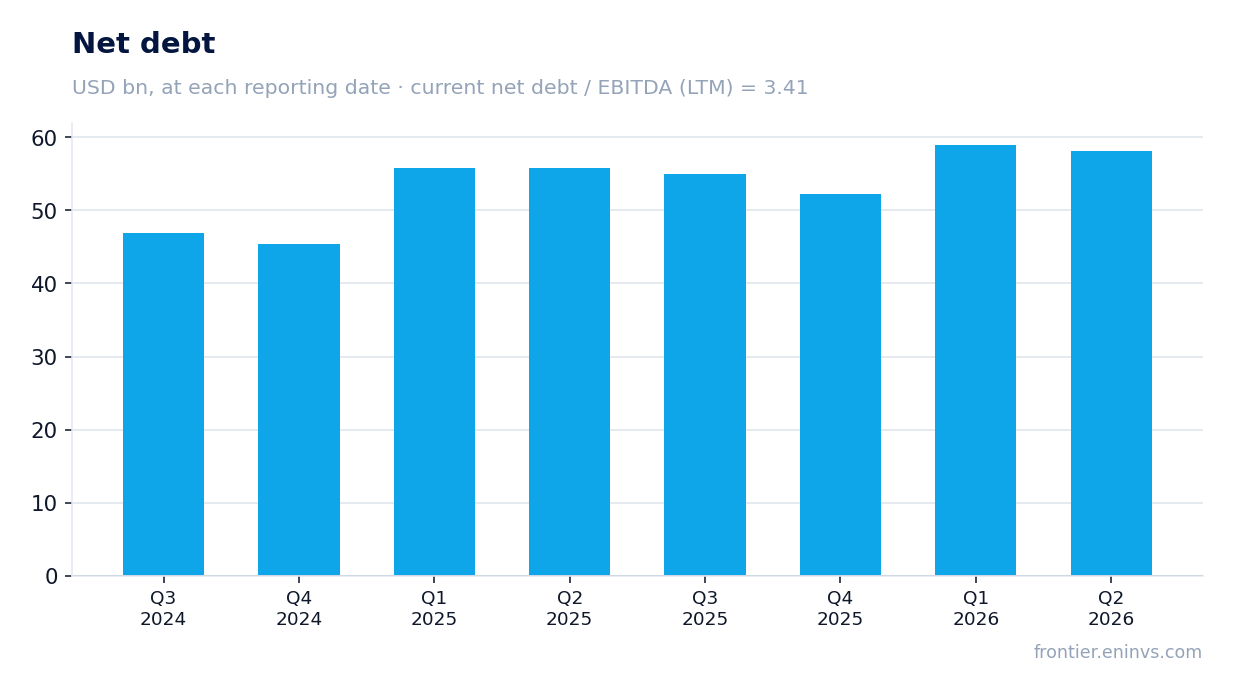
At the same time, net debt rose by $2.3 billion over the last 12 months to $58.1 billion at the end of Q2. Net debt to EBITDA for the last 12 months stands at 3.41, reflecting high leverage, although the company continues to generate stable operating cash flow.
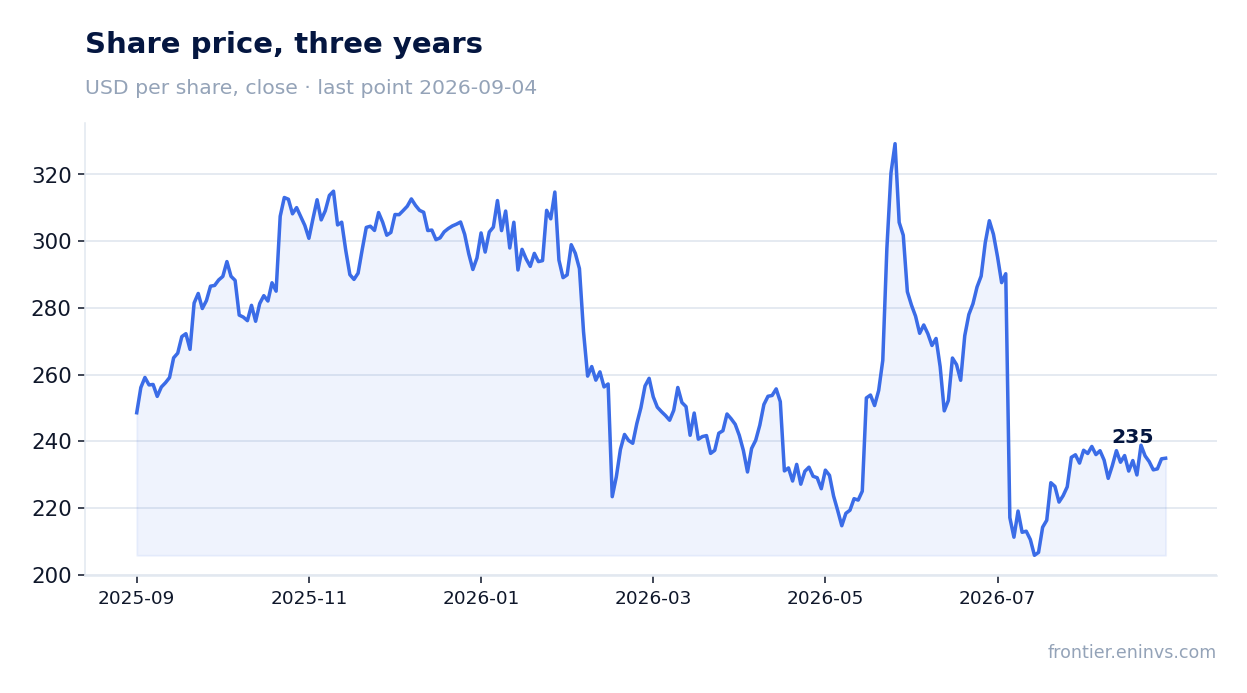
Shares fell 25.2% on release day and another 19.1% by September 4 – market punished the unexpected miss
The closing price before the release was $290.23, but shares plunged 25.2% on the release day. By September 4, they lost another 19.1% from the post-release level. Such a sharp reaction reflects the surprise of the miss: the company itself admitted it 'did not adapt and move quickly enough,' and numerous large deals failed to close on expected timelines.
Market capitalization now stands at $222,840 million, which after the fall corresponds to an EV/EBITDA multiple of 17.96 – below its own three-year average of 20.49. However, P/E on trailing twelve-month profit is 20.78, which does not look cheap, especially given slowing growth.
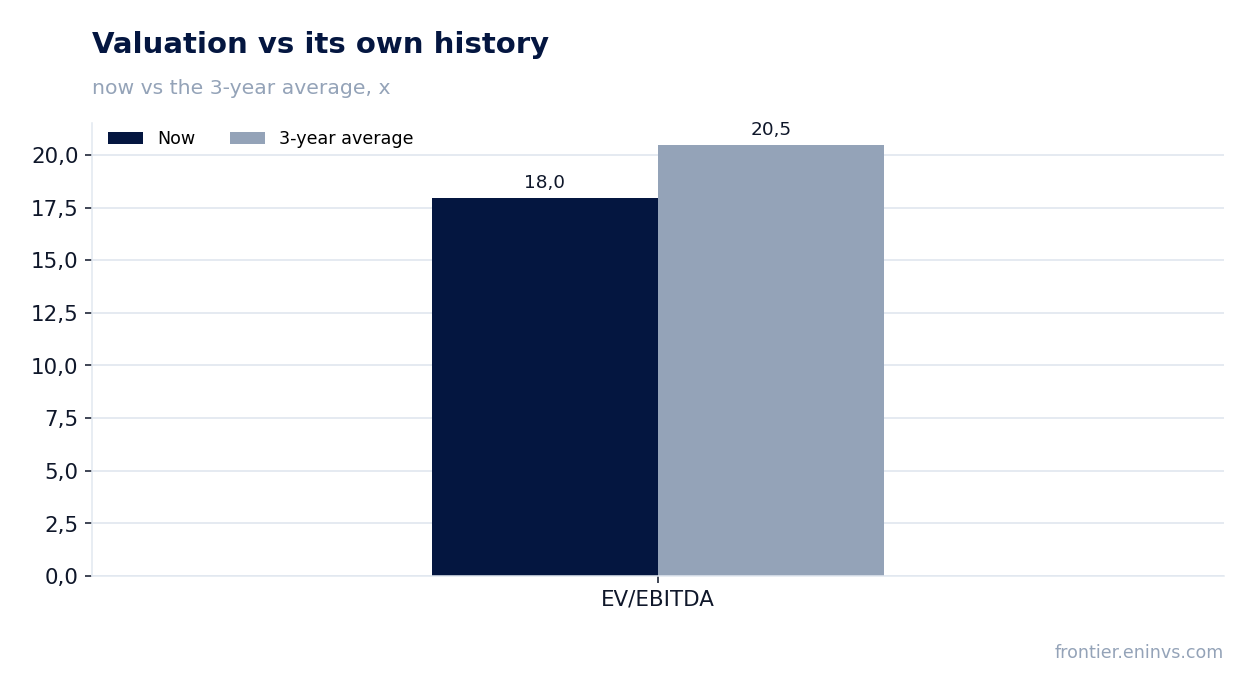
EV/EBITDA of 17.96 is below its own three-year average of 20.49, but P/E of 20.78 remains high
After the share price fall, EV/EBITDA on LTM is 17.96, about 12% below the three-year average (20.49). This suggests the market has already priced in deteriorating prospects. However, P/E on LTM profit is 20.78, which is not low for a company with revenue growth of around 1%.
ROE is 25.7%, reflecting high capital efficiency, but a significant portion of profit goes to debt service. The dividend yield of 2.9% looks moderate, but it is backed by free cash flow.
Company announced major investments in quantum computing and Lightwell, requiring additional spending
In the letter to shareholders, the CEO announced Lightwell – a $5 billion initiative to create a trusted enterprise clearinghouse for open-source software vulnerabilities, with over 20,000 engineers. Also announced plans to invest more than $10 billion in quantum computing over five years, including building the world's first pure-play quantum wafer foundry with CHIPS support.
These investments will require significant capital expenditures and R&D spending, which could limit free cash flow growth in the coming years. The company reaffirmed its plan to deliver the first large-scale fault-tolerant quantum computer by 2029, but this does not yet generate revenue.
Valuation on the latest reported figures
| Metric | Value |
|---|---|
| Market cap | 223 bn USD |
| P/E (LTM) | 20.8 |
| EV/EBITDA (LTM) | 18.0 |
| P/B | 6.83 |
| Net debt / EBITDA (LTM) | 3.41 |
| Operating cash flow (LTM) | 13.2 bn |
| ROE | 25.7% |
| Dividend yield (12m) | 2.9% |
| EV/EBITDA, 3-year average | 20.5 |
Bottom line
Сильными сторонами отчёта остаются рост EBITDA на 24,3% благодаря операционной эффективности и ускорение Red Hat до 11%, а также стабильный свободный денежный поток в 4,8 млрд долл. за полугодие. Однако провал в Infrastructure и слабость Consulting привели к минимальному росту выручки, а чистая прибыль снизилась. Акции упали на 25,2% в день релиза, и теперь EV/EBITDA в 17,96 ниже собственного трёхлетнего среднего, что делает оценку более привлекательной. Тем не менее, P/E в 20,78 и высокий долг оставляют риски. Вердикт – скорее привлекательно: при текущей цене заложено значительное разочарование, но для подтверждения потребуется восстановление темпов роста выручки.
Open the company's financial profile IBM →
See also: market overview · valuation map · stock screeners