JOHNSON & JOHNSON: revenue grows, but net profit stalls – what ate the growth

15 июля JOHNSON & JOHNSON раскрыла результаты за второй квартал 2026 года. Выручка выросла на 6,6% до 25 310 млн долл., EBITDA – на 6,6%, но чистая прибыль практически не изменилась (-0,1%). При текущей цене акция выглядит скорее привлекательно: рост выручки ускоряется, а мультипликатор EV/EBITDA 20,7 всё ещё выше собственного трёхлетнего среднего 15,0, но модель портала даёт потенциал +8%.
Key takeaways
— JOHNSON & JOHNSON's Q2 revenue grew 6.6% to $25,310 million, with Innovative Medicine up 7.8% and MedTech up 4.5%
— EBITDA margin held at 35.5%, but net margin fell from 23.3% to 21.9% due to higher other expenses and effective tax rate
— Net profit was nearly flat: growth in operating profit was offset by higher taxes and other expenses
— Leverage remains moderate: net debt / EBITDA LTM is 0.85, and net debt declined by $16.0 billion over the quarter
— Shares fell 2.7% on the release day but gained 8.4% by September 4
— The portal's model implies +8% upside from the current price
Attractiveness
Key figures, USD bn
| Metric | Q2 2025 | Q2 2026 | Change |
|---|---|---|---|
| Revenue | 23.7 | 25.3 | +6.6% |
| EBITDA | 8.43 | 8.99 | +6.6% |
| Operating profit | 6.49 | 7.17 | +10.5% |
| Net profit | 5.54 | 5.53 | -0.1% |
| Operating cash flow | 3.88 | 8.62 | +122.2% |
| Capex | 1.04 | 1.32 | +26.7% |
| EBITDA margin | 35.5% | 35.5% | +0.0 pp |
| Net margin | 23.3% | 21.9% | -1.4 pp |
JOHNSON & JOHNSON's Q2 revenue grew 6.6% to $25,310 million, with Innovative Medicine up 7.8% and MedTech up 4.5%
In Q2 2026, JOHNSON & JOHNSON's sales reached $25,310 million, up 6.6% from the same period last year. The main driver was the Innovative Medicine segment, with revenue up 7.8% to $16,384 million, while MedTech grew a modest 4.5% to $8,926 million.
Within Innovative Medicine, oncology drugs showed particularly strong dynamics: DARZALEX grew 18.9%, CARVYKTI 49.4%, and TECVAYLI 56.5%. In contrast, immunology declined 3.7% due to STELARA's loss of exclusivity, with sales down 55.2%.
In MedTech, orthopaedics (+4.9%) and cardiovascular (+4.0%) contributed the most, while surgery grew only 3.9%. Geographically, U.S. sales rose 7.3%, and international sales 5.7%.
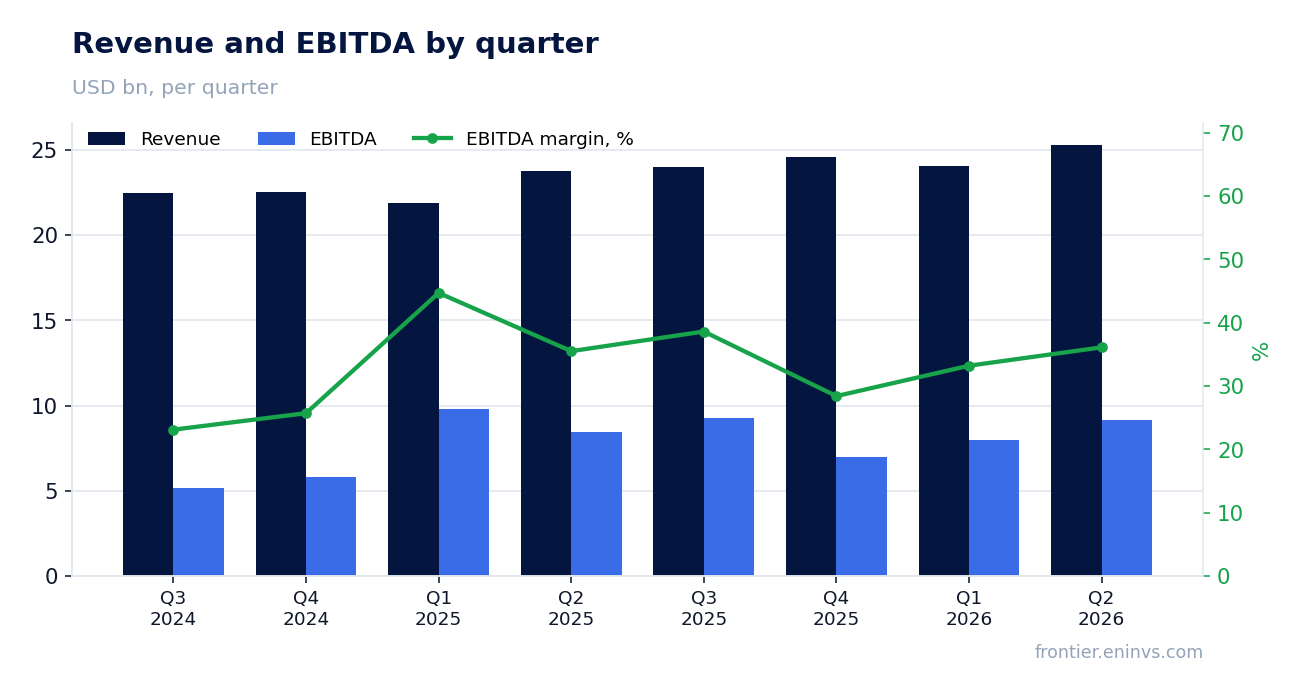
EBITDA margin held at 35.5%, but net margin fell from 23.3% to 21.9% due to higher other expenses and effective tax rate
EBITDA margin in Q2 remained at 35.5%, matching the year-ago figure. However, net margin fell from 23.3% to 21.9%.
The main reasons are higher other expenses (net) from $107 million to $331 million, and a higher effective tax rate from 14.7% to 18.0%. In addition, selling, marketing and administrative expenses rose 9.2%, outpacing revenue growth.
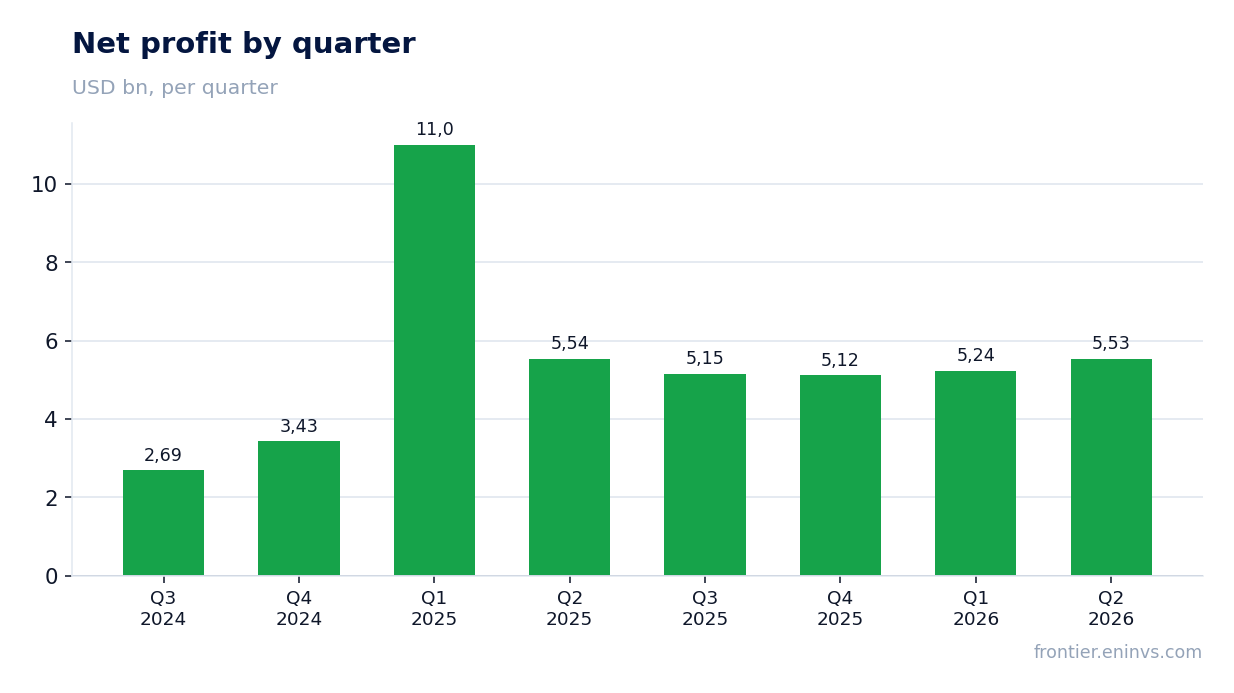
Net profit was nearly flat: growth in operating profit was offset by higher taxes and other expenses
Net profit in Q2 was $5,534 million, only 0.1% below last year's level. Operating profit rose from $6,491 million to $7,174 million, but this growth was fully absorbed by higher taxes (from $954 million to $1,213 million) and other expenses.
Adjusted net profit (non-GAAP) grew 5.7% to $7,081 million, indicating that one-off items, including restructuring and litigation costs, weighed on reported figures.
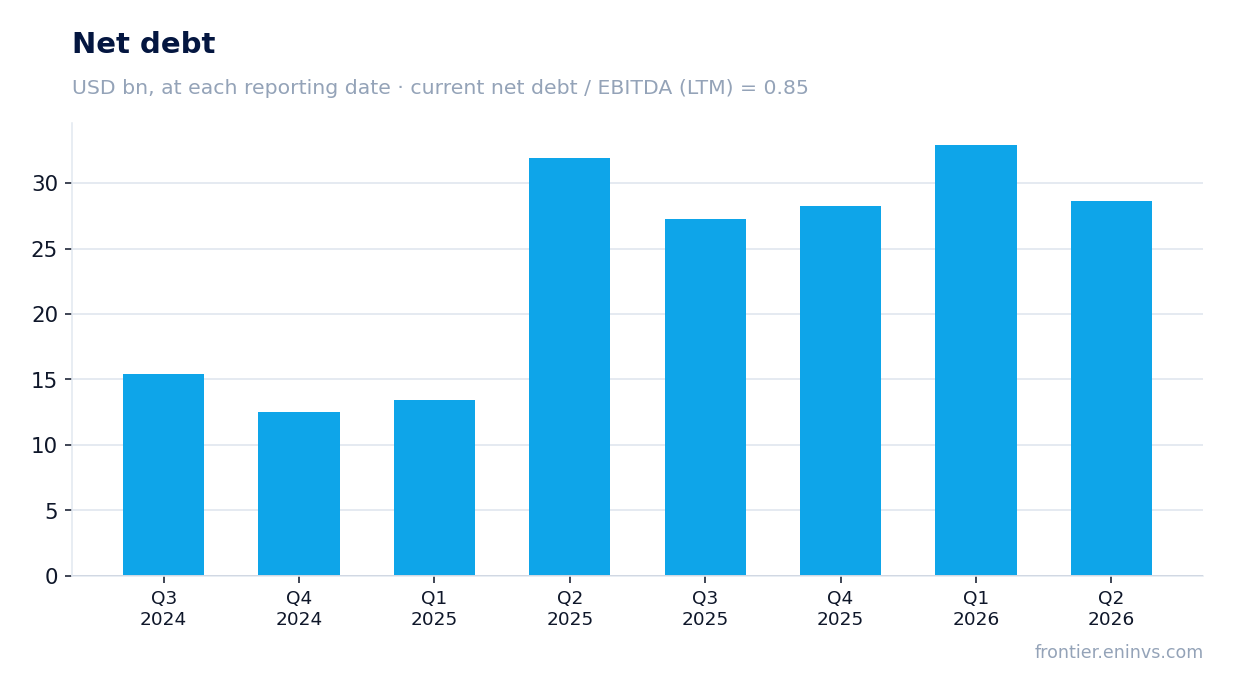
Leverage remains moderate: net debt / EBITDA LTM is 0.85, and net debt declined by $16.0 billion over the quarter
At the end of Q2, JOHNSON & JOHNSON's net debt stood at $28,229 million, down $16.0 billion from the previous reporting date. Net debt / EBITDA LTM is 0.85, indicating a conservative debt policy.
Operating cash flow for the quarter reached $8,616 million, which funded capital expenditures of $1,321 million and continued debt reduction.
Shares fell 2.7% on the release day but gained 8.4% by September 4
The closing price before the release was $253.85. On the release day, shares fell 2.7%, likely due to disappointing net profit dynamics. However, by September 4, quotes recovered and rose 8.4% from the release-day level.
The company's market capitalization is $662,737 million, and the trailing twelve-month dividend yield is 1.97%.
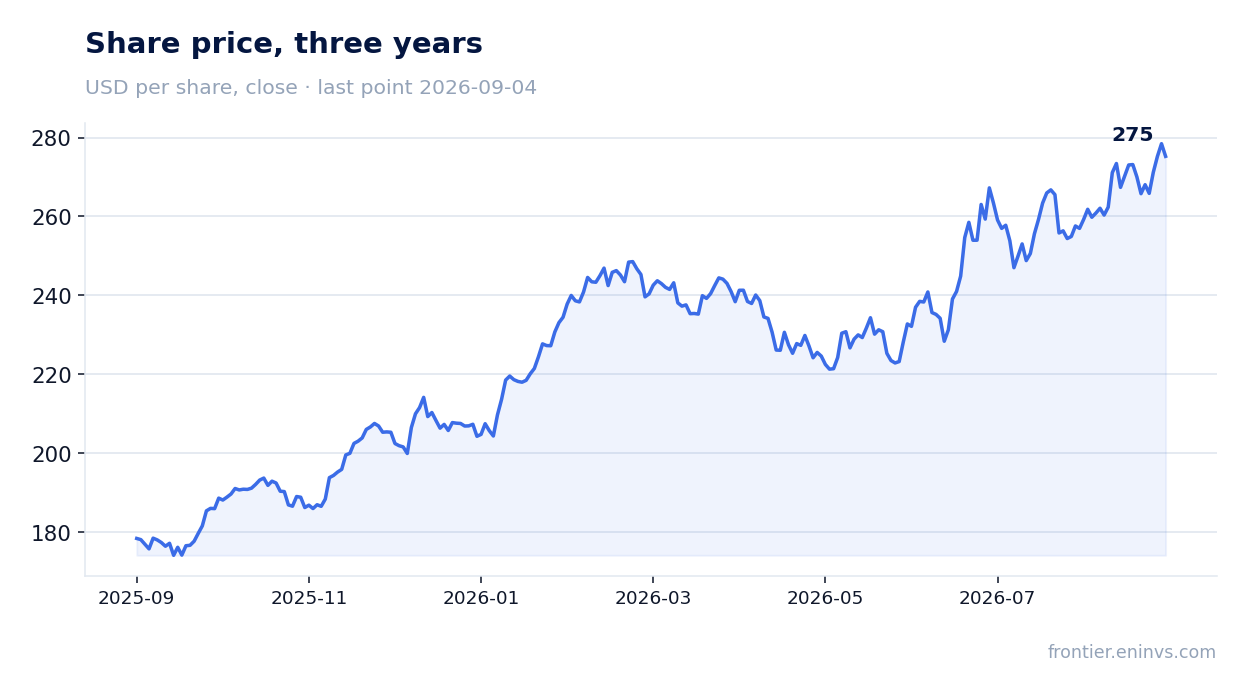
The portal's model implies +8% upside from the current price
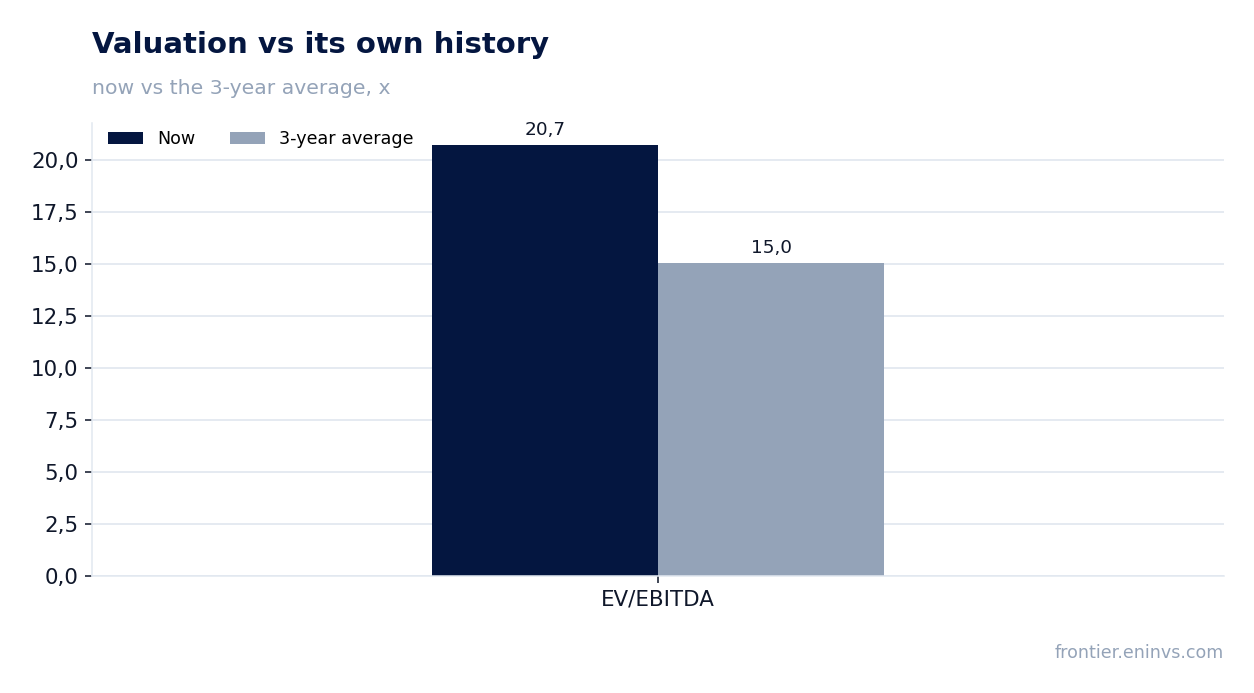
According to the portal's model, based on EBITDA growth and target multiple, the upside potential is +8% from the current price. This is moderately positive, given that the current EV/EBITDA LTM (20.7) is well above the three-year average (15.0).
P/E LTM is 31.5, also implying a premium to historical levels. Nevertheless, sustained revenue growth and strong cash flow support the valuation.
Valuation on the latest reported figures
| Metric | Value |
|---|---|
| Market cap | 663 bn USD |
| P/E (LTM) | 31.5 |
| EV/EBITDA (LTM) | 20.7 |
| P/B | 8.13 |
| Net debt / EBITDA (LTM) | 0.85 |
| Operating cash flow (LTM) | 24.5 bn |
| ROE | 26.6% |
| Dividend yield (12m) | 2.0% |
| EV/EBITDA, 3-year average | 15.0 |
Bottom line
In Q2, JOHNSON & JOHNSON showed solid revenue growth of 6.6%, driven by strong oncology drugs, but net profit was flat due to one-off items and taxes. Leverage is low, cash flow is strong, allowing the company to fund dividends and reduce debt. However, the current valuation is notably above its own history, and the portal's model implies only moderate upside of +8%. Given this, the share looks rather attractive for a long-term investor, but without compelling undervaluation.
Open the company's financial profile JNJ →
See also: market overview · valuation map · stock screeners