LAM RESEARCH CORP: record quarter and record valuation — the market paid for 2026 in advance

29 июля LAM RESEARCH CORP раскрыла результаты за квартал, закончившийся 28 июня 2026 года. Выручка выросла на 15,1% к предыдущему кварталу до 6,72 млрд долл., операционная маржа достигла рекордных 37,4%, а разводнённая прибыль на акцию — 1,81 долл. Однако в годовом сопоставлении квартал слабее: выручка упала на 13,0%, чистая прибыль — на 41,9%. Акции после выхода отчёта подешевели на 6,4%, но к 4 сентября отыграли рост на 14,1%. При текущей цене бумага выглядит скорее непривлекательно: мультипликатор EV/EBITDA в 2,7 раза выше собственного трёхлетнего среднего, а модель портала оценивает потенциал снижения в 14%.
Key takeaways
— Quarterly revenue rose 15.1% sequentially but fell 13.0% year over year — the first decline in five quarters
— Operating margin hit a record 37.4% thanks to gross margin expansion to 51.7%
— Quarterly net income was $2.28 billion, but down 41.9% year over year due to lower revenue and higher taxes
— The company maintains a net cash position: debt is minimal and cash rose to $5.60 billion
— Capital expenditures were $189 million in the quarter, well below operating cash flow of $1.46 billion
— EV/EBITDA stands at 54.6 versus a three-year average of 19.9 — valuation is 2.7 times its own history
— The portal's model implies a 14% downside to the current price
Attractiveness
Key figures, USD bn
| Metric | Q4 2025 | Q4 2026 | Change |
|---|---|---|---|
| Revenue | 5.17 | 4.50 | -13.0% |
| EBITDA | 1.84 | 1.32 | -28.3% |
| Operating profit | 1.74 | 1.20 | -31.1% |
| Net profit | 1.72 | 1.00 | -41.9% |
| Operating cash flow | 2.55 | 1.46 | -42.9% |
| Capex | 0.17 | 0.19 | +9.6% |
| EBITDA margin | 35.6% | 29.3% | -6.3 pp |
| Net margin | 33.3% | 22.2% | -11.1 pp |
Quarterly revenue rose 15.1% sequentially but fell 13.0% year over year — the first decline in five quarters
In the quarter ended June 28, 2026, LAM RESEARCH CORP reported revenue of $6.72 billion, up 15.1% sequentially from $5.84 billion. However, year over year revenue declined 13.0% — the first drop after five quarters of growth ranging from +22.1% to +33.6%.
The sequential increase was driven mainly by systems revenue, which rose from $3.73 billion in the March quarter to $4.25 billion in the June quarter. Customer support-related and other revenue also grew, from $2.11 billion to $2.47 billion. Geographically, Taiwan (27% of revenue), China (26%), and Korea (20%) remained the largest markets.
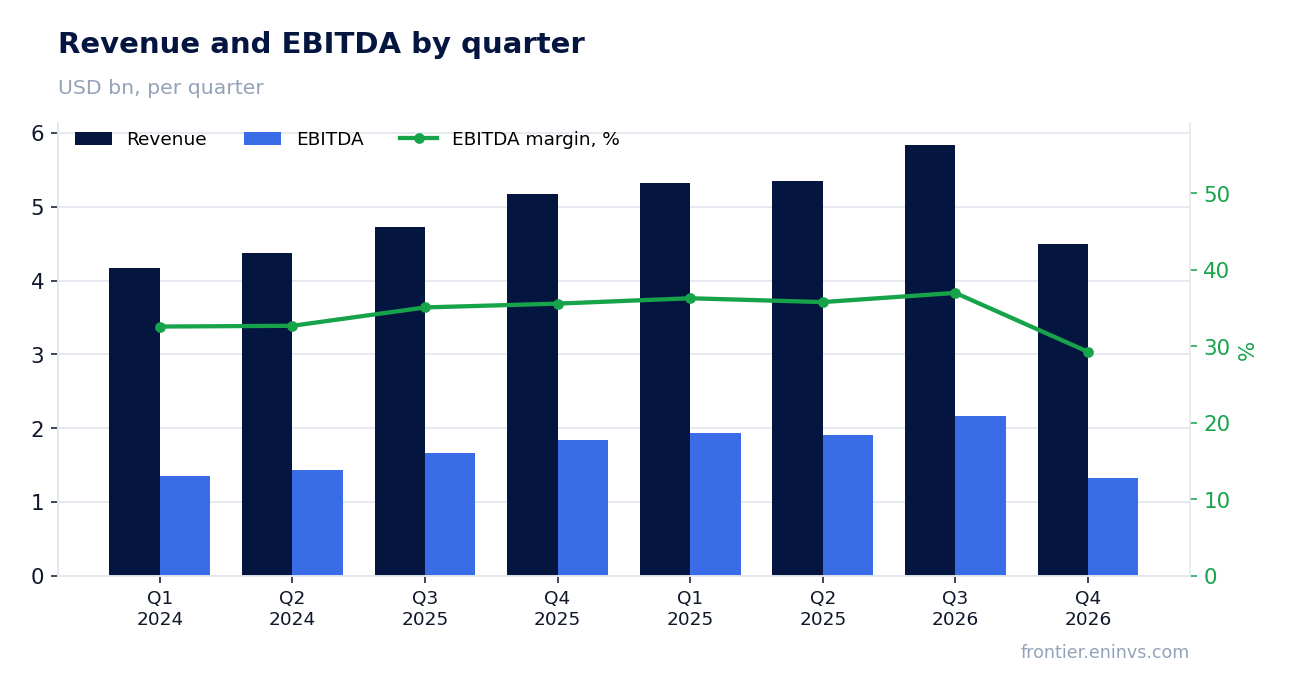
Operating margin hit a record 37.4% thanks to gross margin expansion to 51.7%
Gross margin in the reported quarter was 51.7%, up 190 basis points from 49.8% in the prior quarter. Operating margin reached 37.4% versus 35.0% a quarter earlier. The improvement came from both higher gross profitability and operating leverage: operating expenses rose only 11.8% while revenue grew 15.1%.
On a non-GAAP basis, operating margin was even higher at 38.4%. The company attributes the improvement to higher volumes, revenue mix, and cost control. Record margin is a key positive signal for shareholders, especially against the backdrop of a year-over-year revenue decline.
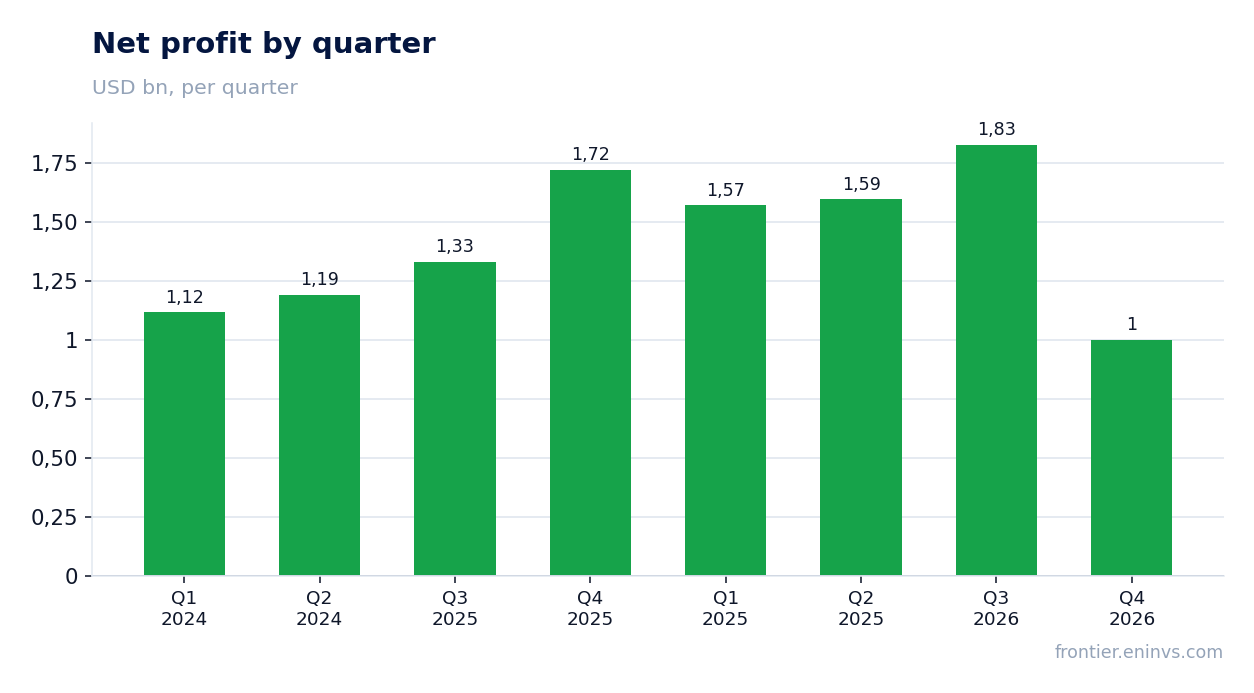
Quarterly net income was $2.28 billion, but down 41.9% year over year due to lower revenue and higher taxes
US GAAP net income for the quarter was $2.28 billion, or $1.81 per diluted share. In the prior quarter it was $1.83 billion ($1.45 per share). However, year over year net income fell 41.9%: a year ago it was $1.72 billion, but then revenue was 13% higher and the effective tax rate was significantly lower.
The higher tax burden is notable: income tax expense was $277.9 million in the reported quarter versus $58.9 million a year earlier. Even with revenue growth sequentially, net margin declined to 22.2% from 33.3% a year ago. The report also includes non-cash items such as revaluation of deferred compensation assets and liabilities, which add volatility to quarterly earnings.
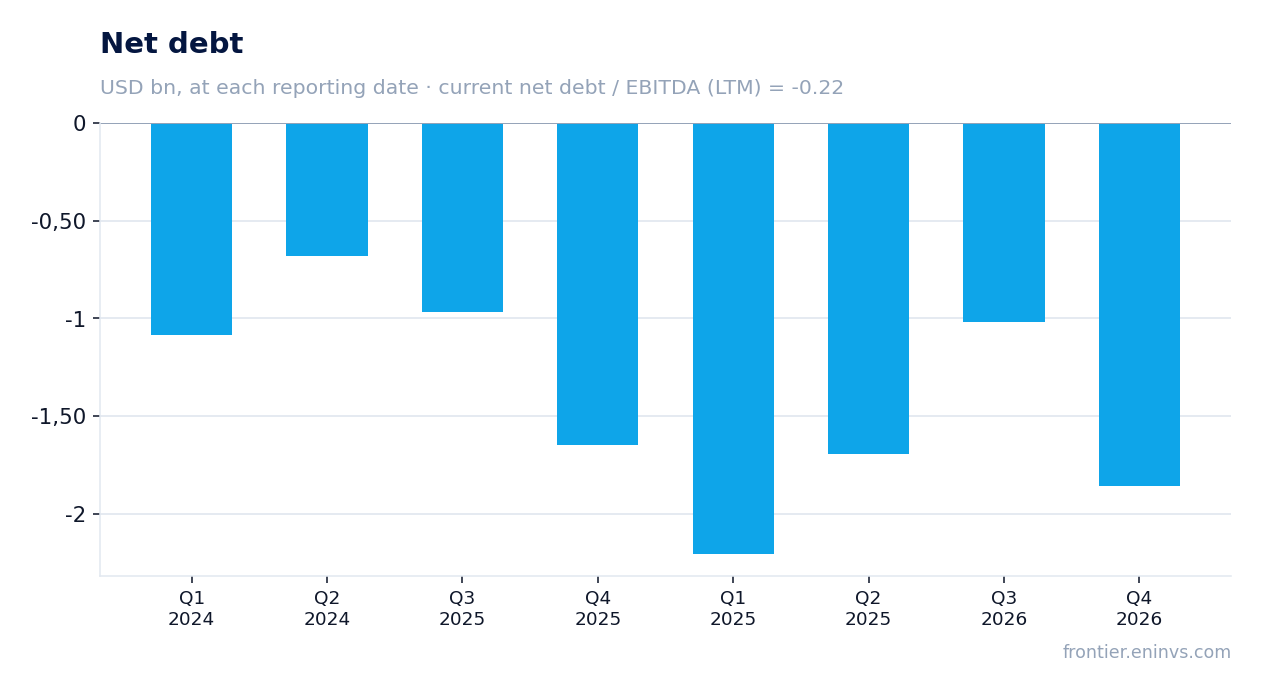
The company maintains a net cash position: debt is minimal and cash rose to $5.60 billion
At the end of June 2026, cash and cash equivalents stood at $5.60 billion, up from $4.77 billion at the end of March. Long-term debt and finance lease obligations were $3.73 billion, resulting in a net cash position. Net debt is negative: -$1.65 billion, and the net debt to EBITDA ratio for the trailing twelve months is -0.22.
The increase in cash was driven by operating cash flow of $1.46 billion in the quarter, which was only partially offset by share repurchases ($246.6 million) and dividends ($325.3 million). The company continues to return capital to shareholders while maintaining financial flexibility.
Capital expenditures were $189 million in the quarter, well below operating cash flow of $1.46 billion
Operating cash flow for the quarter reached $1.46 billion, while capital expenditures were only $188.8 million. Free cash flow thus exceeded $1.2 billion for the quarter. This is a high conversion of earnings into cash, especially given the sequential revenue growth.
Low capital expenditures relative to operating cash flow are typical for a semiconductor equipment maker: the main investments go into R&D rather than fixed assets. Over the trailing twelve months, capex was $966.4 million against operating cash flow of $5.86 billion. This allows the company to fund generous buybacks and dividends without increasing debt.
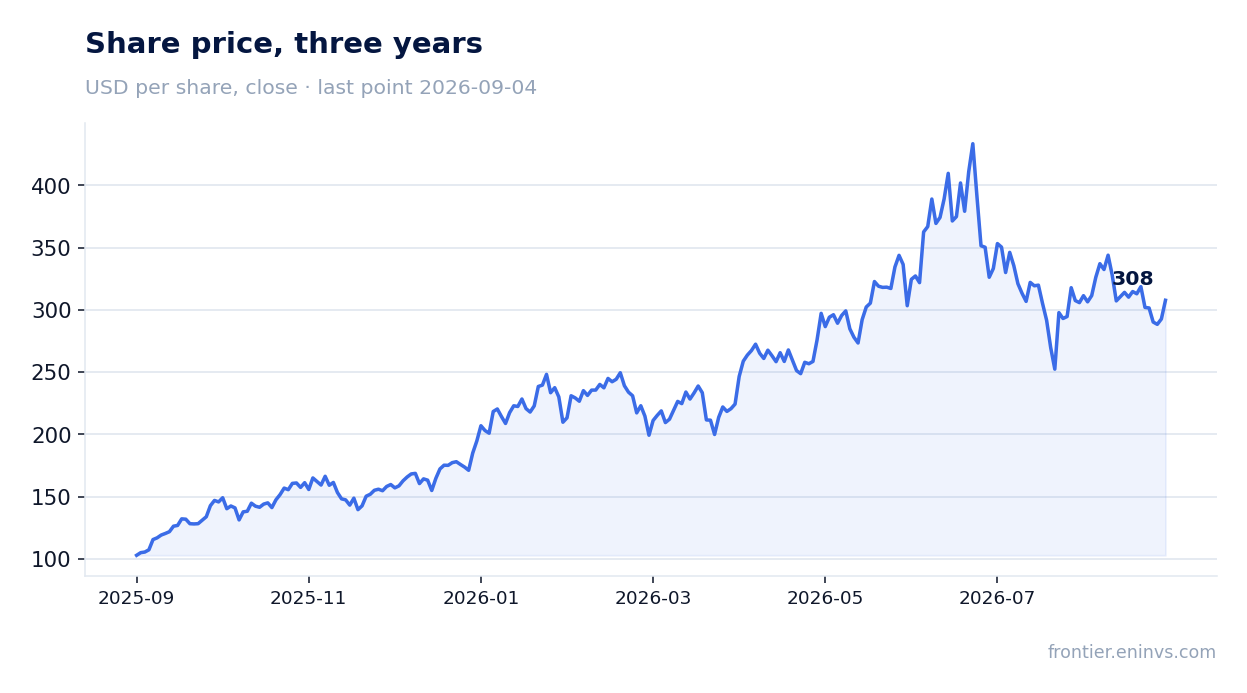
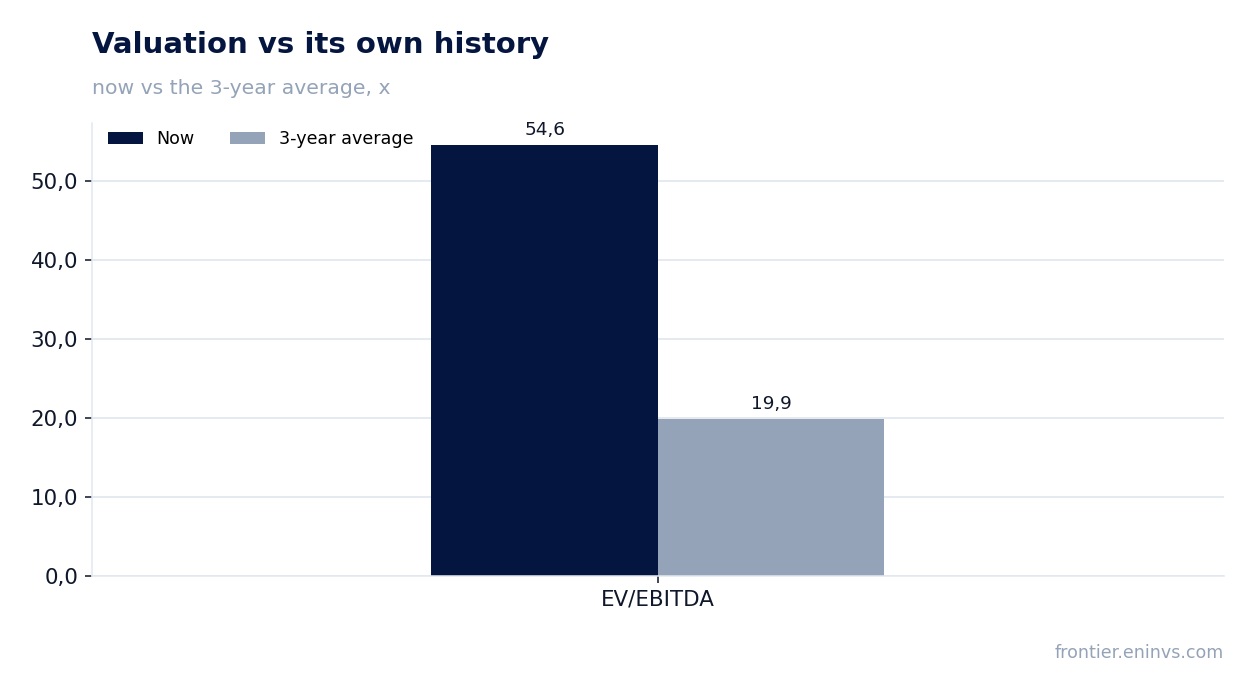
EV/EBITDA stands at 54.6 versus a three-year average of 19.9 — valuation is 2.7 times its own history
LAM RESEARCH CORP's market capitalization reached $401.6 billion, which, with EBITDA of $7.33 billion over the trailing twelve months, gives an EV/EBITDA of 54.6. This is 2.7 times higher than the three-year average of 19.9. Even with record margins, such a valuation implies that the market is pricing in continued hyper-growth in EBITDA.
P/E over the trailing twelve months is 67.1 — also significantly above historical levels. The trailing twelve-month dividend yield is only 0.32%, making the stock unattractive for income-oriented investors. The portal's model, based on EBITDA growth and a target multiple, implies a -14% downside to the current price.
The portal's model implies a 14% downside to the current price
According to the portal's fundamental value-creation model, the fair value of the share is 14% below the current market price. The model is based on EBITDA growth times a target multiple, compared with market capitalization. This is not a consensus forecast or a target price, but an internal estimate of the portal.
The share is currently held in our live model strategies 'US Tech / AI leaders', reflecting its fit with those strategies' screens, but this is not an argument for buying or selling. The current price already embeds optimistic growth expectations, and even a slight disappointment in the coming quarters could trigger a correction.
Valuation on the latest reported figures
| Metric | Value |
|---|---|
| Market cap | 402 bn USD |
| P/E (LTM) | 67.1 |
| EV/EBITDA (LTM) | 54.6 |
| P/B | 40.72 |
| Net debt / EBITDA (LTM) | -0.22 |
| Operating cash flow (LTM) | 5.90 bn |
| ROE | 34.7% |
| Dividend yield (12m) | 0.3% |
| EV/EBITDA, 3-year average | 19.9 |
Bottom line
The quarter was strong operationally: record margins, high free cash flow, and a net cash position. However, year-over-year revenue and profit dynamics are negative, and the stock's valuation is at extreme levels relative to its own history. With EV/EBITDA of 54.6 versus an average of 19.9 and a 14% downside per the portal's model, the share looks rather unattractive. A change in the verdict would require either a sustained recovery in revenue growth or a significant price decline.
Open the company's financial profile LRCX →
See also: market overview · valuation map · stock screeners