MICRON TECHNOLOGY INC: revenue grew 4.8x, and $33bn of $44bn operating cash flow was left as free cash
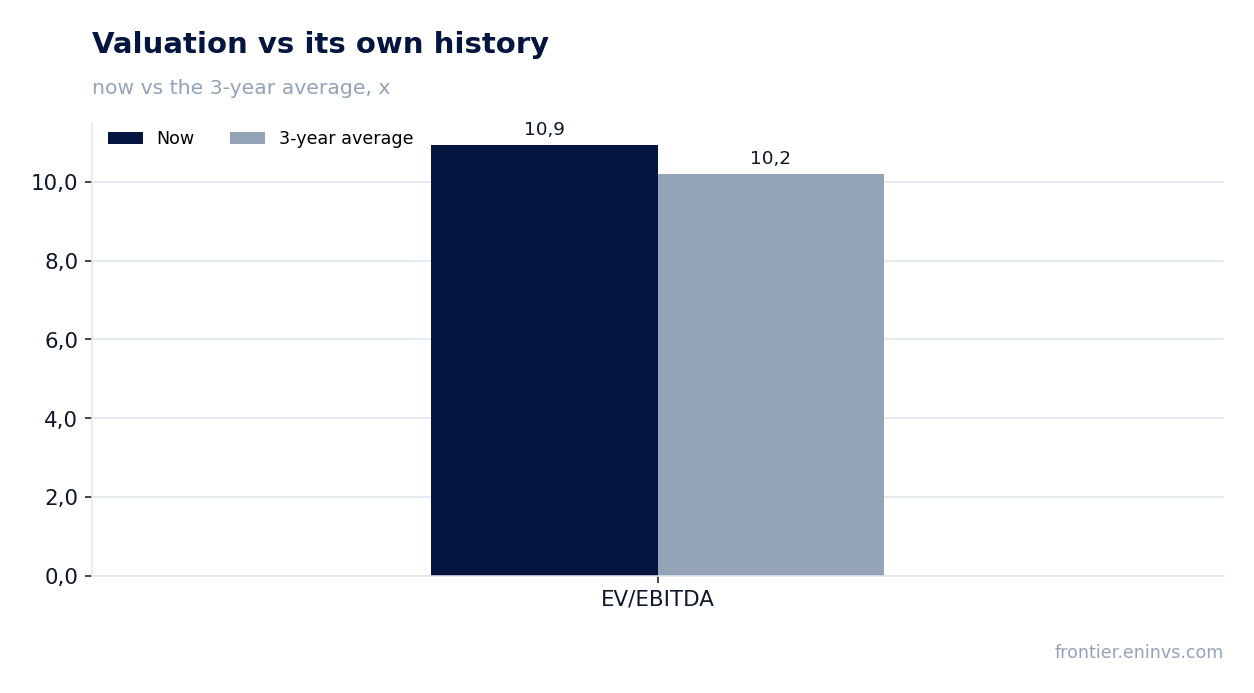
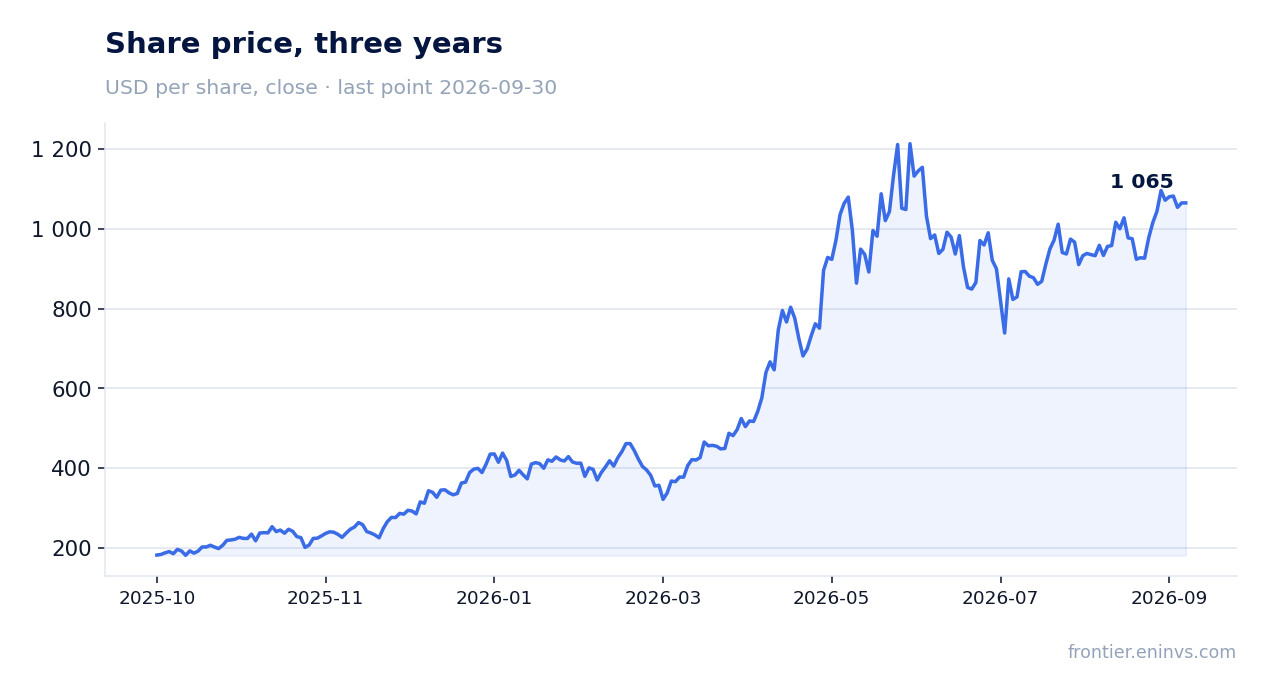
On September 30, MICRON TECHNOLOGY INC released results for the fourth quarter of fiscal 2026. Revenue came in at $54,229 million versus $11,315 million a year earlier, net income at $37,701 million, and operating cash flow at $43,973 million. Year-on-year revenue growth accelerated to 379.3% from 345.7% in the prior quarter, but free cash flow after $11,110 million of capital expenditure came to $33,199 million, and customers paid $12.9bn in advance. At a share price of $1,065.08 the stock looks attractive: EV/EBITDA on LTM including the new quarter is 10.4 including the new quarter against a three-year average of 10.2; the portal's model puts the upside to fair value at +91%.
Key takeaways
— Revenue grew 4.8x, and almost all of the increase came from the Core Data Center segment
— Gross margin of 86.8% is a record, but it is held up by the memory shortage, not by one-off savings
— Of the $37.7 billion profit, $500 million was one-off patent licence charges
— Operating cash flow of $43.97bn: $33.2bn of free cash after capex, $12.9bn came in as customer prepayments
— Capital expenditure of $11.11 billion is 20.5% of revenue, and it is rising
— The dividend of $0.15 per share is symbolic, yielding 0.05%
— EV/EBITDA of 10.4 versus a three-year average of 10.2 – the market is already pricing in growth
Attractiveness
Key figures, USD bn
| Metric | Q3 2025 | Q3 2026 | Change |
|---|---|---|---|
| Revenue | 11.3 | 54.2 | +379.3% |
| EBITDA | 5.80 | 46.4 | +699.4% |
| Operating profit | 3.65 | 43.8 | +1097.3% |
| Net profit | 3.20 | 37.7 | +1077.8% |
| Operating cash flow | 5.73 | 44.0 | +667.4% |
| Capex | 5.66 | 11.1 | +96.4% |
| EBITDA margin | 51.3% | 85.5% | +34.2 pp |
| Net margin | 28.3% | 69.5% | +41.2 pp |
Revenue grew 4.8x, and almost all of the increase came from the Core Data Center segment
Revenue for the fourth quarter of fiscal 2026 was $54,229 million, 4.8 times the $11,315 million a year earlier. Year-on-year growth accelerated: it was 345.7% in the third quarter and 379.3% now. This is the fastest growth in the entire history of the data provided.
The main contribution came from the Core Data Center segment: its revenue rose to $18,002 million from $1,577 million a year earlier. Cloud Memory brought in $16,283 million versus $4,543 million, Mobile and Client $13,114 million versus $3,760 million, and Automotive and Embedded $6,824 million versus $1,434 million. All four segments grew manifold, but Core Data Center and Cloud Memory together accounted for more than half of revenue.
The company attributes the growth to demand for artificial intelligence memory. The press release quotes CEO Sanjay Mehrotra saying that 'AI is becoming Super Intelligence' and that Micron is increasing investments in technology and manufacturing. This is supported by product announcements: server LPDDR SOCAMM revenue more than doubled sequentially, and SSD shipments for KV-cache applications began.
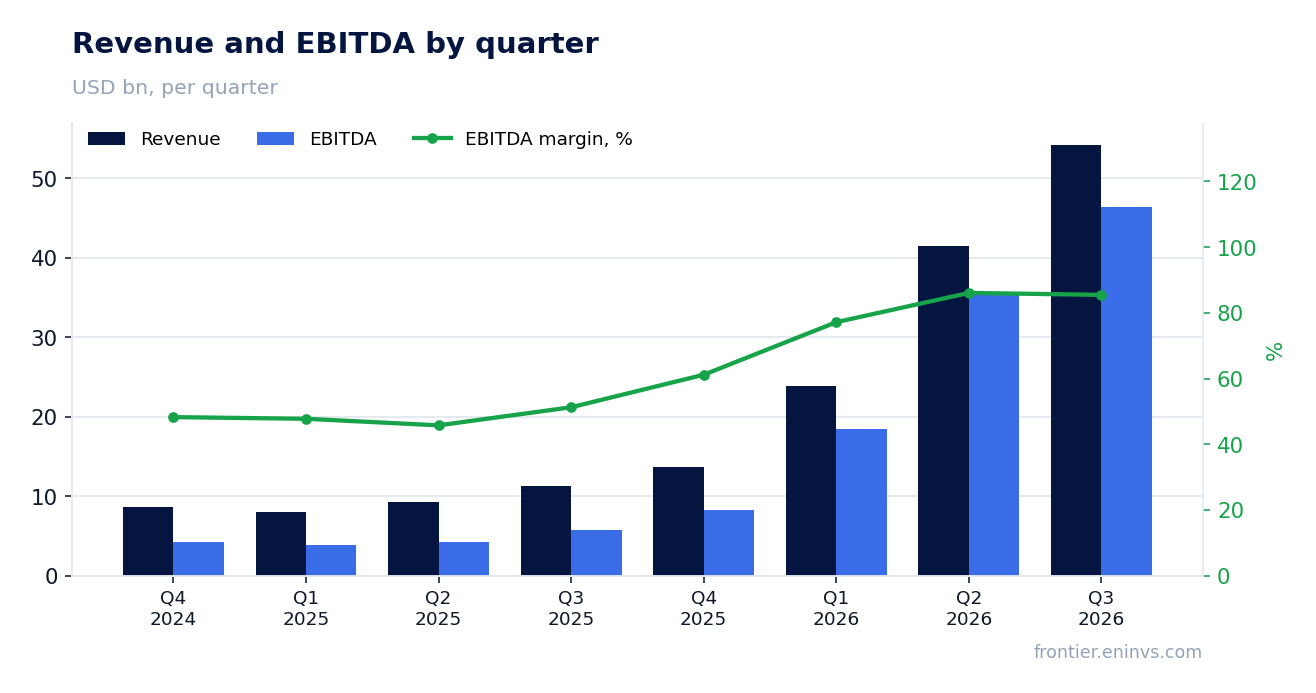
Gross margin of 86.8% is a record, but it is held up by the memory shortage, not by one-off savings
Gross margin in the fourth quarter reached 86.8% versus 44.7% a year earlier. This is a record level. Operating margin was 80.7% versus 32.3% a year earlier. Net margin was 69.5% versus 28.3%.
Such a margin increase is explained not by cost cuts but by pricing: revenue grew 4.8 times, while cost of goods sold rose only from $6,261 million to $7,182 million. That is, almost the entire revenue increase went into margin. This is typical of a memory shortage, when prices rise faster than costs.
Operating expenses rose to $3,296 million from $1,400 million a year earlier, but their share of revenue fell to 6.1% from 12.4%. The company increased research and development expenses to $1,913 million from $1,047 million, linked to new product development. However, the main effect came from gross margin.
Of the $37.7 billion profit, $500 million was one-off patent licence charges
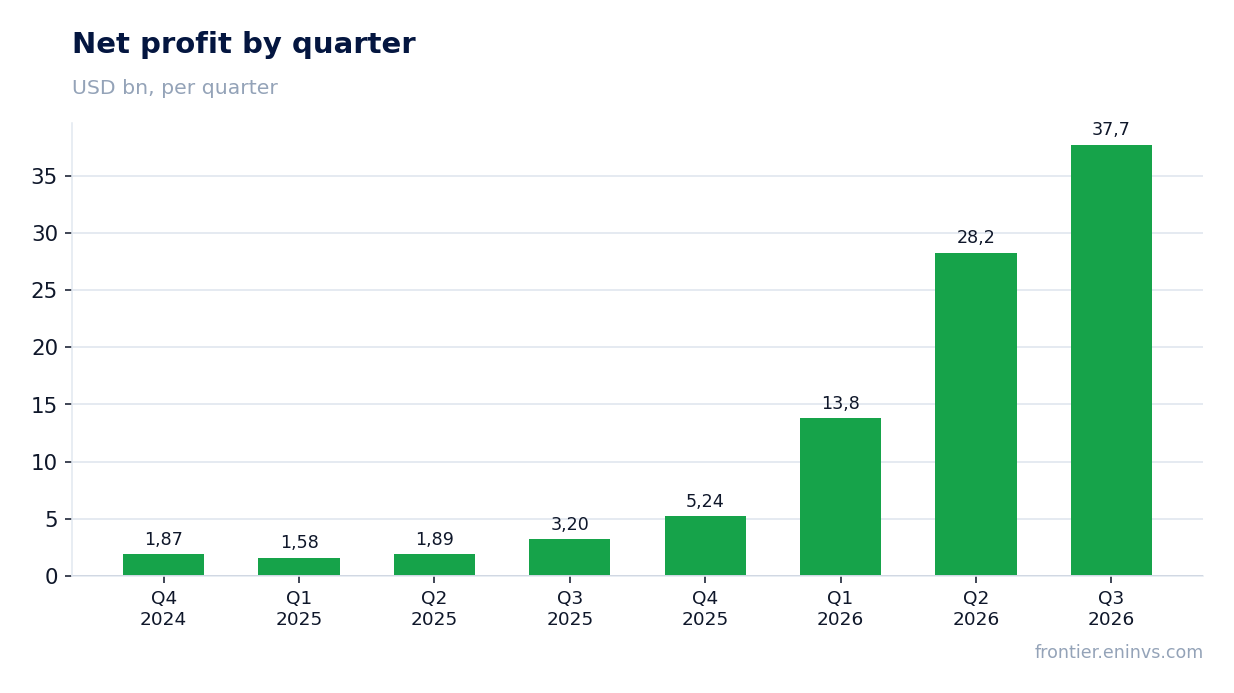
GAAP net income was $37,701 million, or $32.87 per diluted share, versus $3,201 million a year earlier. Year-on-year profit growth was 1077.8%. This is significantly faster than revenue growth, explained by operating leverage.
There are one-off items in the report. Patent licence charges amounted to $500 million, recorded in operating expenses and reducing profit. Without them, non-GAAP net income would have been $38,398 million, or $33.42 per share. There is also a loss on debt prepayments of $9 million.
Thus, one-off items are small relative to total profit – about 1.3%. The main contribution to profit growth came from operations, not one-off factors. This is important for assessing the sustainability of the result.
Operating cash flow of $43.97bn: $33.2bn of free cash, part of it customer prepayments
Operating cash flow in the fourth quarter was $43,973 million versus $5,730 million a year earlier. This is a strong result, but it does not fully convert into free cash. Capital expenditure was $11,110 million, and free cash flow after that is $33,199 million. This is still a lot, but less than operating cash flow.
However, a significant part of operating cash flow came in as customer prepayments. Customer contract liabilities rose to $12,895 million from $142 million a year earlier. These are prepayments from customers that the company received in advance. Inventories also rose to $10,372 million from $8,355 million, and receivables to $36,197 million from $9,265 million.
In other words, part of the cash flow is customer advances that will need to be worked off with shipments. This is not bad, but it shows that demand is so high that customers are willing to pay upfront. At the same time, growth in inventories and receivables is a diversion of funds.
Capital expenditure of $11.11 billion is 20.5% of revenue, and it is rising
Capital expenditure in the fourth quarter was $11,110 million, or 20.5% of revenue. A year earlier it was $5,658 million, so it nearly doubled. For the full fiscal year 2026, capital expenditure reached $30,712 million versus $15,857 million a year earlier.
The company is increasing investments in manufacturing to meet demand for AI memory. The press release mentions increased investments in technology, products and manufacturing. This means that capital expenditure will remain high in the coming quarters, which will limit free cash flow.
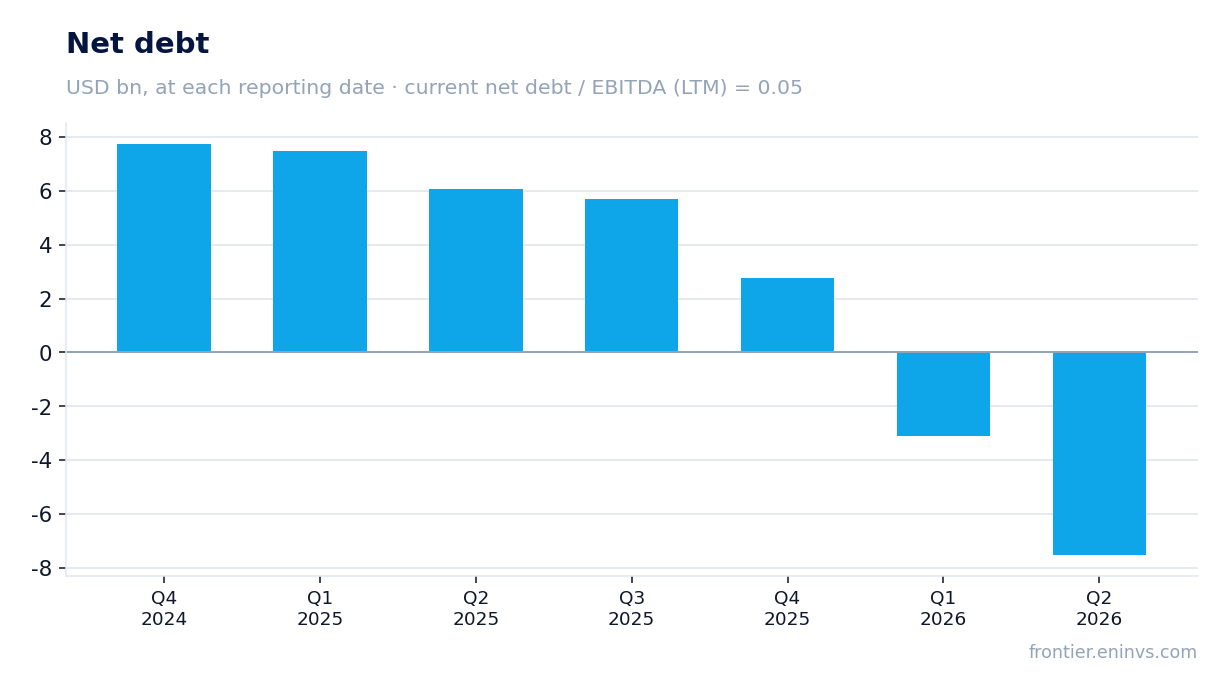
Despite this, free cash flow for the quarter was $33,199 million, and for the year $62,308 million. This allows financing dividends and share repurchases without raising debt. Debt burden is low: the net debt to EBITDA LTM ratio is 0.08.
The dividend of $0.15 per share is symbolic, yielding 0.05%
The board declared a quarterly dividend of $0.15 per share, payable on October 29, 2026. At a share price of $1,065.08, the trailing 12-month dividend yield is 0.05%. This is an extremely low level that plays no role for an investor.
The company pays dividends, but they are symbolic. For fiscal year 2026, $610 million was allocated to dividends, less than 1% of net income. The main return of capital comes through share repurchases: $650 million under the programme and $1,127 million for withholding on employee equity awards during the year.
For a dividend-oriented investor, this stock is not suitable. A yield of 0.05% is incomparable with the key rate. However, this is compensated by capital growth potential: the portal's model estimates fair value at 91% above the current price.
EV/EBITDA of 10.4 versus a three-year average of 10.2 – the market is already pricing in growth
Current valuation: EV/EBITDA LTM is 10.4, almost level with the three-year average of 10.2. P/E LTM is 14.1. The market values the company at $1,198,249 million (market capitalisation). The net debt to EBITDA LTM ratio is 0.08, meaning debt is virtually absent.
Such a high EV/EBITDA multiple is explained by expectations of further profit growth. The company provided guidance for the first quarter of fiscal 2027: revenue of $61.5 billion plus or minus $1.5 billion, gross margin around 86%, earnings per share of $37.84. This implies continued growth.
However, if growth slows, the multiple could compress towards its historical average. The portal's model, based on EBITDA growth and a target multiple, gives an upside to fair value of +91%. This is our own estimate, not a market consensus.
Valuation on the latest reported figures
| Metric | Value |
|---|---|
| Market cap | 1 198 bn USD |
| P/E (LTM) | 14.1 |
| EV/EBITDA (LTM) | 10.4 |
| P/B | 22.12 |
| Net debt / EBITDA (LTM) | -0.63 |
| Operating cash flow (LTM) | 89.7 bn |
| ROE | 126.1% |
| Dividend yield (12m) | 0.0% |
| EV/EBITDA, 3-year average | 10.2 |
Tracked metrics: value created 91% of market cap, upside at a normalised memory price +68% to +139%
Both metrics we have tracked the idea by since 11 September moved up after the report. Fundamental value created (EBITDA growth times the target multiple, against market cap) rose from 75% to 91% of market cap: quarterly EBITDA came in at $46.4bn against $35.7bn a quarter earlier.
Upside at a normalised memory price. Same method as in our 11 September write-up: take the latest quarter annualised, i.e. today's volume and cost, and reprice revenue at a conservative price - the midpoint between today's DRAM price index and its three-year average. The index is built from Micron's disclosures: fiscal Q4 DRAM prices rose by a "high-teens" percentage, we take +18%. The index moved from 658 to 776, the three-year average from 226 to 283 (36% of today's level), the conservative midpoint from 442 to 529. Conservative EBITDA rose from $88bn to $119bn, net cash from $24bn to $68bn ($12.9bn of it customer prepayments).
Upside at the conservative memory price
| EV/EBITDA multiple | 11 Sep, price 1,017 | 1 Oct, price 1,065 |
|---|---|---|
| 23.6x (75th percentile, 3 years) | +84% | +139% |
| 18.7x (3 years ex the 2023-24 trough) | +46% | +90% |
| 16.5x (median ex days above 40x) | +29% | +68% |
| Multiple that justifies the price | 12.7x | 9.6x |
The share price rose 5% over the period while the upside at all three multiples roughly doubled: earnings are growing faster than the stock. The caveat from September stands: the three-year average is dragged down by the 2023 trough, and the 25% rise in the average itself this quarter is largely window mechanics - the cheapest quarter dropped out.
Bottom line
The report for the fourth quarter of fiscal 2026 showed record results: revenue grew 4.8 times, net income 11.8 times, gross margin reached 86.8%. Of $44bn operating cash flow, $33.2bn was left as free cash and $12.9bn came in as customer advances; capital expenditure is rising. The dividend is symbolic, yielding 0.05%. EV/EBITDA of 10.4 is above the three-year average of 10.2, but the portal's model gives an upside of +91%. The verdict is 'attractive': growth continues, debt burden is minimal, but the investor must be prepared for cyclicality.
Open the company's financial profile MU →
See also: market overview · valuation map · stock screeners