ORACLE CORP: Cloud revenue jumps 62%, but $28.5bn of capex keeps free cash flow at -$5.4bn
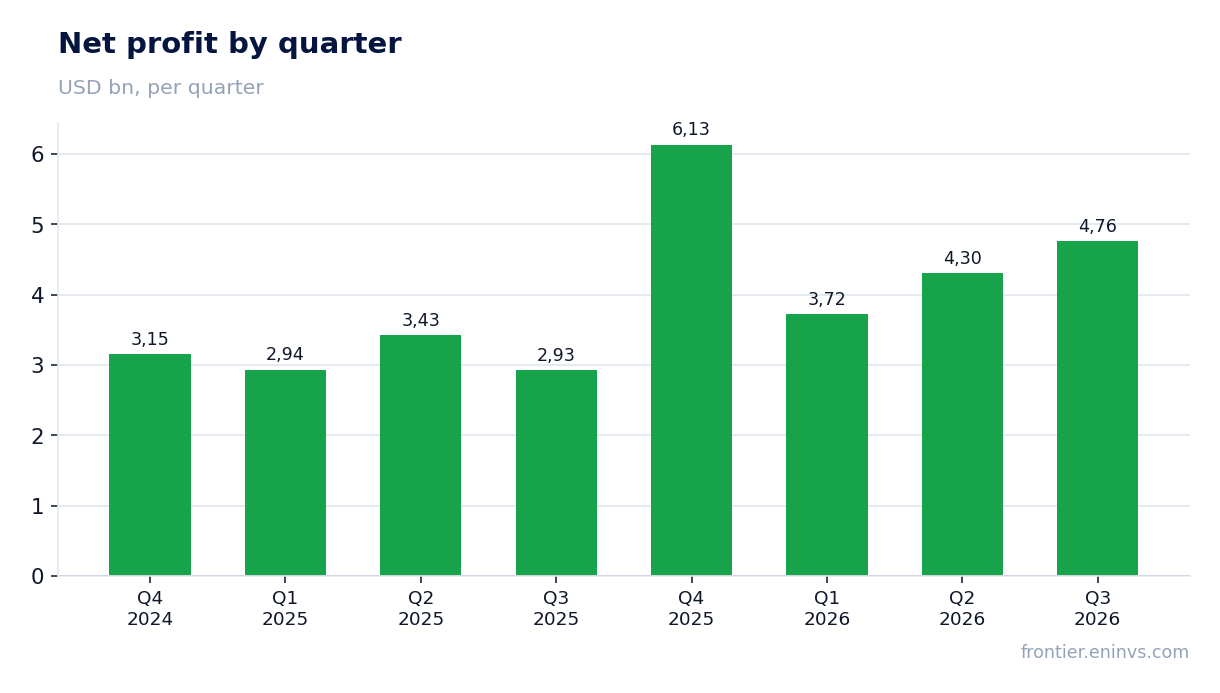
On 10 September, ORACLE CORP reported results for the first quarter of fiscal 2027 (quarter ended 31 August 2026). Revenue rose 29.6% year-on-year to $19.3bn, EBITDA – by 66.8% to $10.1bn, net profit – by 62.6% to $4.8bn. Growth was driven by the cloud segment, but capital expenditures reached $28.5bn, keeping free cash flow negative at -$5.4bn. The stock trades at EV/EBITDA of 16.1 versus its own three-year average of 23.6, leaving room for re-rating, but confirmation is needed that investments start to pay off. Verdict – rather attractive.
Key takeaways
— Revenue rose 29.6% year-on-year to $19.3bn, with almost all growth coming from cloud
— Cloud revenue jumped 62% and exceeded 60% of total revenue for the first time
— EBITDA margin climbed to 52.1% from 40.5% a year earlier, but almost half of the jump is depreciation added back
— Free cash flow stayed negative, at -$5.4bn, due to capital expenditures of $28.5bn
— Leverage stands at 3.89x LTM EBITDA, and net debt increased by $31.6bn over the year
— Dividend of $0.50 per share yields 1.46% – modest versus bond yields, but payout is low
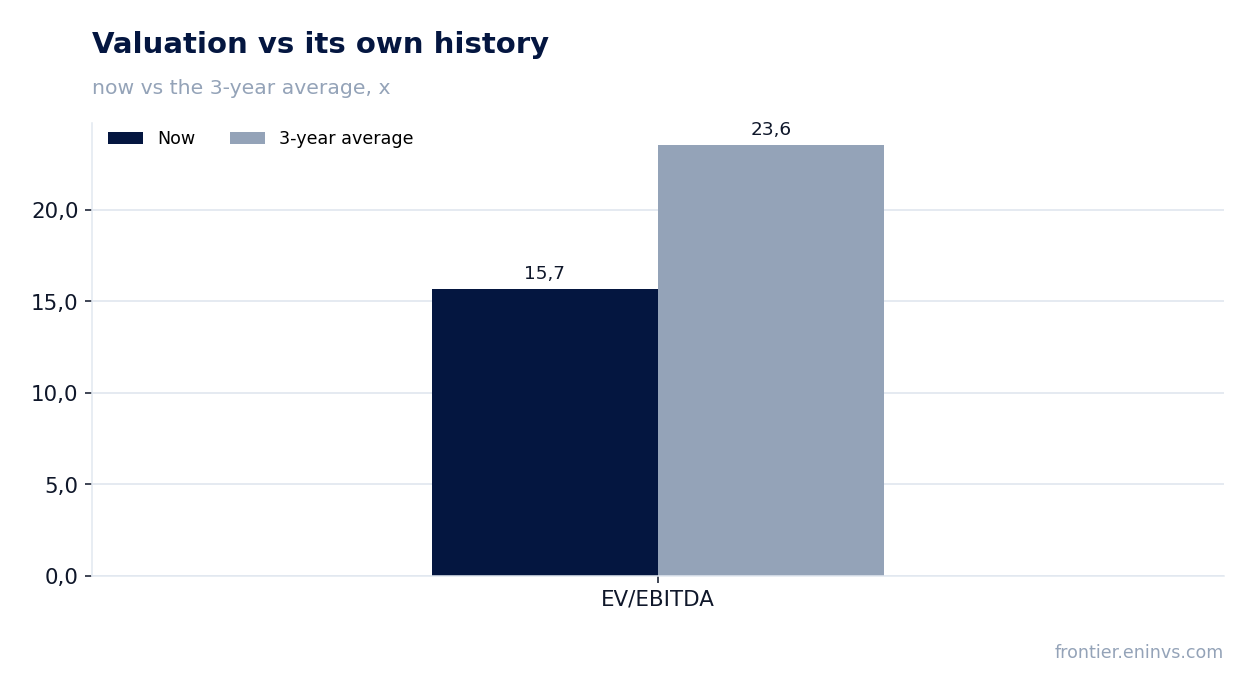
— The stock trades at EV/EBITDA of 16.1 versus its three-year average of 23.6, offering re-rating potential
Attractiveness
Key figures, USD bn
| Metric | Q3 2025 | Q3 2026 | Change |
|---|---|---|---|
| Revenue | 14.9 | 19.3 | +29.6% |
| EBITDA | 6.05 | 10.1 | +66.8% |
| Operating profit | 4.28 | 6.73 | +57.3% |
| Net profit | 2.93 | 4.76 | +62.6% |
| Operating cash flow | 8.14 | 23.1 | +183.8% |
| Capex | 8.50 | 28.5 | +235.2% |
| EBITDA margin | 40.5% | 52.1% | +11.6 pp |
| Net margin | 19.6% | 24.6% | +5.0 pp |
Revenue rose 29.6% year-on-year to $19.3bn, with almost all growth coming from cloud
Total revenue in the first quarter of fiscal 2027 reached $19.3bn, up 29.6% year-on-year. This was the fastest growth in at least three years: in the previous quarter (ended May 2026) it was 20.6%, and a quarter earlier – 21.7%. The acceleration was driven by the cloud segment.
Cloud revenue grew 62% to $11.6bn and exceeded 60% of total revenue for the first time. Within cloud, infrastructure services (IaaS) jumped 121% to $7.4bn, while applications (SaaS) added only 10% to $4.2bn. This gap reflects booming demand for AI training and inference capacity.
Traditional segments are shrinking: software license revenue fell 15%, and support declined 1%. This reflects customers migrating to the cloud. Hardware revenue rose 15% to $0.8bn, services – by 5% to $1.4bn, but their contribution to overall growth is small.
Cloud revenue jumped 62% and exceeded 60% of total revenue for the first time
Cloud revenue reached $11.6bn, up 62% year-on-year. Growth accelerated from 47% in the previous quarter. Infrastructure remains the driver: IaaS grew 121% to $7.4bn, while SaaS added only 10% to $4.2bn.
The company said it booked more than $30bn of additional AI cloud contracts in the quarter, and remaining performance obligations (RPO) rose by $209bn to $664bn. This creates a base for future revenue but requires significant infrastructure investment.
Oracle also noted it delivered more than 300,000 GPUs to its AI cloud customers, almost triple the capacity delivered in the previous quarter. This confirms the scale of capacity expansion but also increases capital expenditures.
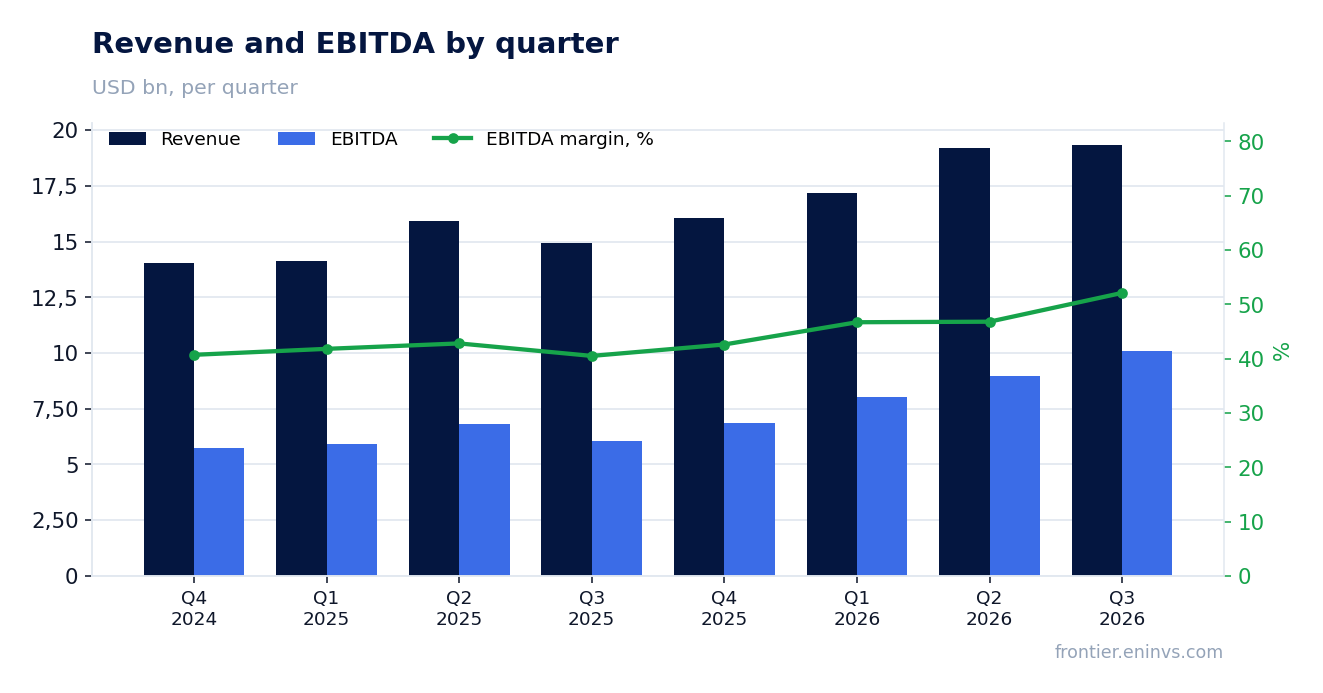
EBITDA margin climbed to 52.1% from 40.5% a year earlier, but almost half of the jump is depreciation added back
EBITDA in the reported quarter was $10.1bn, up 66.8% year-on-year. The EBITDA margin rose to 52.1% from 40.5% a year earlier. Operating expenses grew more slowly than revenue, but a large part of the jump comes from how EBITDA is calculated.
Operating expenses grew only 18% to $12.6bn, while revenue rose 29.6%. Sales and marketing expenses fell 12% to $1.8bn, research and development – by 4% to $2.4bn, amortisation of intangibles – by 52% to $0.2bn, and restructuring – by 77% to $0.09bn.
EBITDA adds depreciation back, and depreciation more than doubled to $3.2bn from $1.4bn as new data centres came on line. Operating margin, which is after that depreciation, rose far less – to 34.8% from 28.7%. Another ~$0.3bn came from lower restructuring charges: $0.1bn against $0.4bn a year earlier. So an EBITDA margin above 50% says more about the scale of the new capacity than about an equal gain in profitability.
Free cash flow stayed negative, at -$5.4bn, due to capital expenditures of $28.5bn
Operating cash flow in the reported quarter reached a record $23.1bn, up 184% year-on-year. However, capital expenditures amounted to $28.5bn, resulting in negative free cash flow of -$5.4bn. A year earlier, with capex of $8.5bn, free cash flow was also negative at -$0.4bn.
The increase in capex is driven by the expansion of infrastructure for cloud and AI services. The company is building data centres and purchasing equipment, including GPUs. This is necessary to meet demand but puts pressure on cash flow.
The record operating cash flow was largely made by customer prepayments: $11.4bn came in as prepayments with a significant financing component, and another $4.0bn from growth in other deferred revenue. Without the prepayments, operating cash flow would have been about $11.7bn and free cash flow about -$16.8bn. This money is an advance for future services, not earned profit, so negative free cash flow remains the key risk for dividends and debt.
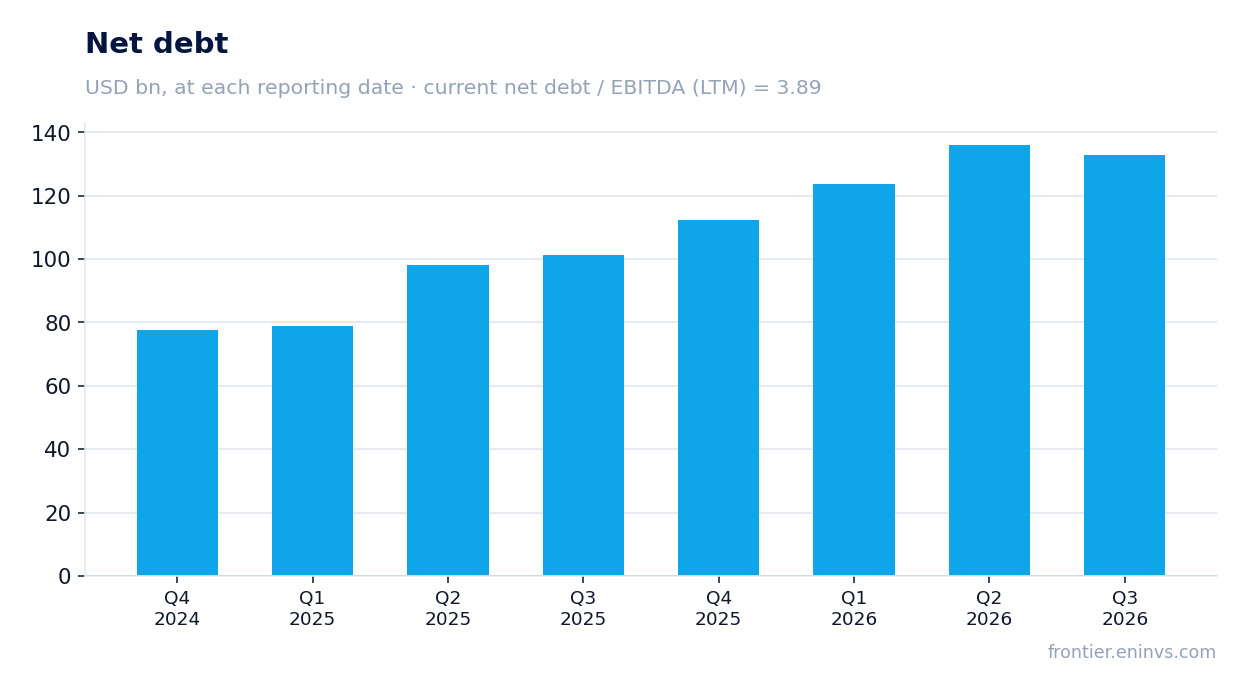
Leverage stands at 3.89x LTM EBITDA, and net debt increased by $31.6bn over the year
Net debt as of 31 August 2026 was $132.8bn. Over the quarter it decreased by $3.4bn – from $136.1bn on 31 May 2026. However, over 12 months net debt increased by $31.6bn: from $101.2bn on 31 August 2025 to $132.8bn on 31 August 2026. Over the year debt grew with borrowing and new data-centre leases; in the latest quarter the $20bn share sale let Oracle cut notes and borrowings by $4.2bn.
The net debt to LTM EBITDA ratio stands at 3.89. This is a moderate level for a company with high profitability, but it is higher than it would be with lower investments. Interest expense in the reported quarter was $1.4bn, up 55% year-on-year due to higher debt.
The company is actively raising capital: in the reported quarter it sold $20bn of shares through an At-the-Market programme. This strengthened equity, which rose to $67.2bn from $43.1bn at the end of the previous quarter. Raising funds reduces leverage but dilutes existing shareholders.
Dividend of $0.50 per share yields 1.46% – modest versus bond yields, but payout is low
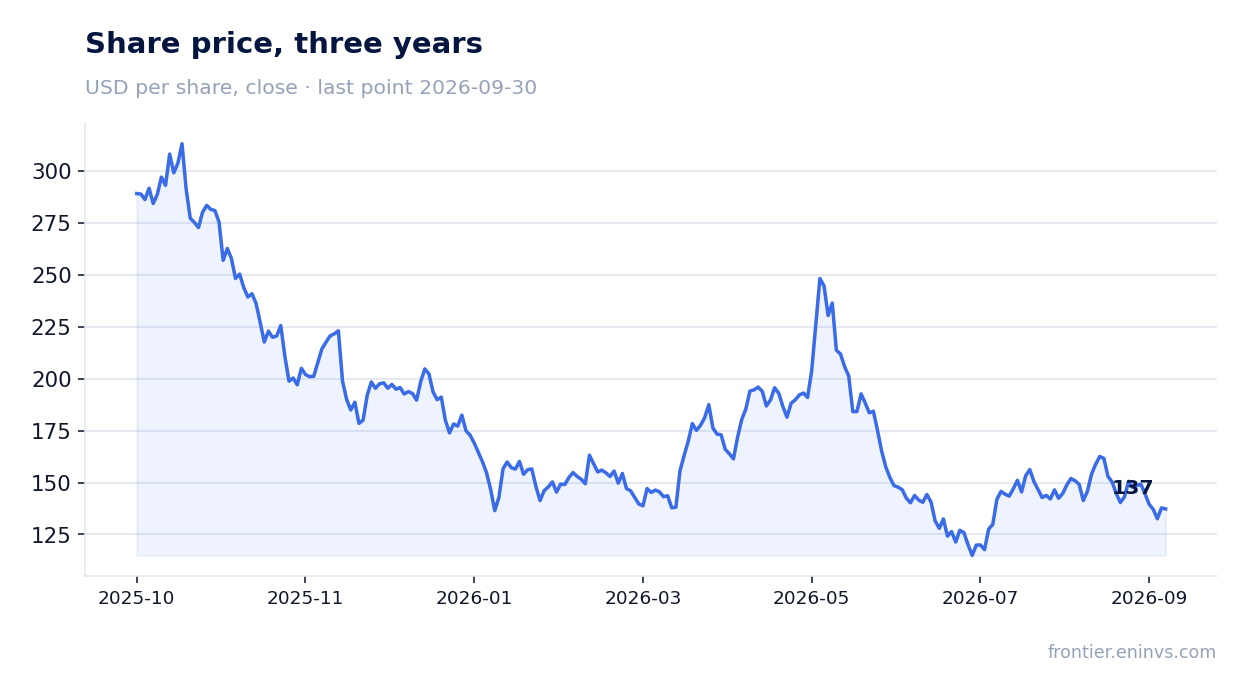
The board declared a quarterly dividend of $0.50 per share. The payment will be made on 23 October 2026 to shareholders of record on 9 October. This corresponds to an annual dividend of $2.00 per share. At the 30 September close of $137.3, the dividend yield is 1.46%.
The yield is modest compared to US Treasury yields. However, the payout ratio is low: the company directs only part of its profit to dividends. Over the last 12 months, net profit was $18.9bn, and dividend payments were about $6.3bn (based on $2.00 per share and approximately 3.1bn shares). This is about 33% of profit.
Next year, we expect the dividend could be increased if free cash flow returns to positive territory. However, with negative free cash flow and high capital expenditures, dividend growth may be limited. The main risk is further debt accumulation to finance investments, which could lead to a revision of dividend policy.
The stock trades at EV/EBITDA of 16.1 versus its three-year average of 23.6, offering re-rating potential
The current EV/EBITDA multiple on LTM basis is 16.1. This is significantly below its own three-year average of 23.6. The gap is explained both by EBITDA growth and by the share price decline: from the close before the report (9 September, $161.6) the stock has fallen 15.1% to $137.3 on 30 September. The results came out after the close on 10 September, and the next session ended 1.7% lower.
The P/E ratio on LTM basis is 21.9. Return on equity (ROE) is 34.8%, reflecting high profitability but also the effect of increased debt. Market capitalisation is $415.2bn.
According to the portal's model, which compares EBITDA growth with a target multiple, the upside to fair value is estimated at +39%. This is our own estimate, not a market consensus. It assumes the company can maintain high EBITDA growth and that the multiple will revert to historical levels.
Valuation on the latest reported figures
| Metric | Value |
|---|---|
| Market cap | 415 bn USD |
| P/E (LTM) | 21.9 |
| EV/EBITDA (LTM) | 16.1 |
| P/B | 9.77 |
| Net debt / EBITDA (LTM) | 3.89 |
| Operating cash flow (LTM) | 46.9 bn |
| ROE | 34.8% |
| Dividend yield (12m) | 1.5% |
| EV/EBITDA, 3-year average | 23.6 |
Bottom line
ORACLE CORP delivered a strong quarter: revenue rose 29.6%, EBITDA – by 66.8%, margin climbed to 52.1%. However, growth is driven by record capital expenditures, which led to negative free cash flow of $5.4bn. Leverage is moderate at 3.89x EBITDA, but net debt increased by $31.6bn over the year. The dividend is modest, but the payout ratio is low. The EV/EBITDA multiple of 16.1 versus the three-year average of 23.6 looks attractive but requires confirmation of margin sustainability and a return to positive free cash flow. Verdict – rather attractive.
Open the company's financial profile ORCL →
See also: market overview · valuation map · stock screeners