PROCTER & GAMBLE Co: quarterly profit fell amid rising costs, but company remains confident in the future

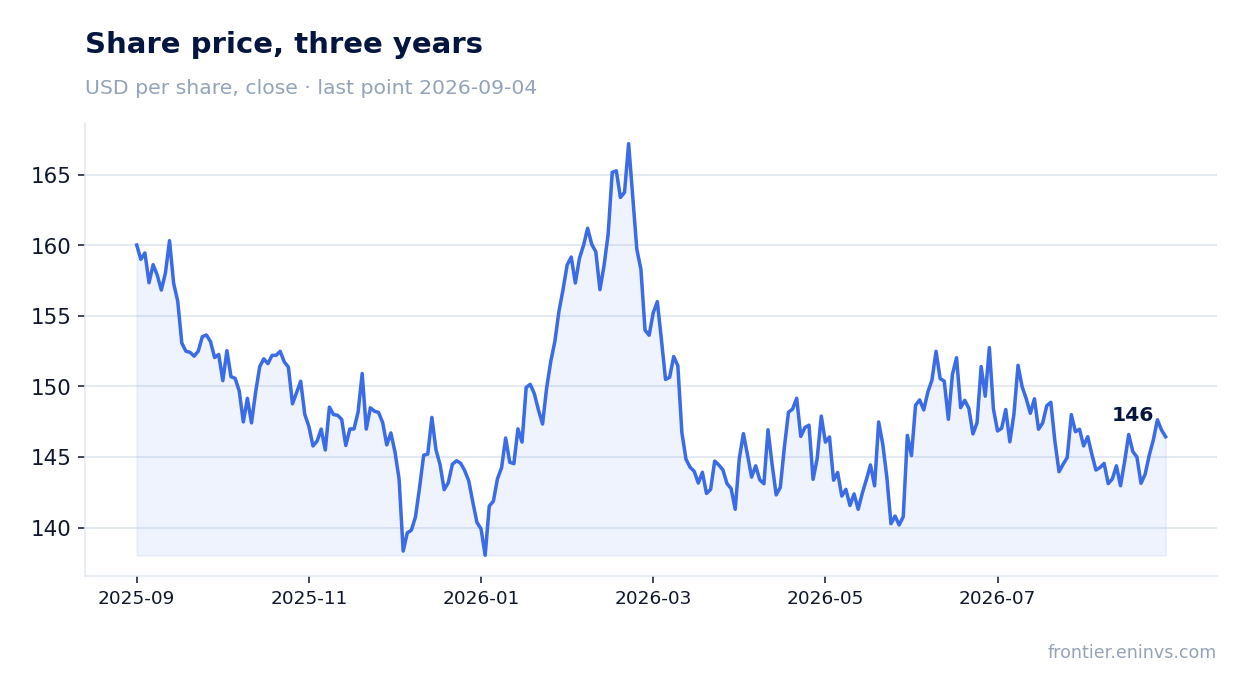
On July 29, 2026, PROCTER & GAMBLE Co reported results for the fourth quarter of fiscal 2026. Revenue increased 1.5% to $21,203 million, EBITDA fell 6.2% to $4,761 million, and net profit declined 2.9% to $3,044 million. At the current price, the share looks rather unattractive: multiples are above historical averages, and the portal's model implies a 7% downside.
Key takeaways
— Revenue rose 1.5% in the quarter, but organic sales were flat
— EBITDA fell 6.2% due to higher SG&A and lower gross margin
— Net profit declined 2.9% despite a one-time gain from the Glad stake sale
— Leverage stands at 1.11 EBITDA, but debt increased during the quarter
— Dividends and buybacks in fiscal 2026 exceeded $15 billion
— Company expects slower EPS growth in fiscal 2027 due to costs and currency
Attractiveness
Key figures, USD bn
| Metric | Q4 2025 | Q4 2026 | Change |
|---|---|---|---|
| Revenue | 20.9 | 21.2 | +1.5% |
| EBITDA | 5.08 | 4.76 | -6.2% |
| Operating profit | 4.67 | 3.95 | -15.5% |
| Net profit | 3.13 | 3.04 | -2.9% |
| Operating cash flow | 4.99 | 5.10 | +2.3% |
| Capex | 1.00 | 1.02 | +2.7% |
| EBITDA margin | 24.3% | 22.5% | -1.8 pp |
| Net margin | 15.0% | 14.4% | -0.6 pp |
Revenue rose 1.5% in the quarter, but organic sales were flat
In the fourth quarter of fiscal 2026, PROCTER & GAMBLE Co's revenue reached $21,203 million, up 1.5% year-over-year. Growth was mainly driven by favorable foreign exchange (+1%) and rounding (+1%), while volume, price, and mix had no impact. Organic sales, excluding currency and M&A, were flat year-over-year.
Segment performance was mixed: Beauty grew 6% on volume gains in Asia and Europe, Grooming added 1%, Health Care and Fabric & Home Care each rose 1%, while Baby, Feminine & Family Care declined 1%. Overall, the company maintains moderate growth, but it is not accelerating: over the last four quarters, growth ranged from -2.1% to +7.4%.
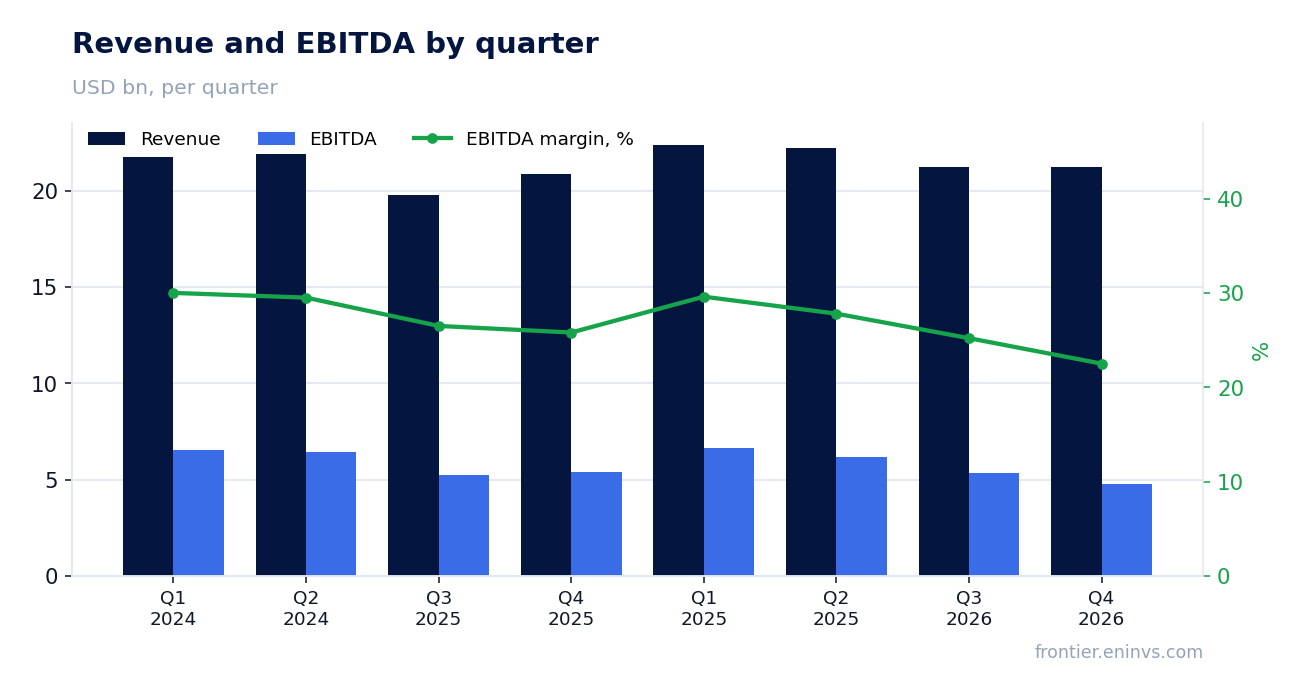
EBITDA fell 6.2% due to higher SG&A and lower gross margin
EBITDA in the reported quarter was $4,761 million, down 6.2% year-over-year. EBITDA margin fell from 24.3% to 22.5%. The main reason is an increase in selling, general and administrative expenses (SG&A) of 160 basis points as a percentage of sales, along with a 60-basis-point decline in gross margin.
The company attributes higher SG&A to reinvestments in marketing and other areas, partially offset by productivity gains. Gross margin declined due to unfavorable mix and higher costs, though productivity and tariffs had a positive effect. Excluding restructuring, operating margin fell 130 basis points.
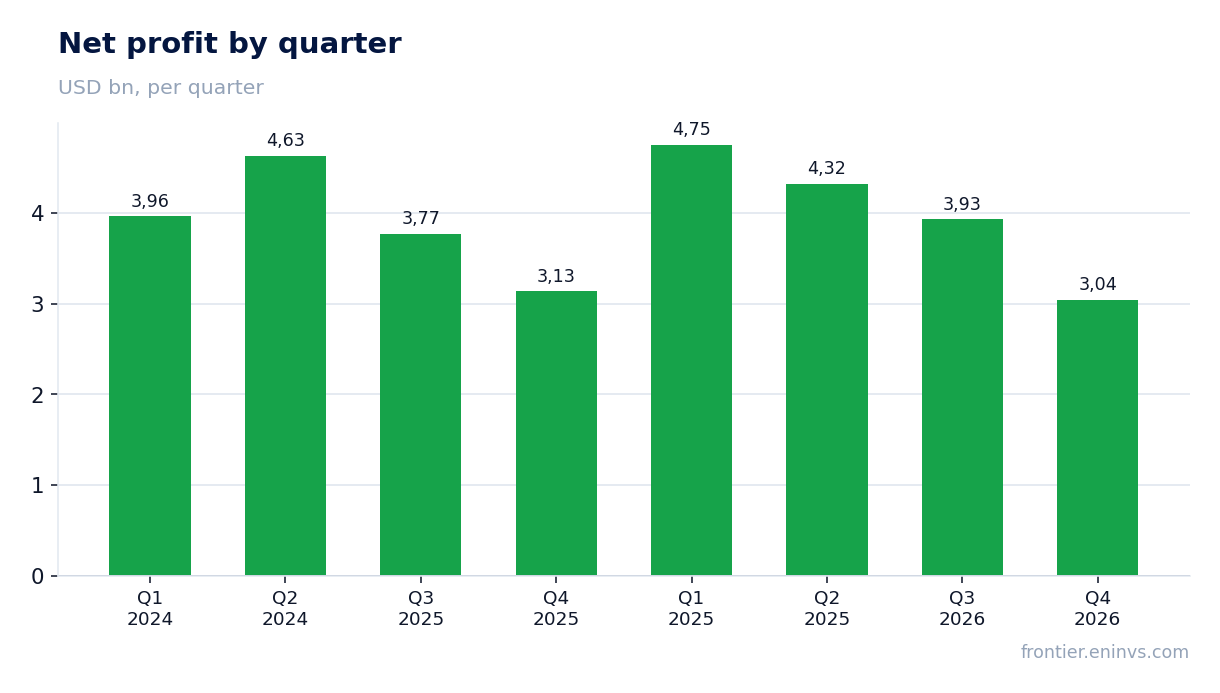
Net profit declined 2.9% despite a one-time gain from the Glad stake sale
Net profit for the quarter was $3,044 million, down 2.9% year-over-year. The decline was driven by higher costs and lower operating income, which were not fully offset by a one-time gain from the sale of the Glad joint venture stake. Excluding this gain, the drop would have been larger.
The one-time gain from the Glad agreement dissolution amounted to $261 million after tax, partially supporting profit. Nevertheless, operating income fell 9% to $3,949 million, and net margin contracted from 15.0% to 14.4%.
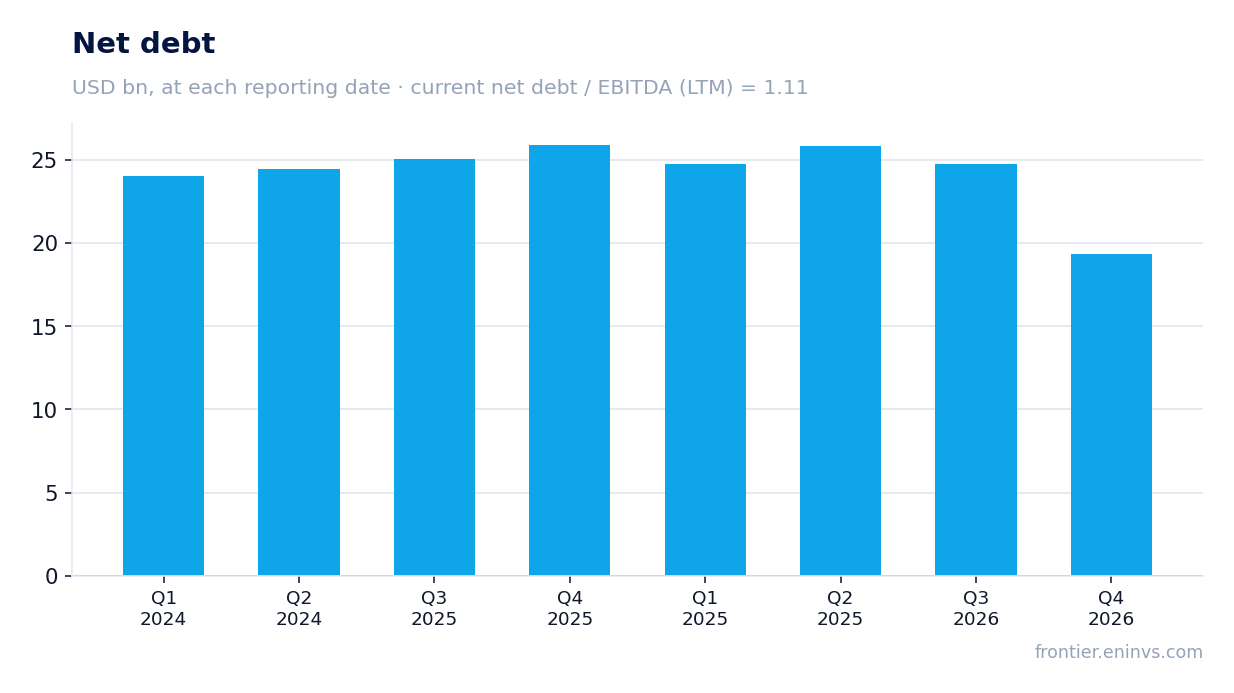
Leverage stands at 1.11 EBITDA, but debt increased during the quarter
At the end of the quarter, PROCTER & GAMBLE Co's net debt stood at $25,908 million, up $5.4 billion from the previous reporting date. The ratio of net debt to EBITDA for the trailing twelve months is 1.11. Over the year, net debt increased by $6.6 billion, reflecting higher borrowings to fund dividends and share repurchases.
Operating cash flow for the quarter was $5,100 million, capital expenditures – $1,023 million. Free cash flow after capex was about $4,077 million, covering quarterly dividends but leaving little room for debt reduction.
Dividends and buybacks in fiscal 2026 exceeded $15 billion
In fiscal 2026, PROCTER & GAMBLE Co returned over $15 billion to shareholders: $10.2 billion in dividends and $5.0 billion in share repurchases. Dividend per share for the year was $4.2589, up 4% year-over-year. The company has increased its dividend for 70 consecutive years.
Operating cash flow for the year reached $19.5 billion, supporting 100% adjusted free cash flow productivity. For fiscal 2027, the company plans to pay about $10 billion in dividends and repurchase $5 billion of shares, which will require stable cash generation.
Company expects slower EPS growth in fiscal 2027 due to costs and currency
PROCTER & GAMBLE Co provided guidance for fiscal 2027: organic sales growth of 1–3%, GAAP EPS growth of 1–5%, and Core EPS growth of flat to 3%. The company estimates a negative impact of $1 billion after tax from higher raw materials, energy, and transportation costs, as well as a $50 million negative effect from unfavorable foreign exchange.
The combined negative impact of these factors is $0.56 per share, equivalent to an 8% drag on Core EPS growth. The company also expects restructuring charges of $0.13–$0.17 per share in 2027. This indicates that profit growth will slow compared to 2026.
Valuation on the latest reported figures
| Metric | Value |
|---|---|
| Market cap | 340 bn USD |
| P/E (LTM) | 21.2 |
| EV/EBITDA (LTM) | 15.7 |
| P/B | 6.51 |
| Net debt / EBITDA (LTM) | 1.11 |
| Operating cash flow (LTM) | 19.5 bn |
| ROE | 22.3% |
| Dividend yield (12m) | 3.0% |
| EV/EBITDA, 3-year average | 18.1 |
Bottom line
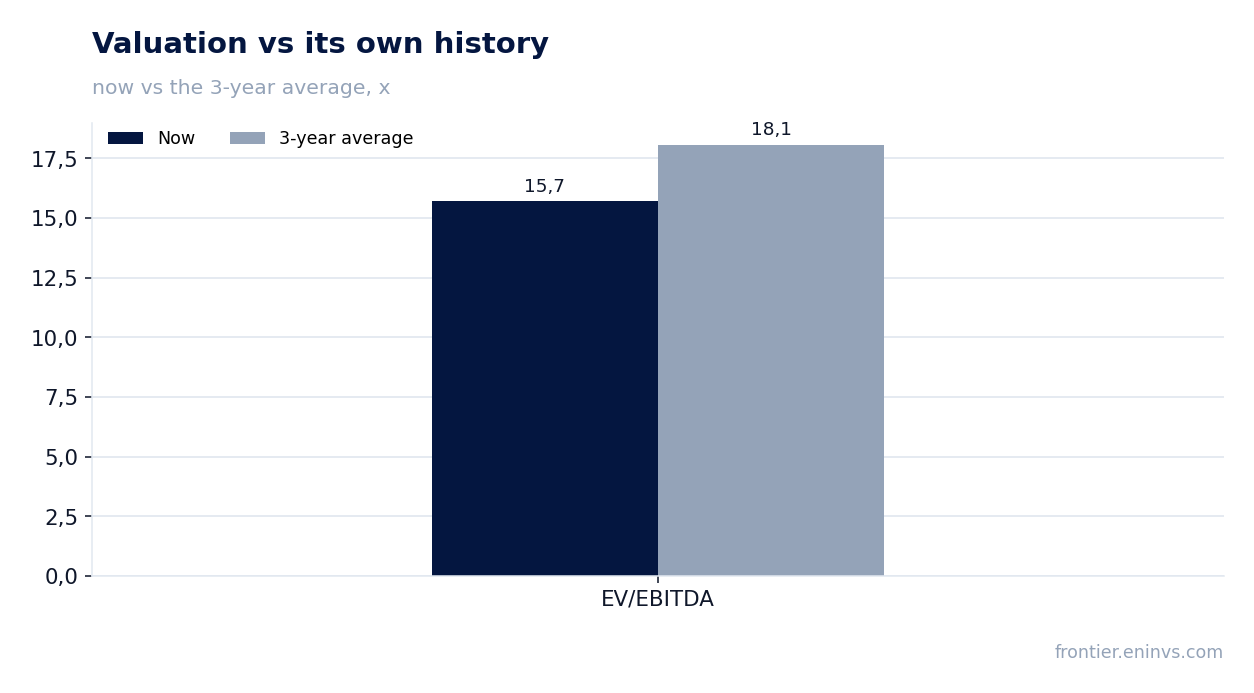
PROCTER & GAMBLE Co finished the quarter with moderate revenue growth but declining profitability due to higher costs. A one-time gain from the Glad stake sale partially supported profit, but without it the decline would have been deeper. The company maintains a high dividend yield and continues returning capital to shareholders, but debt is rising. At current valuation – P/E of 21.2 and EV/EBITDA of 15.7 versus a three-year average of 18.1 – the share looks expensive. The portal's model implies a 7% downside, making the stock rather unattractive.
Open the company's financial profile PG →
See also: market overview · valuation map · stock screeners