S&P Global: revenue up 10%, operating profit up 17% – Ratings and Indices carried the quarter

On July 28, S&P Global released its second-quarter 2026 results. Revenue came in at $4,146 million, up 10.4% year on year, operating profit rose 17% to $1,812 million, and net income increased 13.5% to $1,217 million. The top-line growth pace was roughly unchanged from the first quarter, when it also stood at 10.4%, while the EBITDA margin improved to 51.1% from 48.9%. At a price implying an LTM EV/EBITDA of 15.3 versus a three-year average of 23.3, the stock looks rather attractive. Part of that discount is technical: the share price no longer includes Mobility, spun off on 1 July, while LTM EBITDA and the 30 June net debt still do, so the gap to history is overstated.
Key takeaways
— Revenue grew 10.4% year on year, with the pace roughly unchanged from the first quarter
— EBITDA margin rose to 51.1% on growth in Ratings, Indices and Market Intelligence
— Net income rose 13.5%, and 22% excluding the spun-off Mobility; the quarter carried almost no one-off gains
— Net debt of $11.0bn at 30 June includes $2.0bn of Mobility notes that left with it on 1 July; LTM net debt/EBITDA is 1.32
— Free cash flow remains solid, and capital expenditures are minimal
— Dividend yield of 0.94% with a quarterly dividend of $0.97 per share
— LTM EV/EBITDA of 15.3 versus a three-year average of 23.3 – the stock trades below its own history
Attractiveness
Key figures, USD bn
| Metric | Q2 2025 | Q2 2026 | Change |
|---|---|---|---|
| Revenue | 3.75 | 4.15 | +10.4% |
| EBITDA | 1.83 | 2.12 | +15.5% |
| Operating profit | 1.55 | 1.81 | +16.8% |
| Net profit | 1.07 | 1.22 | +13.5% |
| Operating cash flow | 1.45 | 1.44 | -0.4% |
| Capex | 0.06 | 0.04 | -37.7% |
| EBITDA margin | 48.9% | 51.1% | +2.2 pp |
| Net margin | 28.5% | 29.4% | +0.9 pp |
Revenue grew 10.4% year on year, with the pace roughly unchanged from the first quarter
In the second quarter of 2026, S&P Global's revenue reached $4,146 million, up 10.4% from a year earlier. In the first quarter, growth was also 10.4%, meaning the pace was roughly unchanged. This is steady double-digit growth for the second consecutive quarter.
The main contribution came from the ratings agency and index businesses. Ratings revenue rose 17% to $1,339 million, while Indices grew 20% to $534 million. Market Intelligence added 6%, and Energy only 2%. Thus, growth is concentrated in the two most margin-rich segments.
The spin-off of Mobility, completed on July 1, 2026, is not yet reflected in reported results as a discontinued operation for the second quarter, but the company has already provided pro forma figures excluding that business. On a pro forma basis, revenue rose 11% to $3,678 million, confirming the strength of the remaining four divisions.
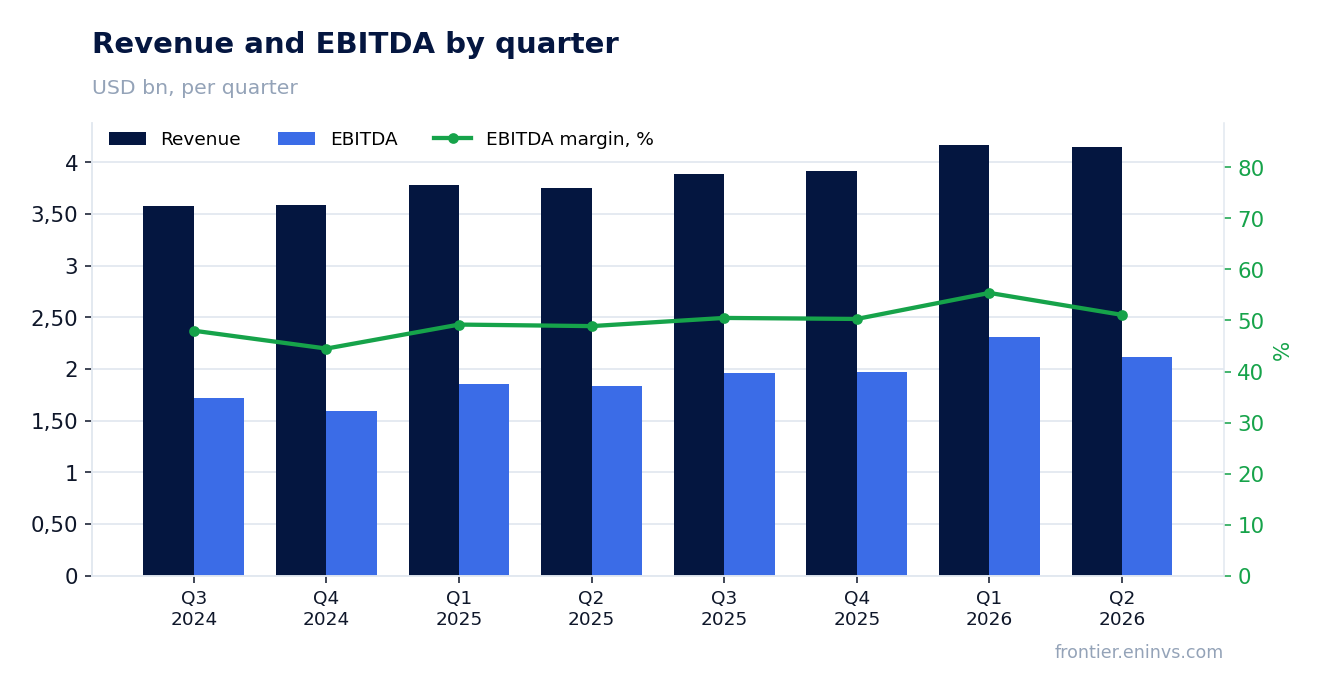
EBITDA margin rose to 51.1% on growth in Ratings, Indices and Market Intelligence
The EBITDA margin in the second quarter was 51.1% versus 48.9% a year earlier. That is an improvement of 2.2 percentage points. Operating profit rose 17% to $1,812 million, outpacing revenue growth and driving the margin expansion.
The company attributes the margin improvement to revenue growth and margin expansion in Ratings, Indices and Market Intelligence. In these segments, operating profit grew 28%, 21% and 13% respectively. Expenses in Ratings even declined 2%, amplifying the effect.
The net margin also improved, to 29.4% from 28.5%. However, net income grew only 13.5%, lagging operating profit due to higher interest expenses and taxes.
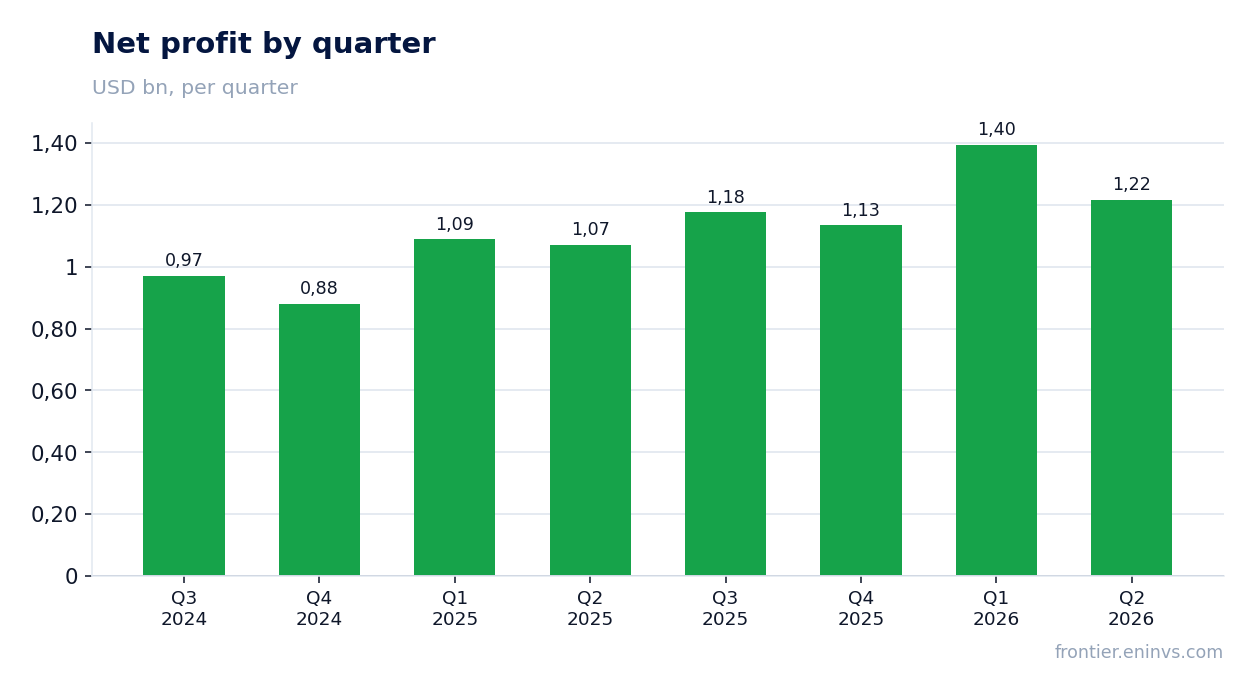
Net income rose 13.5%, and 22% excluding Mobility
Net income in the second quarter of 2026 was $1,217 million, up 13.5% from a year earlier. One-off gains barely touched this quarter: the gain on dispositions was only $11 million in the second quarter ($3 million a year earlier). Of the $186 million for the half-year, $172 million came in the first quarter.
In addition, expenses include one-off charges: severance, acquisition and disposition costs, and asset impairments. For example, in the Market Intelligence segment, second-quarter 2026 expenses include $15 million in severance and $1 million in disposition-related costs. In Energy, severance of $8 million, impairment of $4 million, and other one-off items.
Excluding Mobility, pro forma net income rose 22% to $1,205 million, and diluted earnings per share increased 26% to $4.08. So operating momentum is stronger than reported net income suggests: it was held back by the departing Mobility and separation costs, not inflated by one-offs.
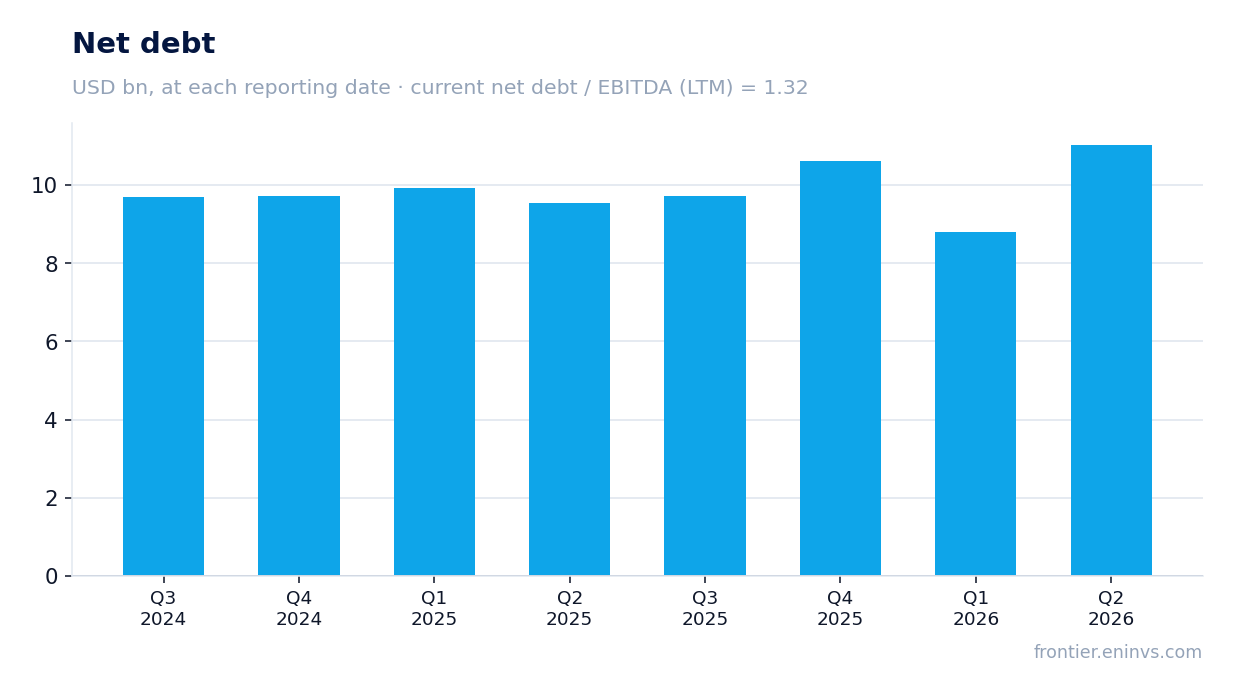
Net debt of $11.0bn includes $2.0bn of Mobility notes that left with the spin-off
Net debt as of June 30, 2026, was $11,036 million. That is $2.2 billion more than on March 31, 2026 ($8.8 billion), and $1.5 billion more than a year earlier ($9.5 billion on June 30, 2025). Almost all of the increase is the $2.0 billion of senior notes Mobility Global issued on May 19 ahead of the spin-off: they sit on the June 30 balance sheet but became Mobility's sole obligation on July 1. So the June 30 figure overstates S&P Global's own debt by about $2 billion.
The LTM net debt/EBITDA ratio stands at 1.32. This is a moderate level that the company services comfortably. Interest expenses in the second quarter rose 13% to $87 million along with debt.
Operating cash flow for the first half of 2026 was $2,476 million, slightly above the prior-year figure of $2,398 million. This covers capital expenditures ($65 million) and dividends ($575 million), but not the whole $1.5 billion share buyback: the gap was covered by the proceeds of Mobility's notes and $361 million from disposals.
Free cash flow remains solid, and capital expenditures are minimal
Operating cash flow in the second quarter of 2026 was $1,439 million, virtually unchanged from $1,445 million a year earlier. Capital expenditures were minimal at $38 million, down $23 million from the second quarter of 2025. Free cash flow thus remains stable.
For the first half of 2026, capital expenditures totaled only $65 million versus $104 million a year earlier. The company does not require significant fixed-asset investment because its business is based on intellectual services and data. This allows nearly all operating cash flow to be directed to dividends and share buybacks.
However, the $1.5 billion buyback in the first half exceeded free cash flow; the difference was covered by Mobility's pre-spin borrowing and disposal proceeds. The company plans to repurchase more than $7 billion in shares in 2026, which may require additional financing.
Dividend yield of 0.94% with a quarterly dividend of $0.97 per share
The board of directors approved a quarterly dividend of $0.97 per share. At the current price, the trailing 12-month dividend yield is 0.94%. This is a modest level, explained by the company's high valuation and low payout ratio.
In the first half of 2026, $575 million was paid out in dividends, representing about 22% of net income. The company follows a policy of returning capital to shareholders through dividends and buybacks, with buybacks being the more significant tool.
Our estimate for the 2026 dividend assumes the current quarterly payment is maintained at $0.97, giving about $3.88 per share for the year. That corresponds to a yield of roughly 0.94% at the current price. Dividend growth will depend on earnings and a possible increase in the payout ratio, but the company has not yet signaled a hike.
LTM EV/EBITDA of 15.3 versus a three-year average of 23.3 – the stock trades below its own history
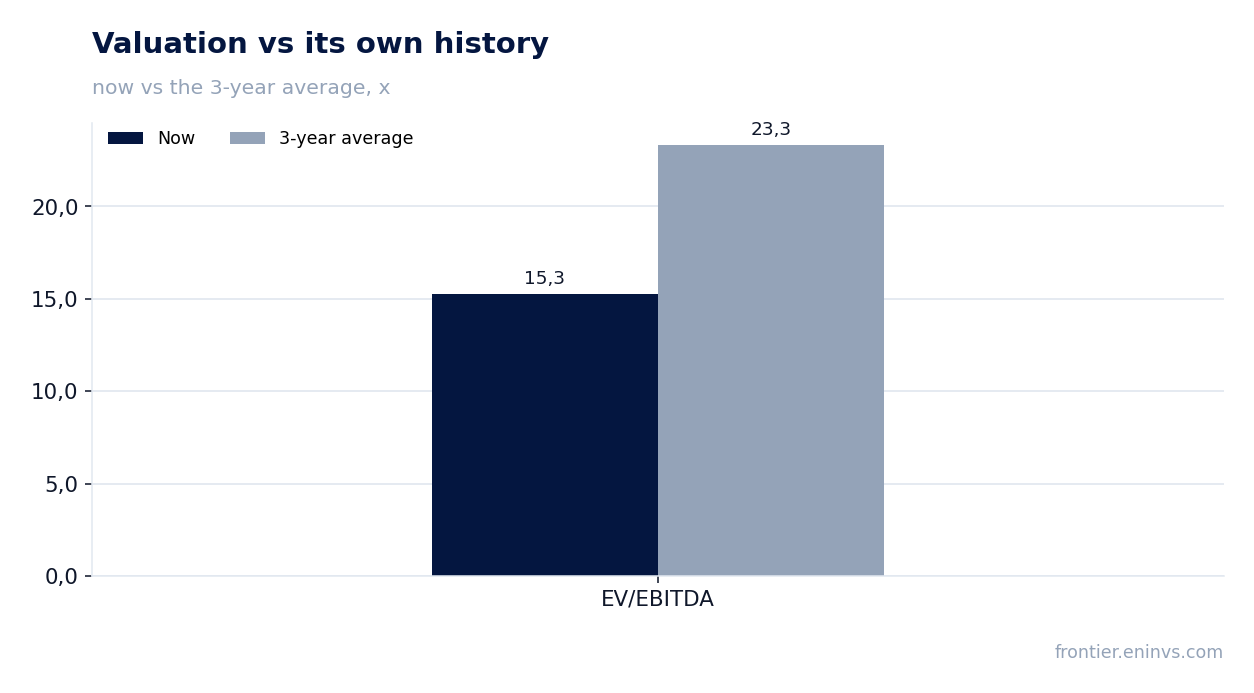
The LTM EV/EBITDA multiple is 15.3, well below the three-year average of 23.3. Part of that discount is technical: the share price no longer includes Mobility, spun off on 1 July, while LTM EBITDA and the 30 June net debt still do, so the gap to history is overstated. The third-quarter report, the first without Mobility, will give a clean read.
The LTM P/E is 23.7. Return on equity (ROE) stands at 15.5%, supporting the valuation. However, the dividend yield of only 0.94% does not make the stock attractive for income investors.
Our fundamental valuation model, based on EBITDA growth and a target multiple, indicates upside to fair value of +12%. This is not a consensus forecast but the output of our own model. Given strong operating results and a multiple below its own history, the stock looks attractive for growth-oriented investors.
Valuation on the latest reported figures
| Metric | Value |
|---|---|
| Market cap | 117 bn USD |
| P/E (LTM) | 23.7 |
| EV/EBITDA (LTM) | 15.3 |
| P/B | 3.75 |
| Net debt / EBITDA (LTM) | 1.32 |
| Operating cash flow (LTM) | 5.73 bn |
| ROE | 15.5% |
| Dividend yield (12m) | 0.9% |
| EV/EBITDA, 3-year average | 23.3 |
Bottom line
S&P Global delivered strong operating results: revenue grew 10.4%, EBITDA margin reached 51.1%, and pro forma EPS rose 26%. Reported net income grew 13.5%, held back by the departing Mobility and higher interest expense. Net debt of $11.0 billion at June 30 includes $2.0 billion of Mobility notes; LTM net debt/EBITDA is a comfortable 1.32. The stock trades at an EV/EBITDA of 15.3 versus a three-year average of 23.3, but part of that discount is created by the spin-off; our model shows 12% upside. Investors should wait for the first report without Mobility and watch debt against the buyback.
Open the company's financial profile SPGI →
See also: market overview · valuation map · stock screeners